Visualizations Fritz Lekschas Head of Visualization Research at Ozette Technologies lekschas.de linkedin.com/in/flekschas 1 Visual Analytics Lab at Tufts University
First author of CEV paper and former Ozette intern Evan Greene, Ozette Co-Founder–––––––– First author and creator of data transformation methods –––––––– Nezar Abdennur, Asst. Prof. at UMASS MED Long term collaborator and embedding nerd Arpan Neupane, Principal Computational Biologist–––––––– helps me better understand immunology–––––––– 2
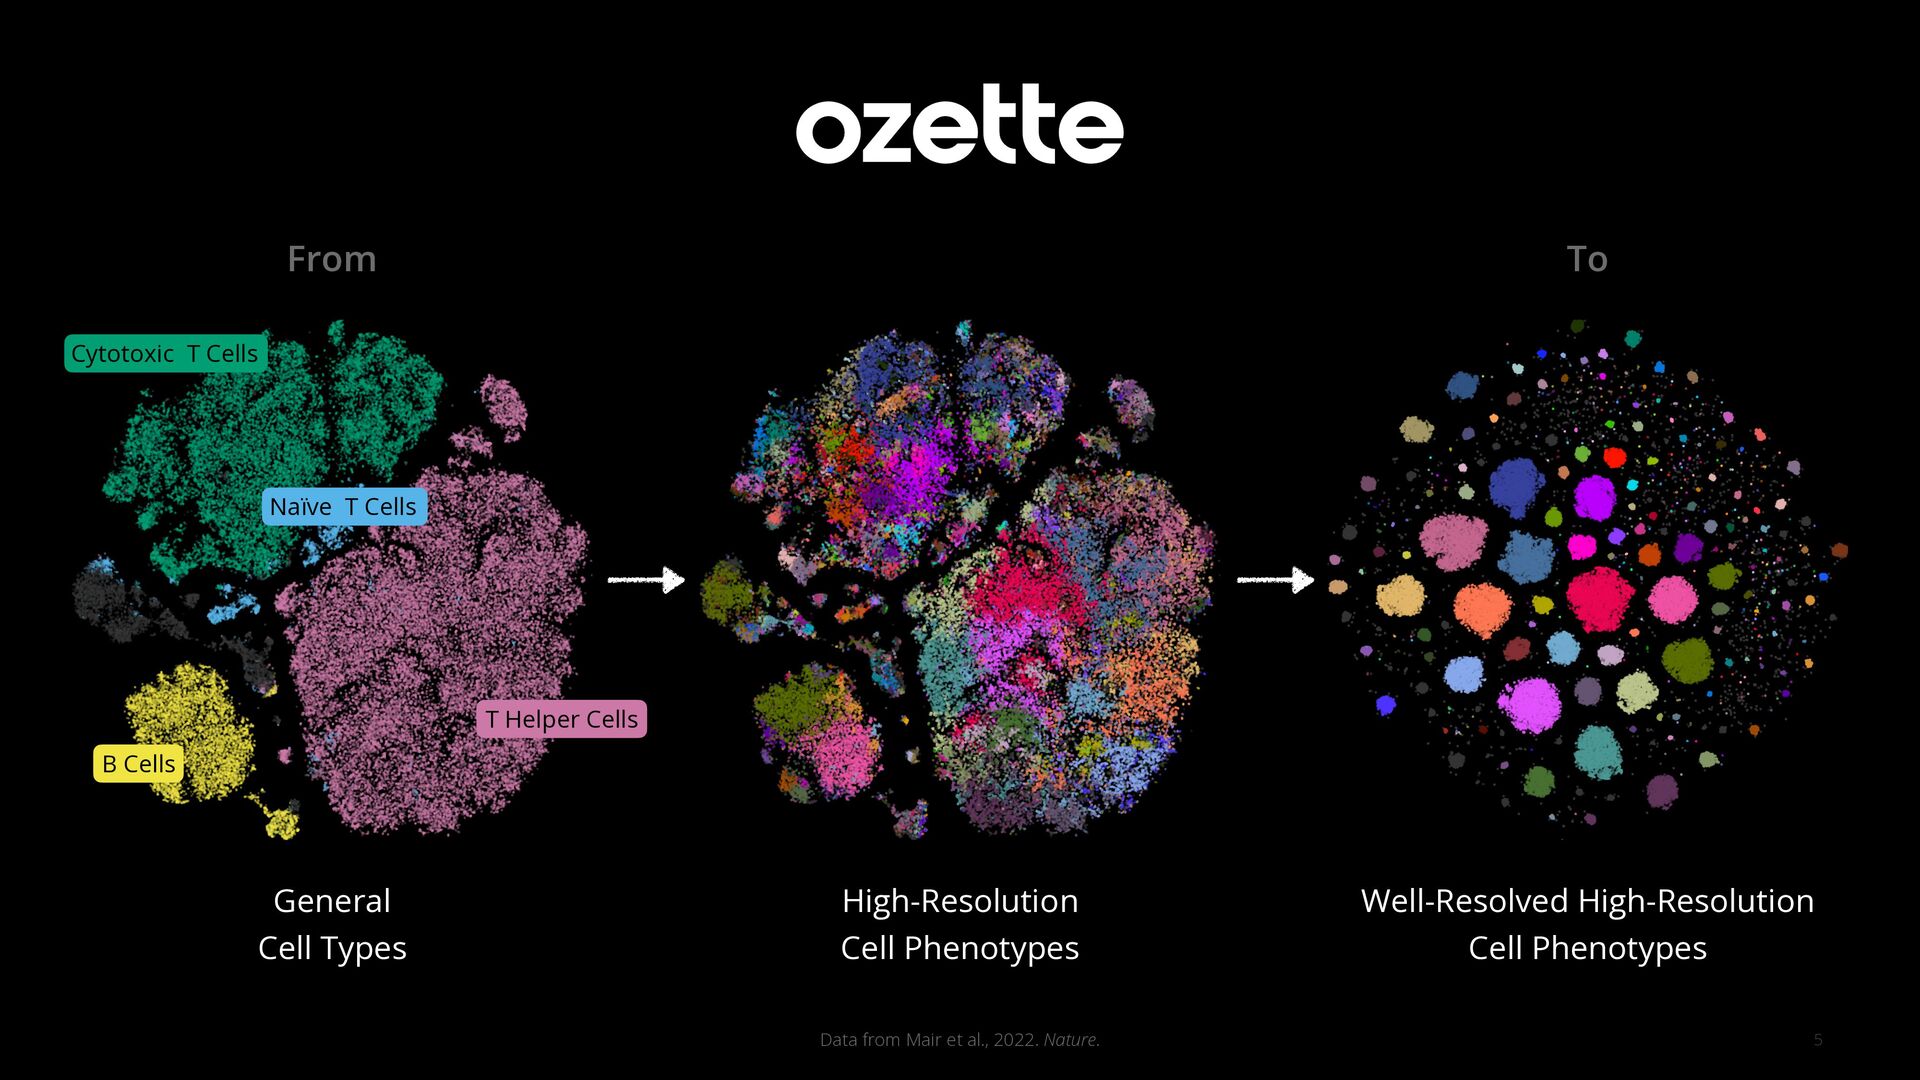
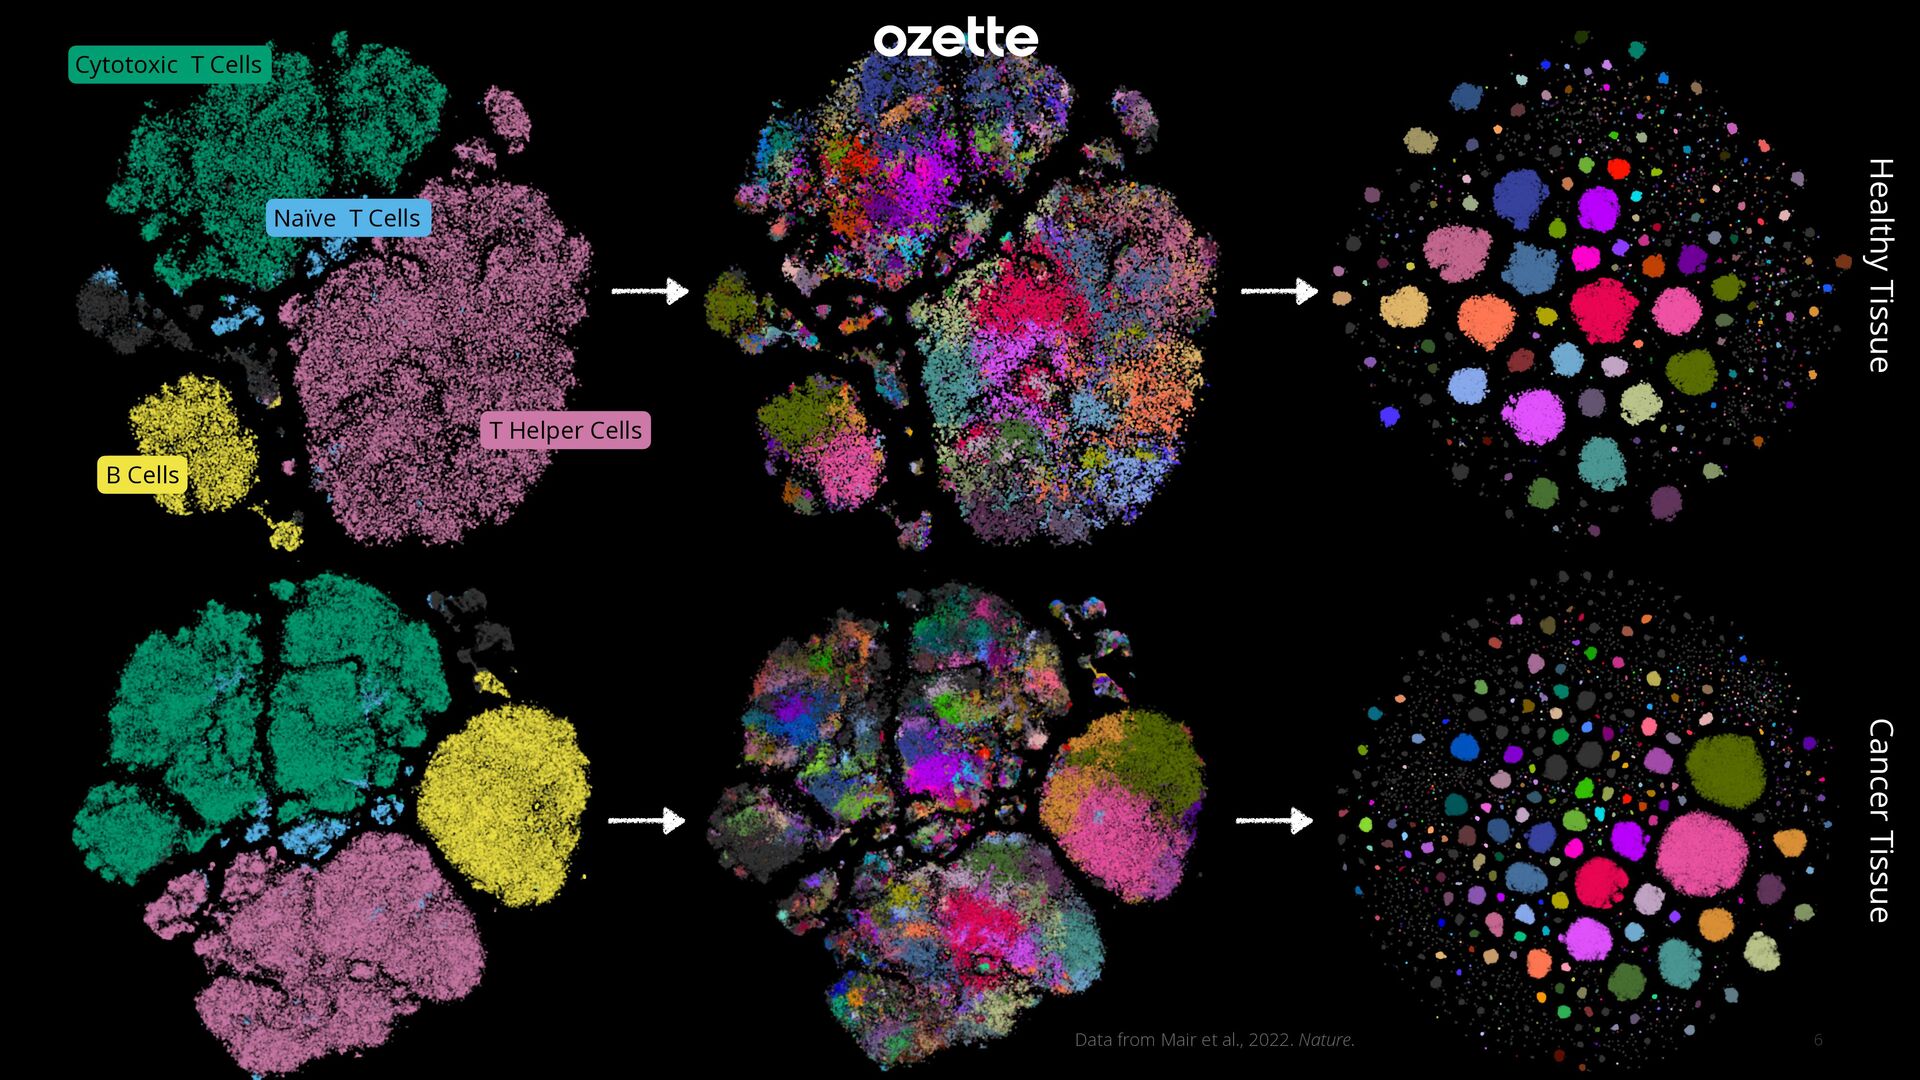
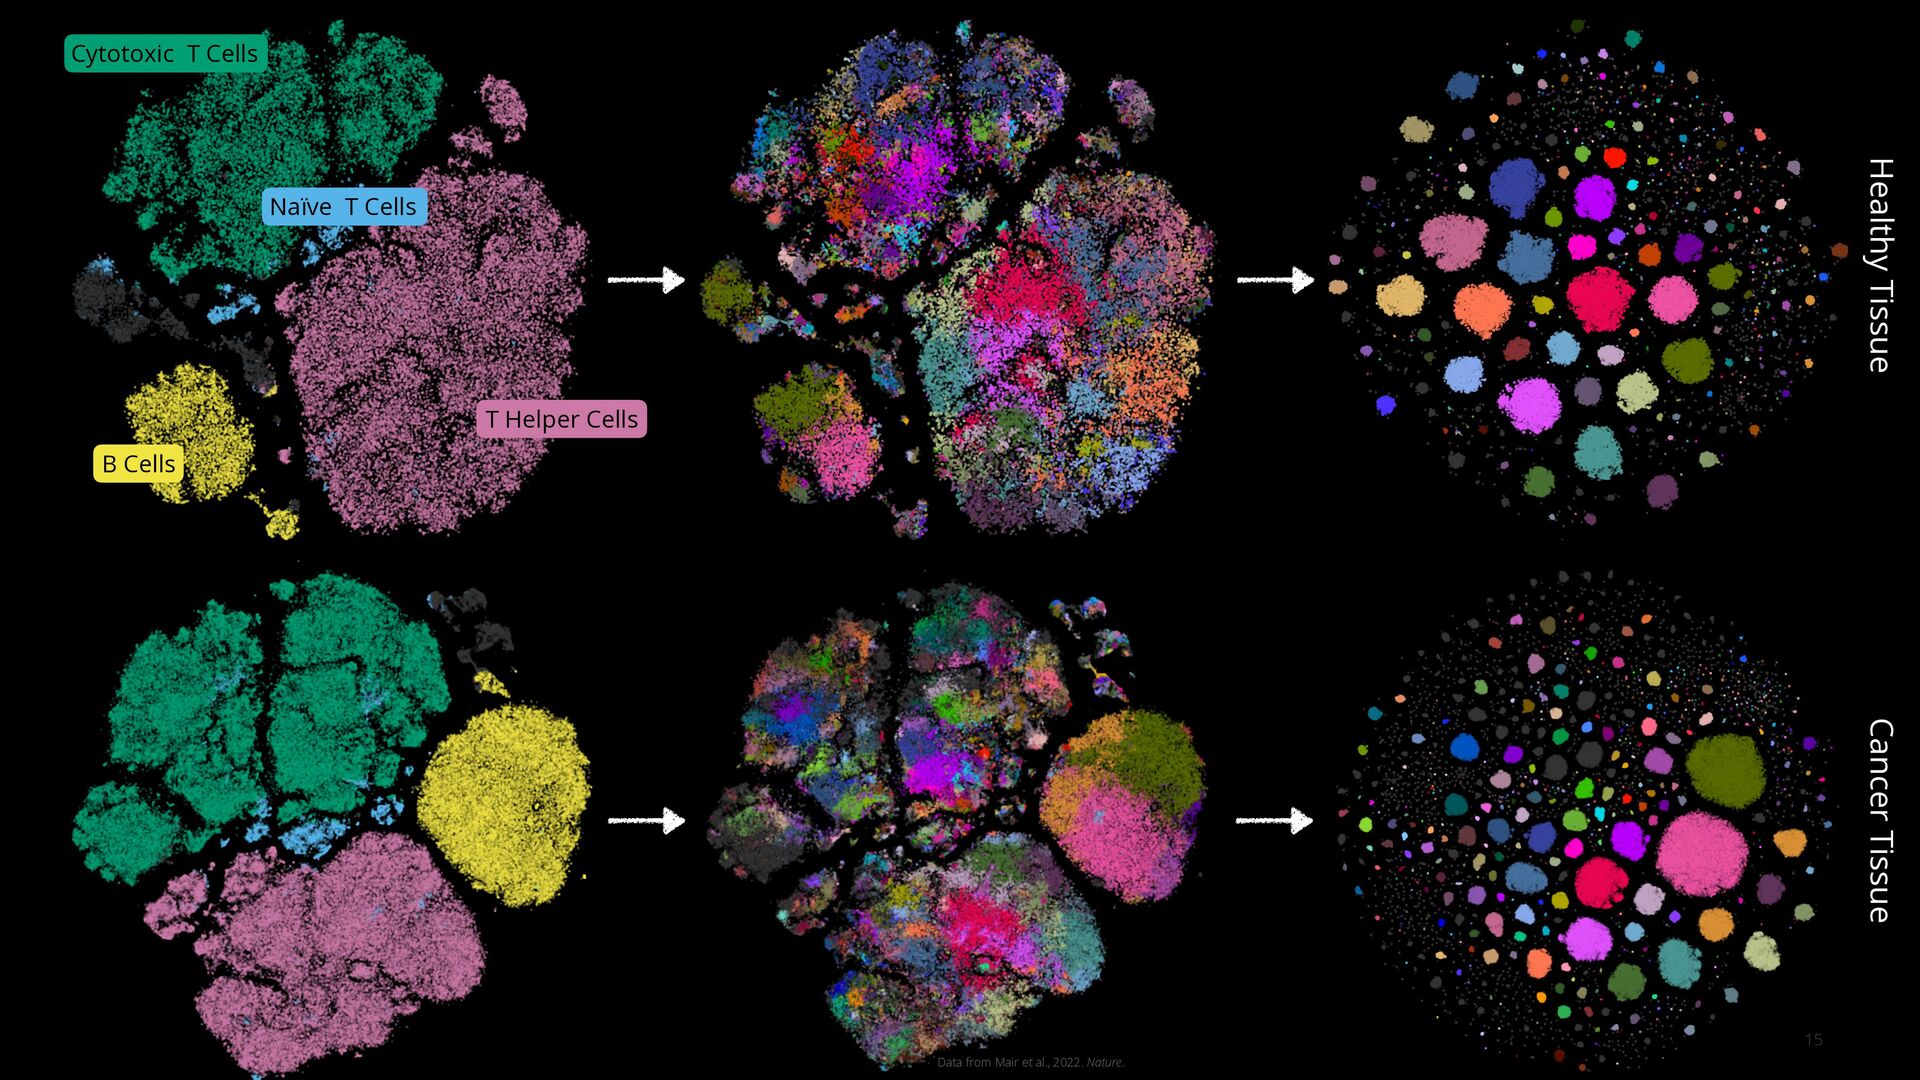
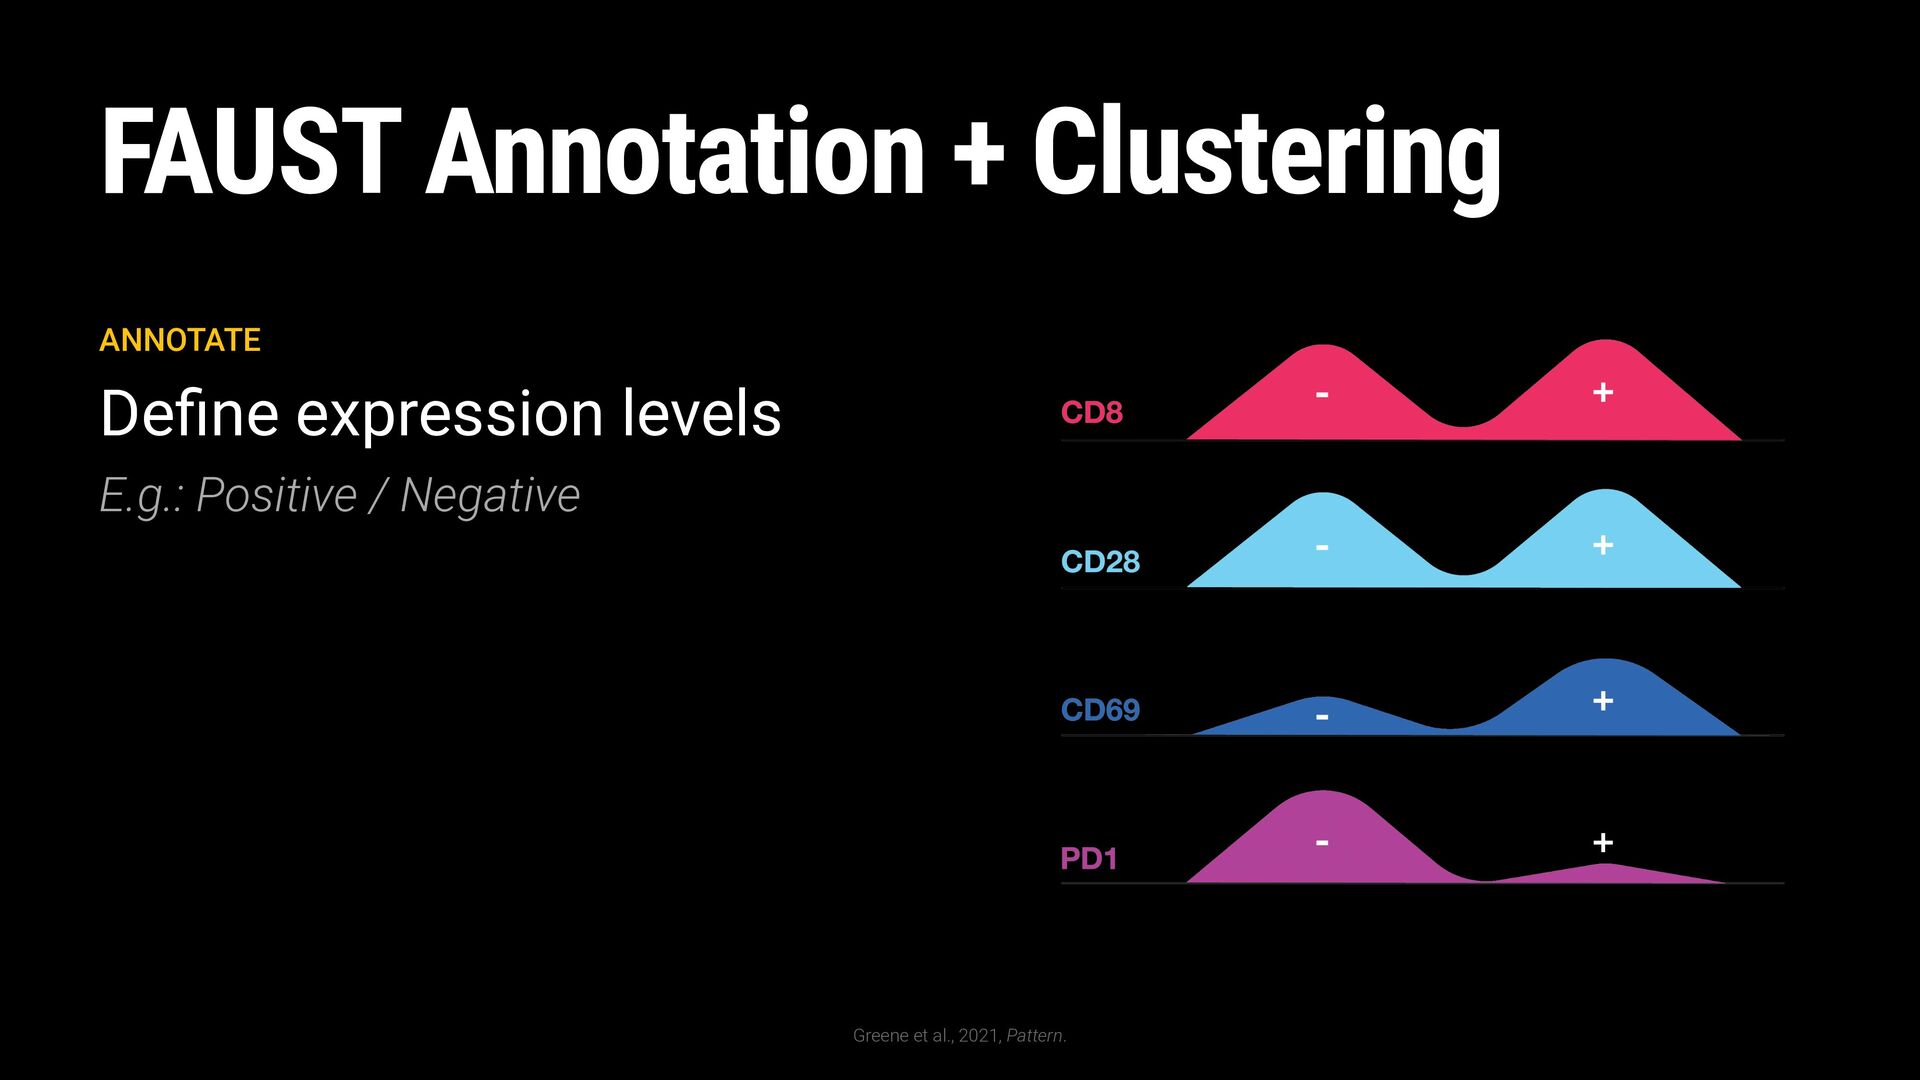
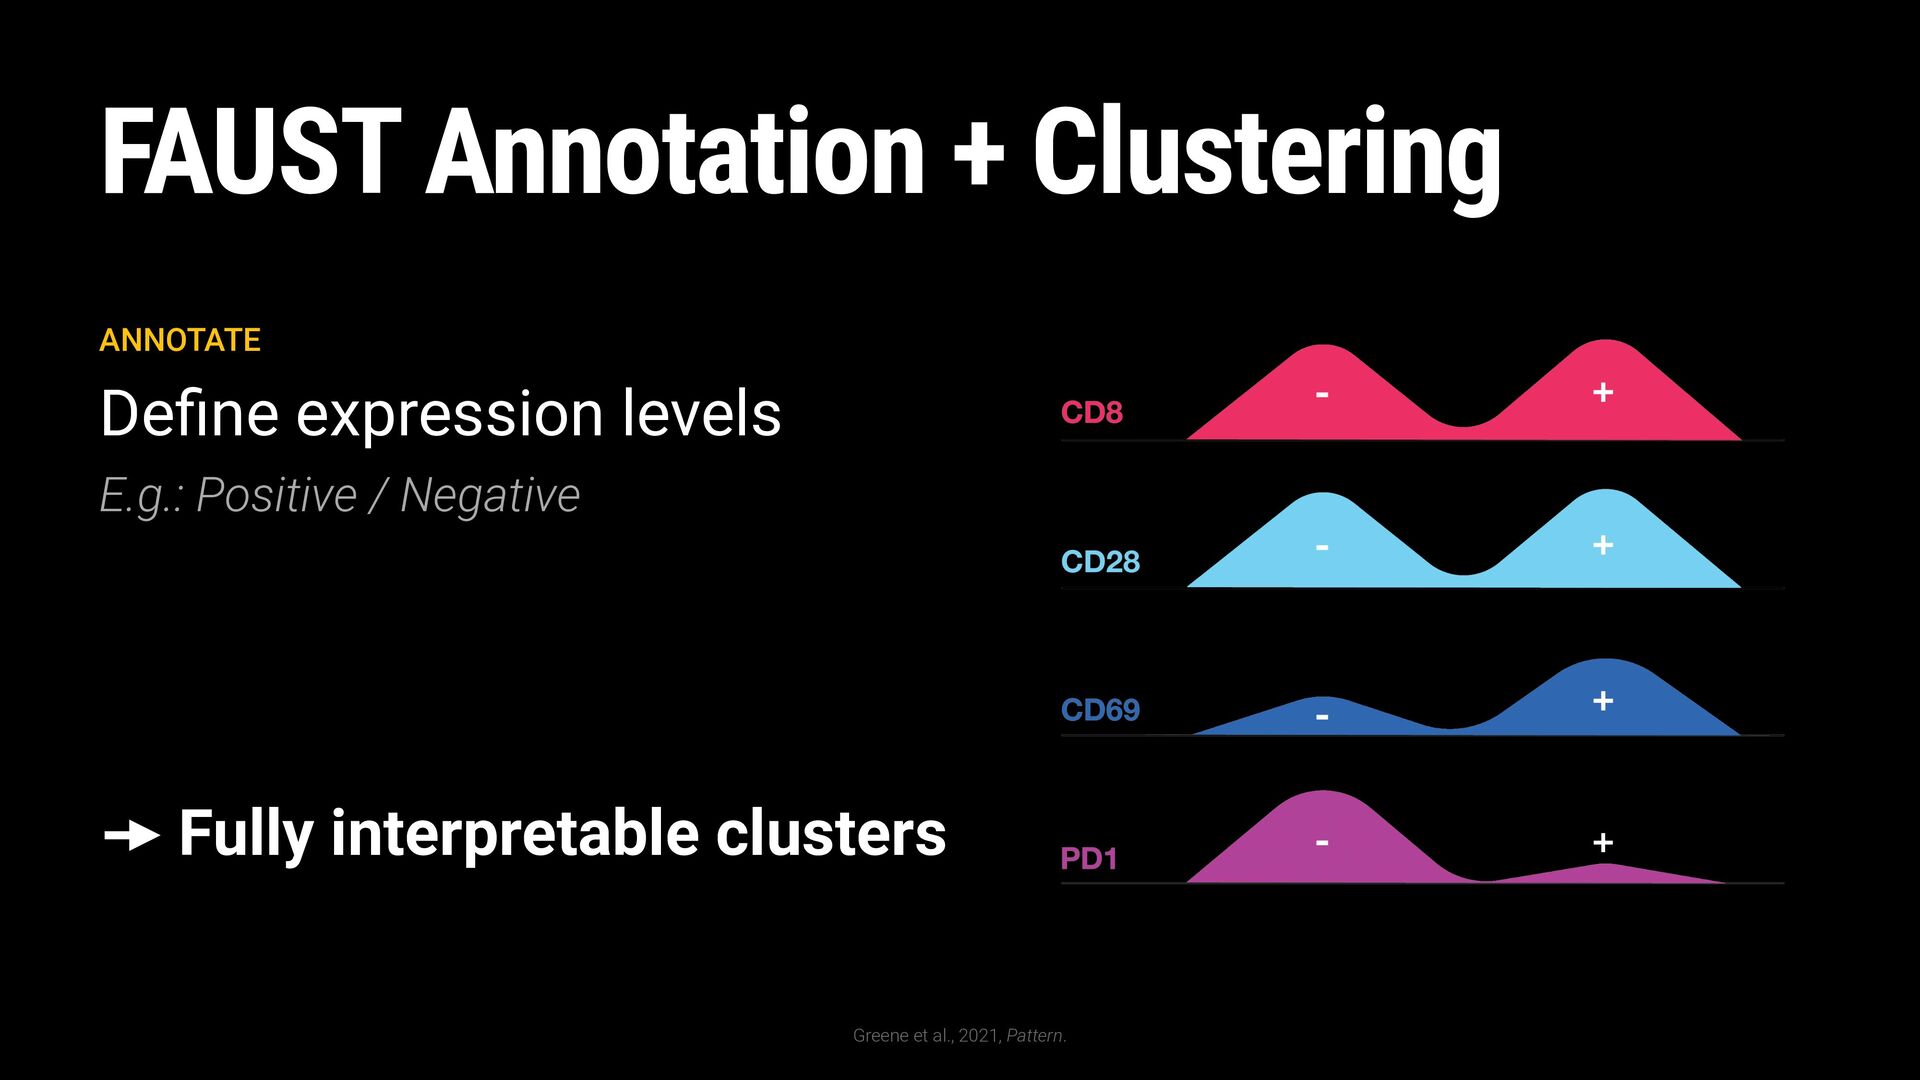
General Cell Types High-Resolution Cell Phenotypes Well-Resolved High-Resolution Cell Phenotypes Cytotoxic T Cells T Helper Cells B Cells Naïve T Cells
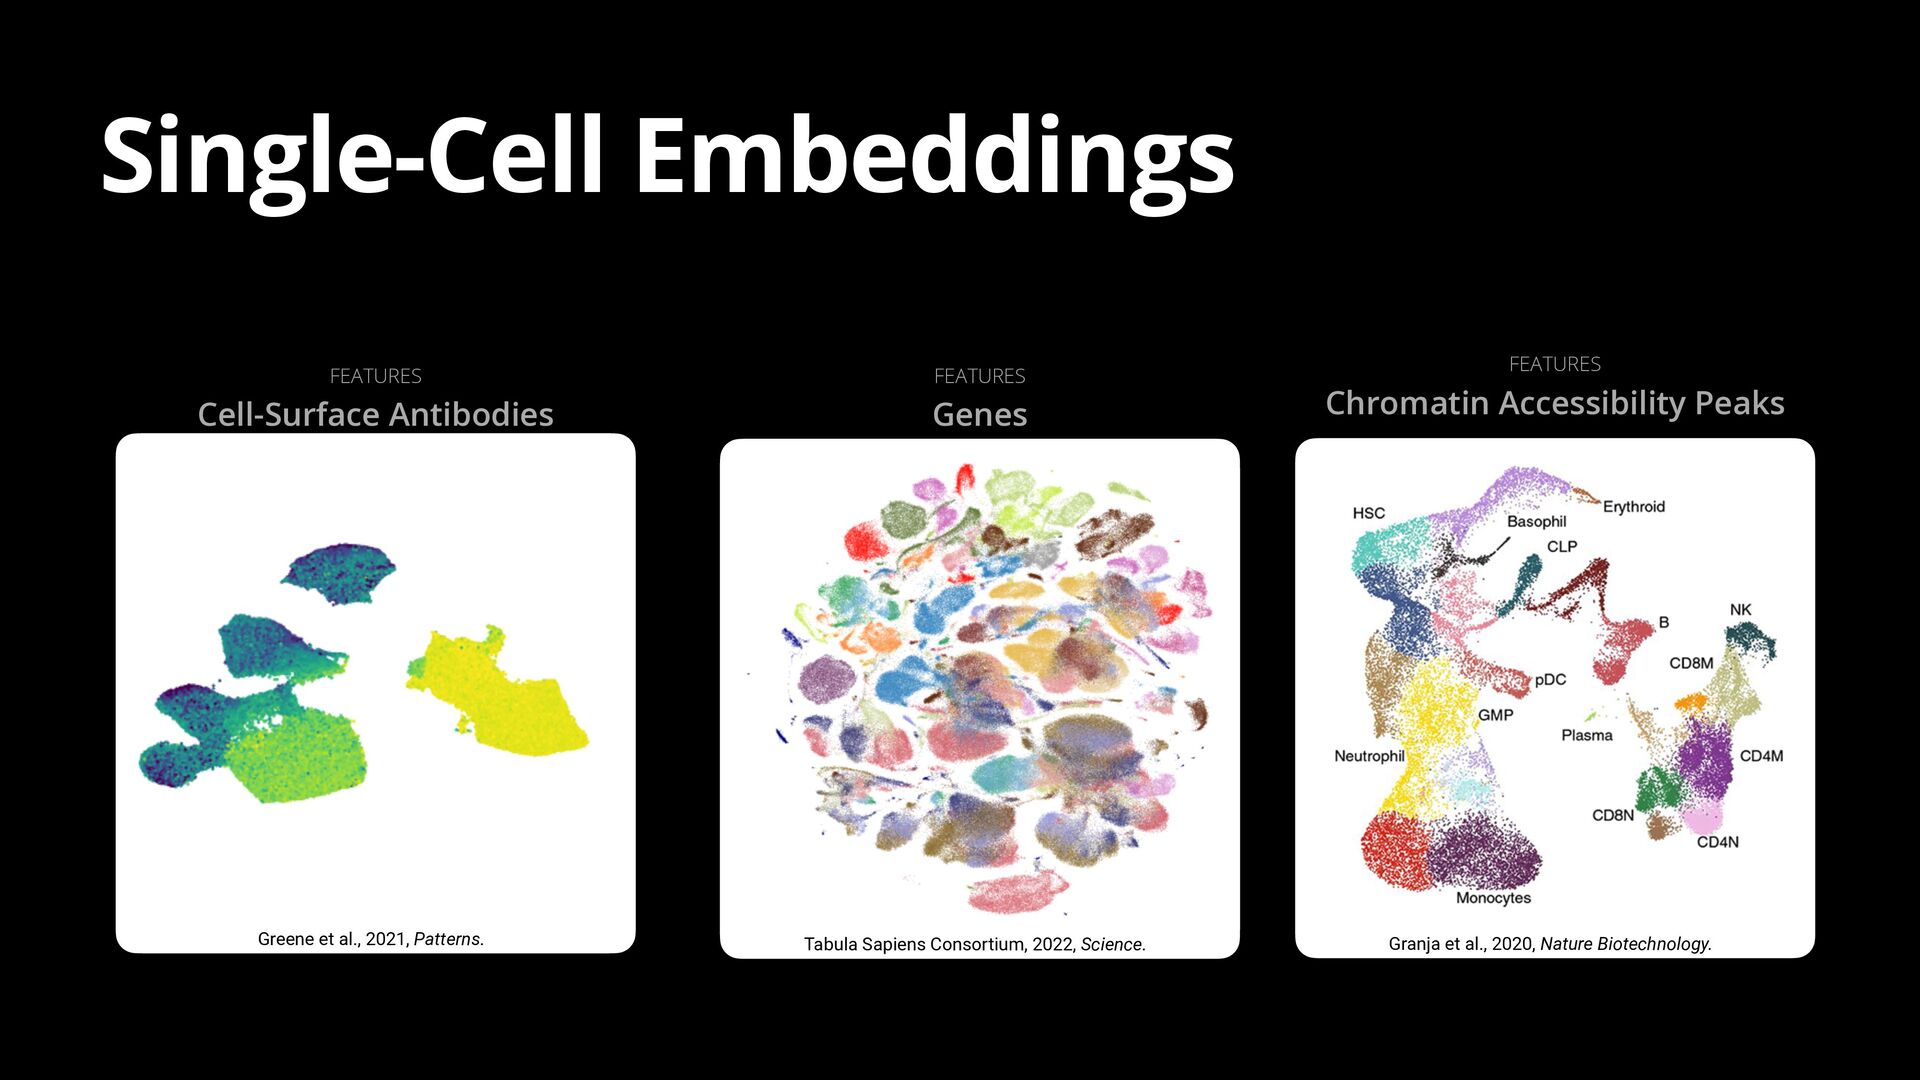
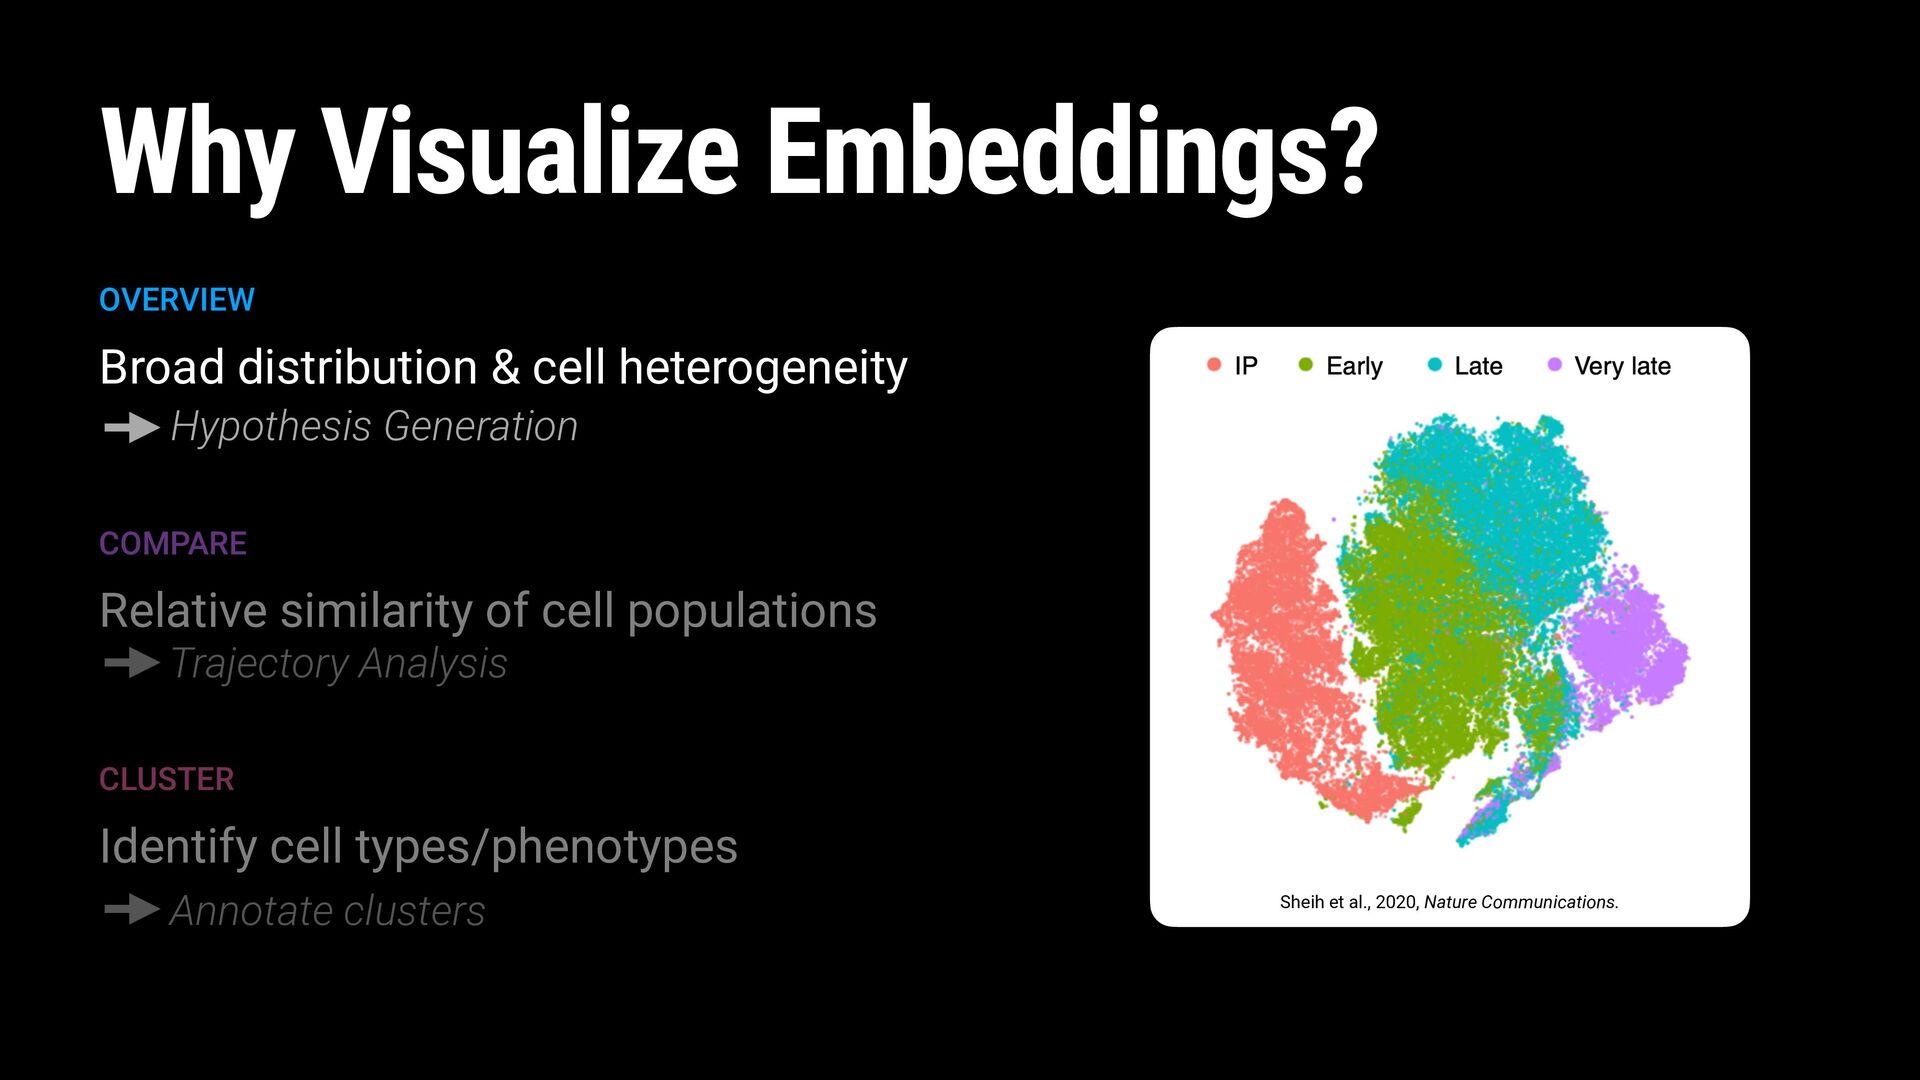
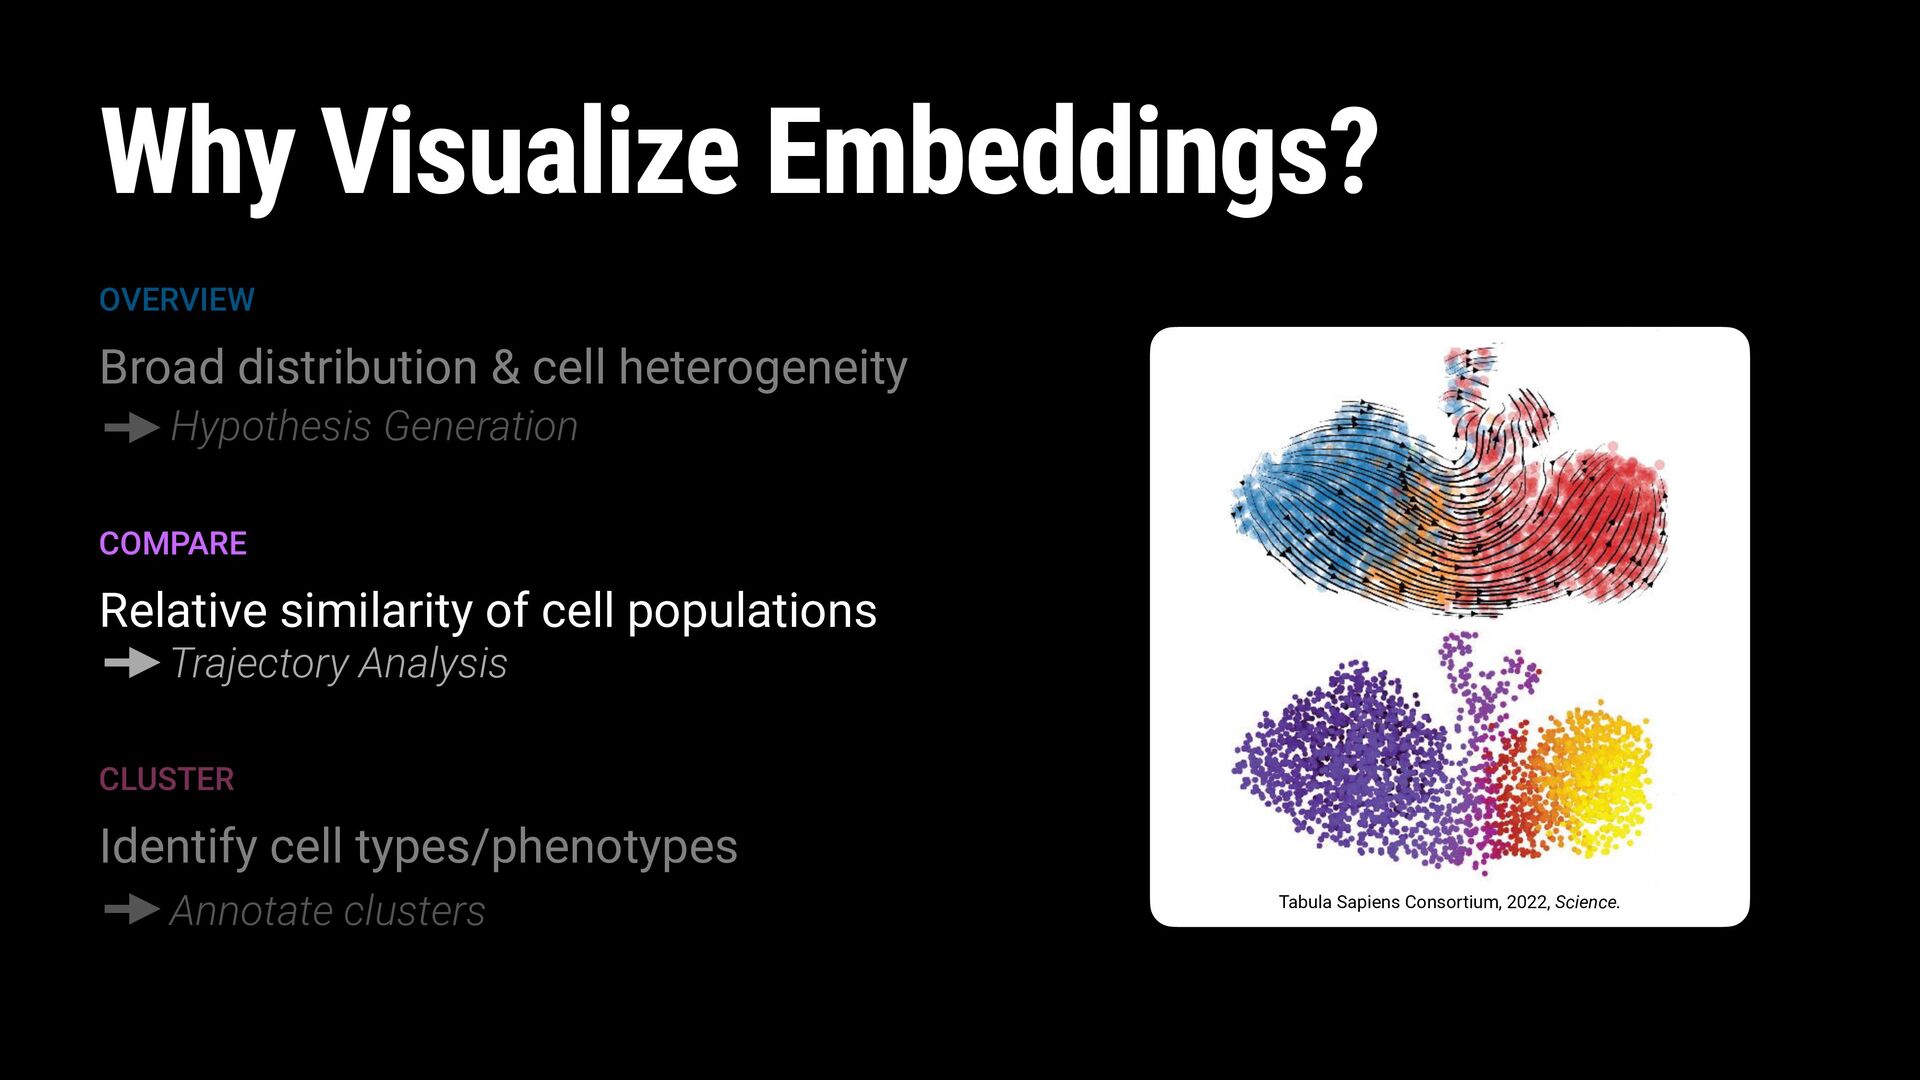
2020, Nature Biotechnology. FEATURES Chromatin Accessibility Peaks FEATURES Cell-Surface Antibodies FEATURES Genes Tabula Sapiens Consortium, 2022, Science.
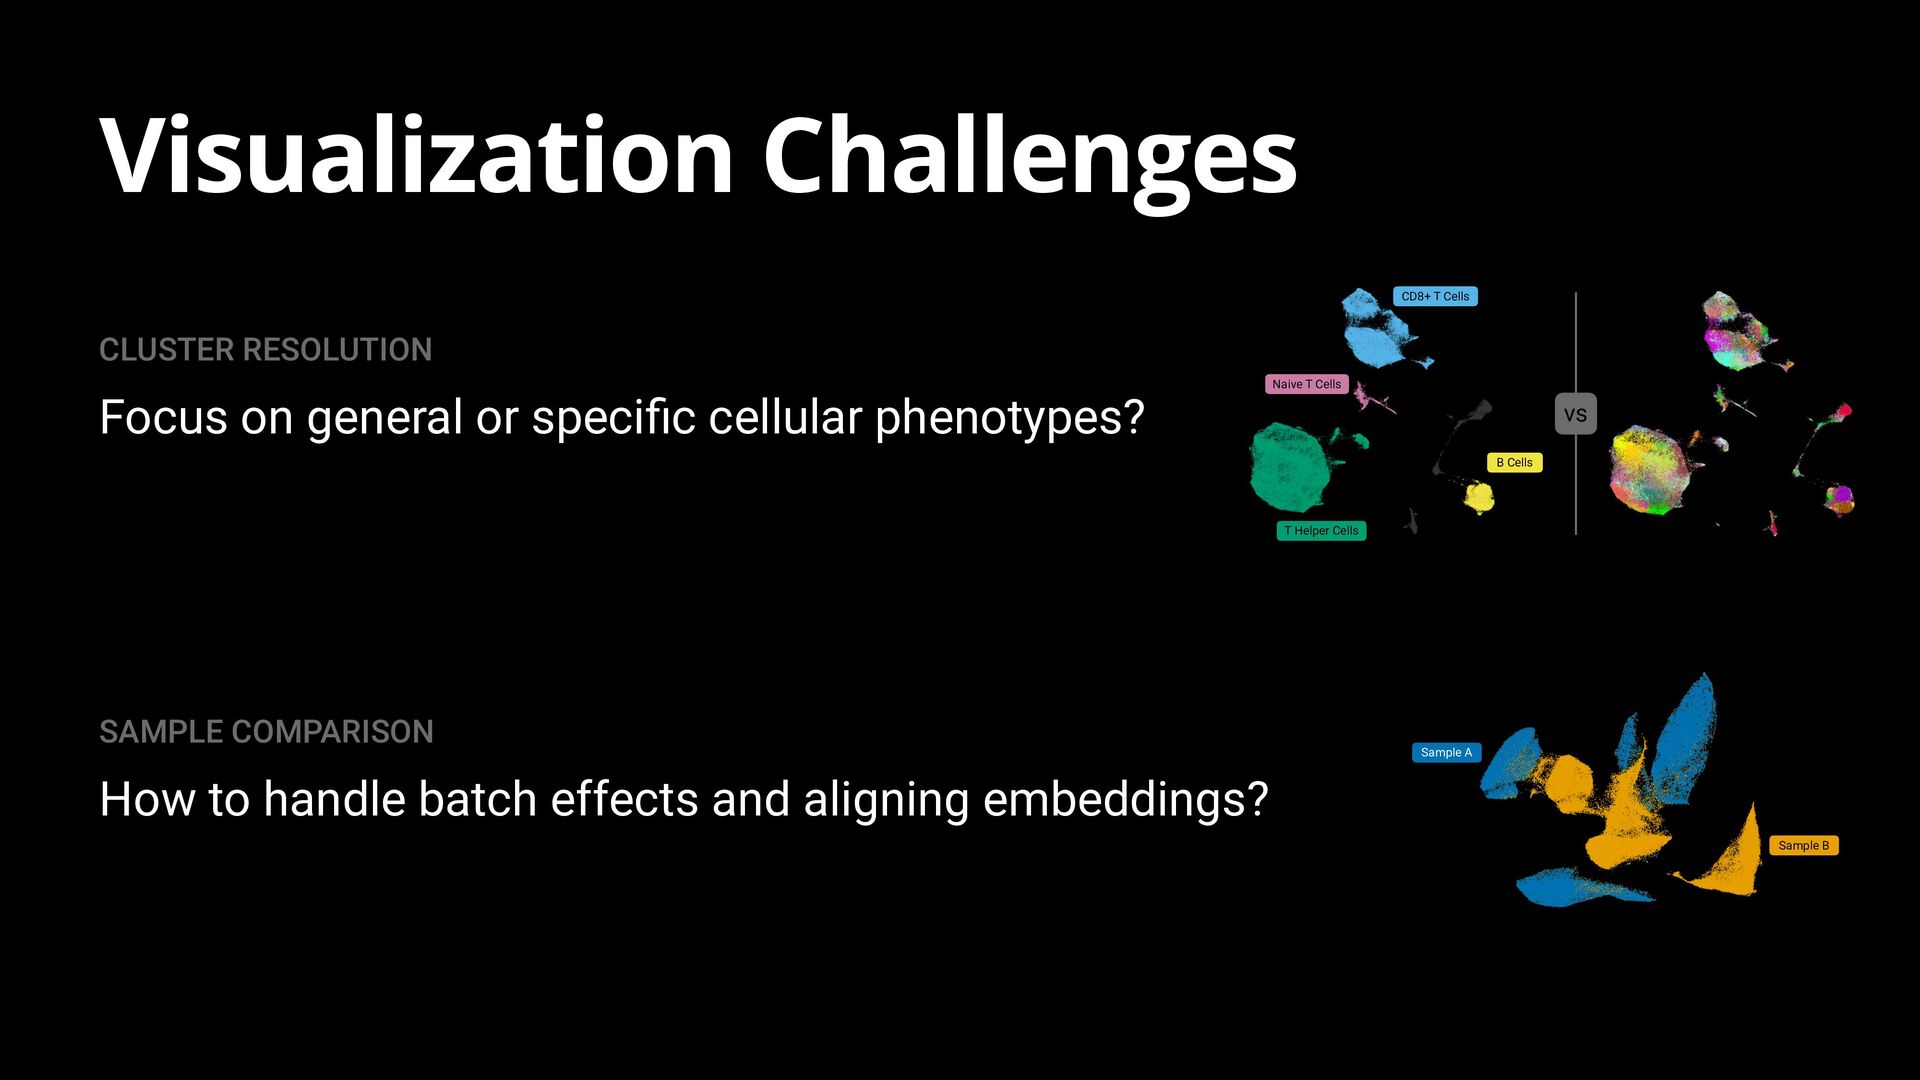
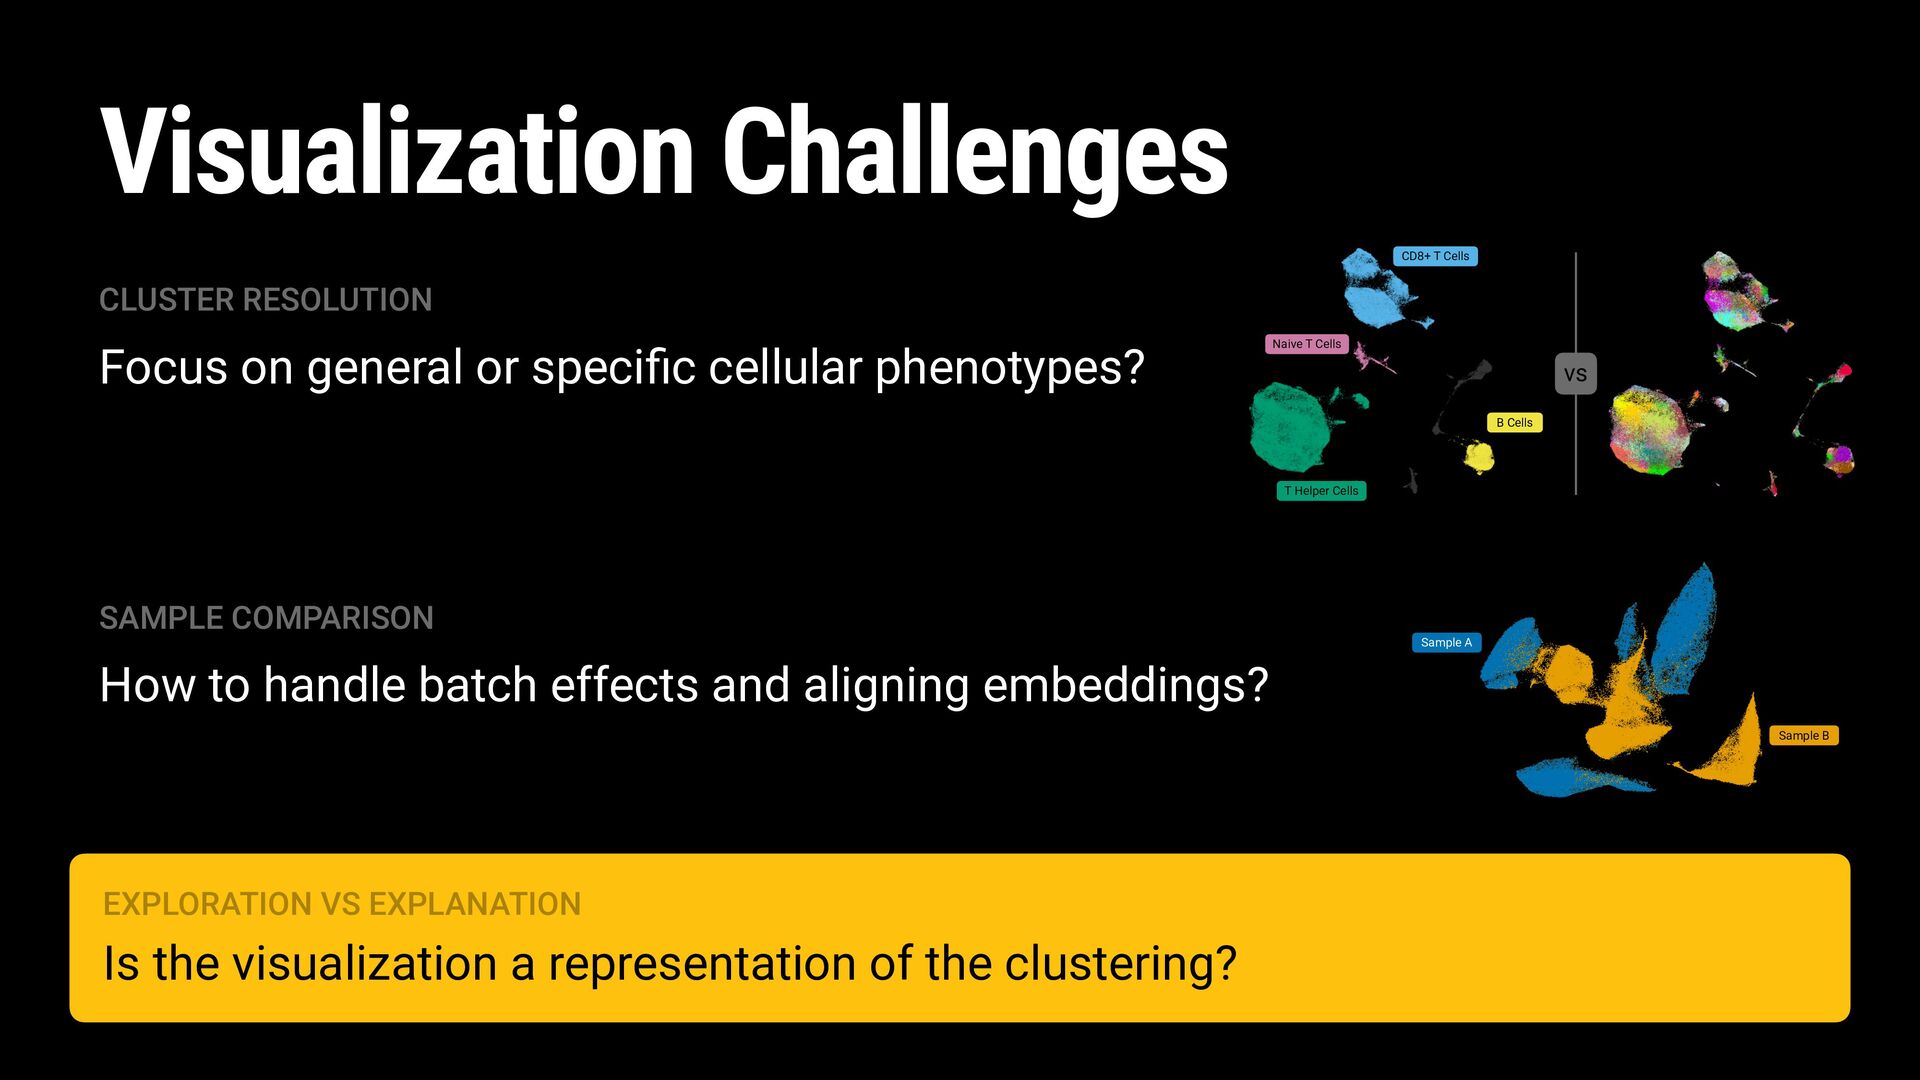
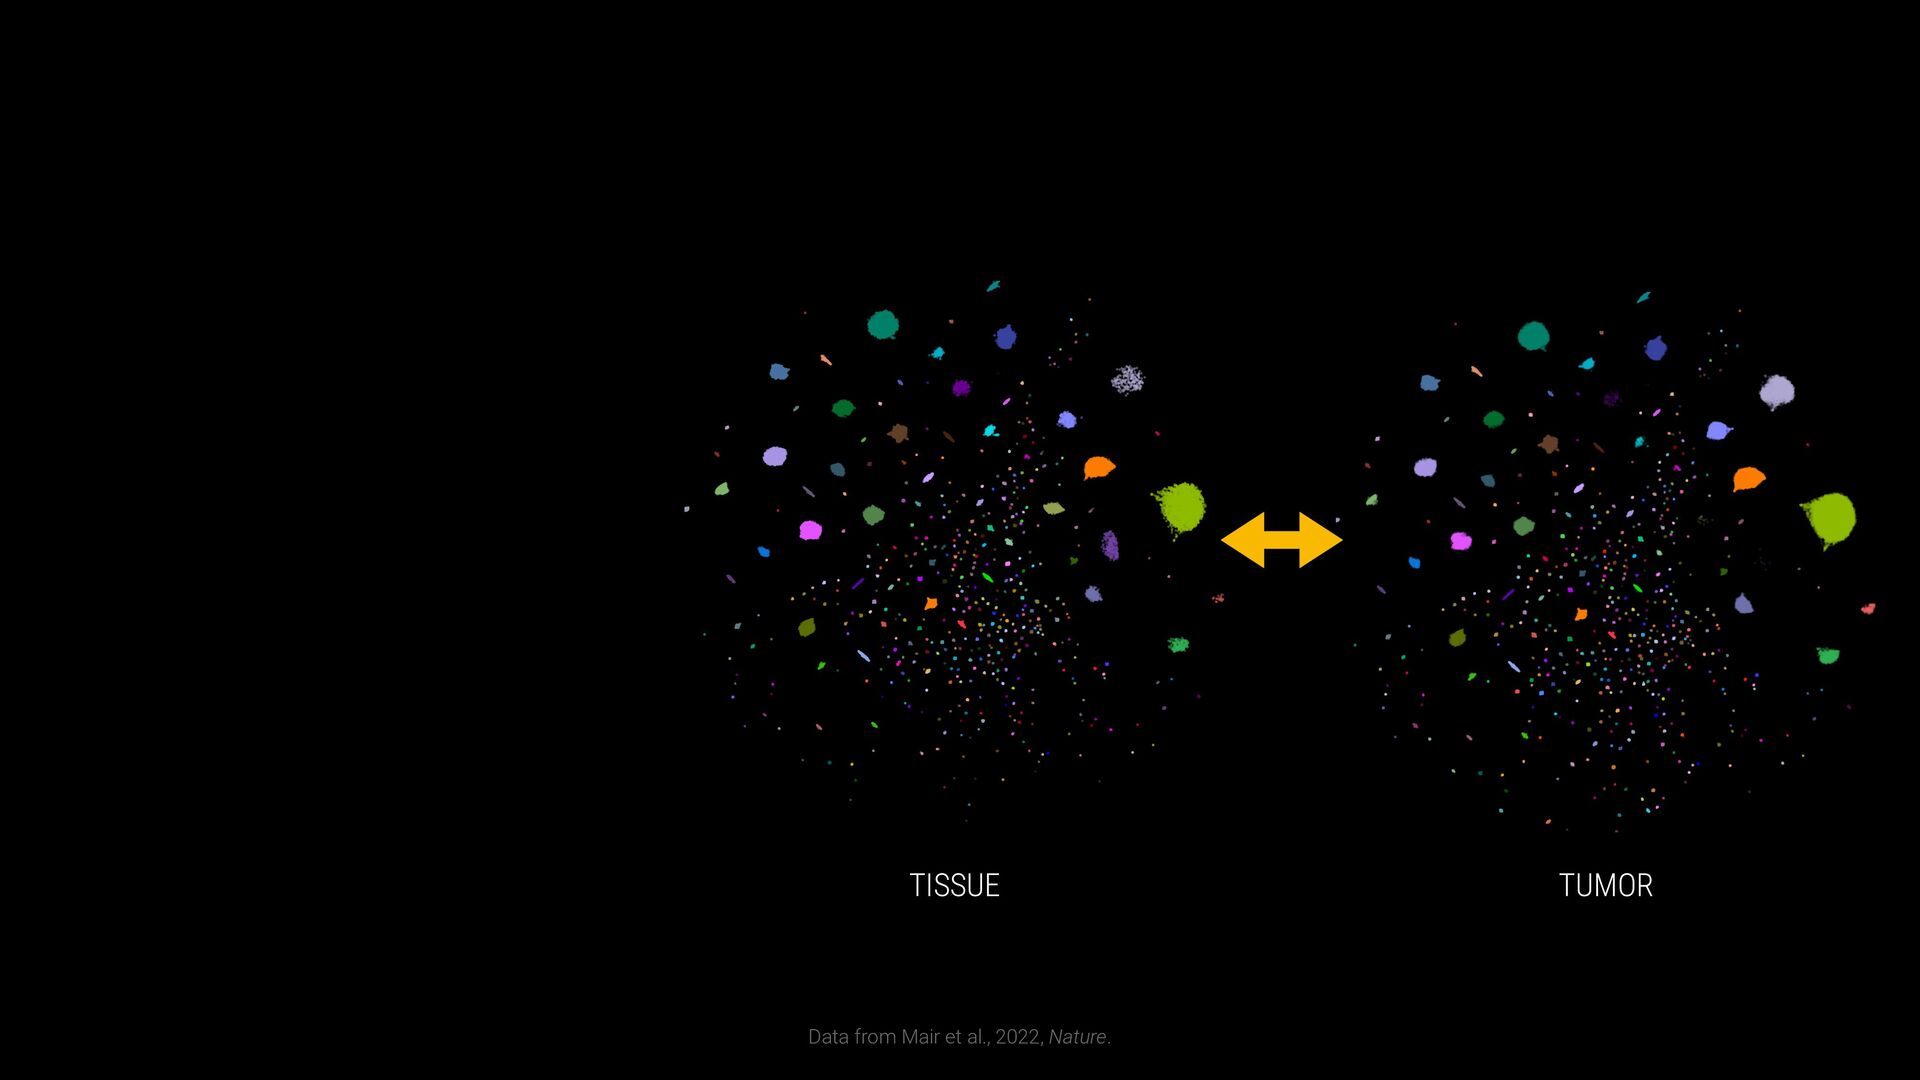
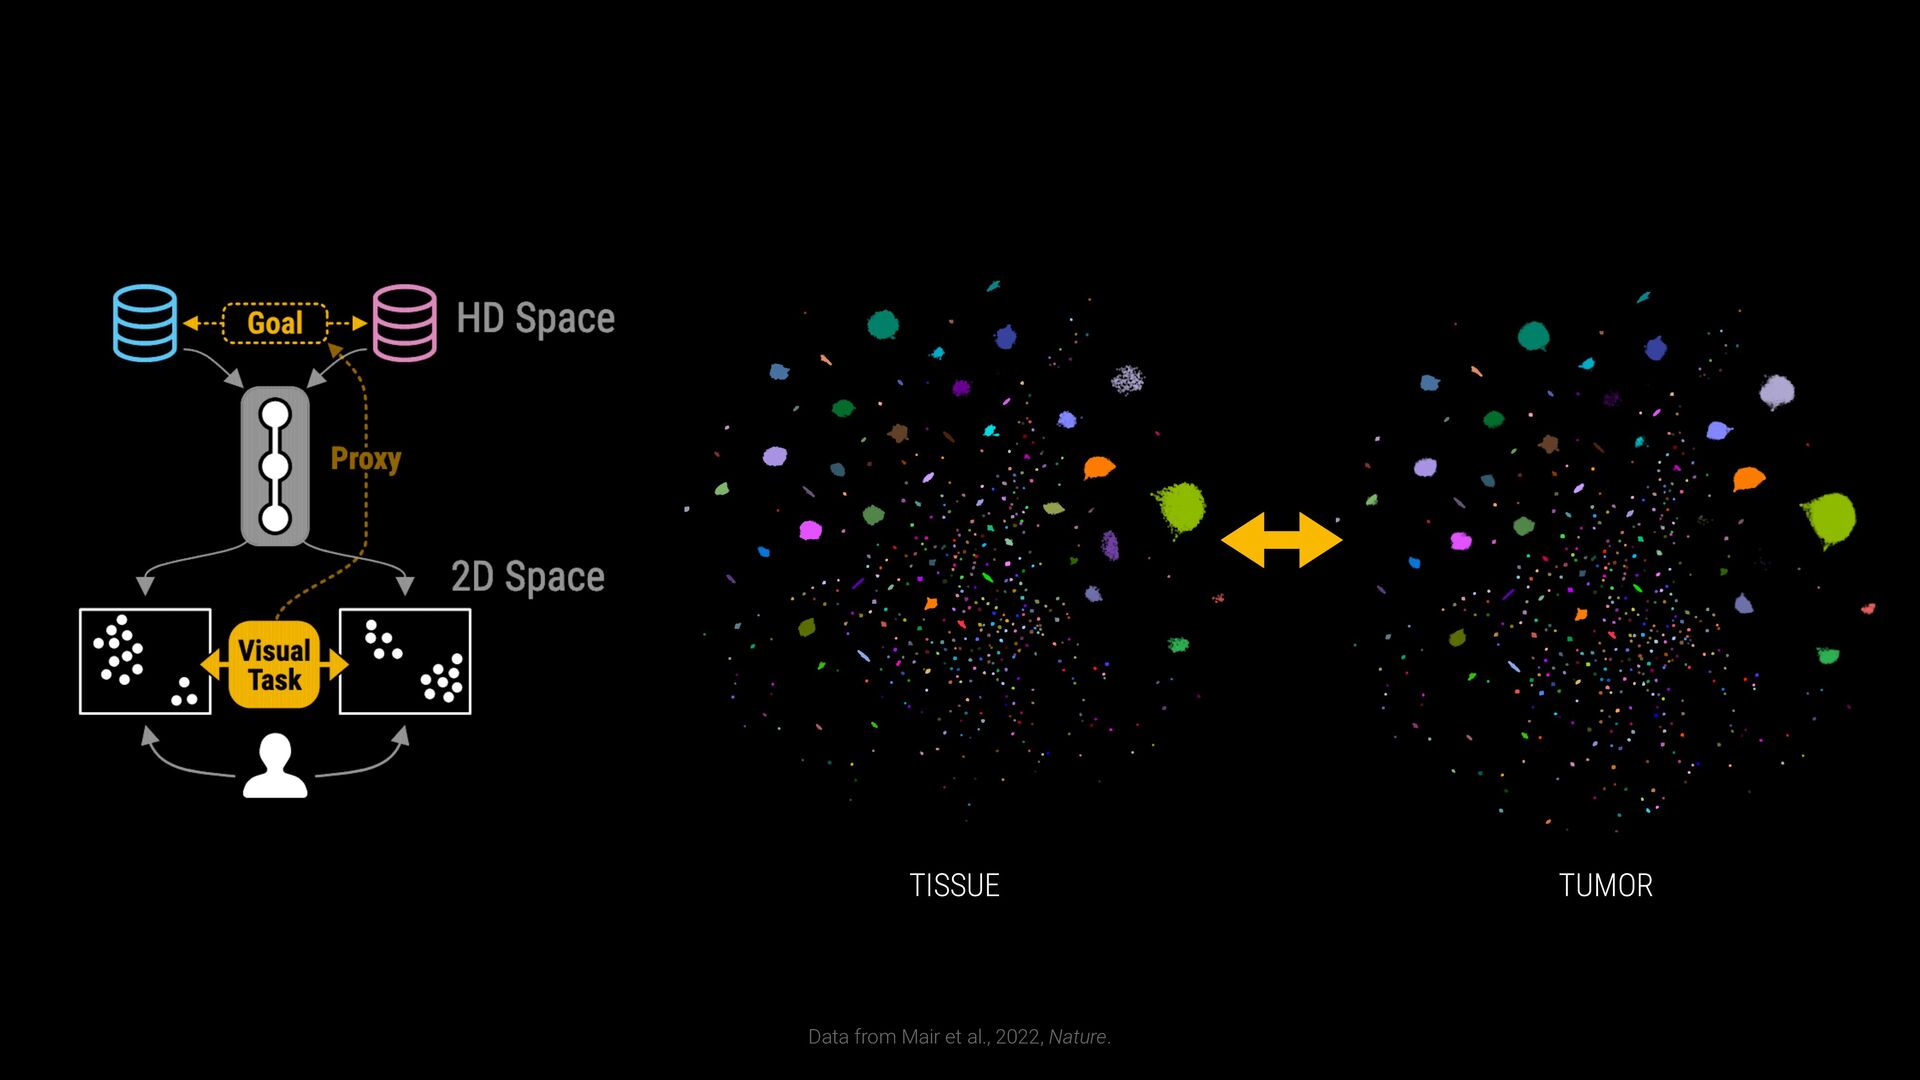
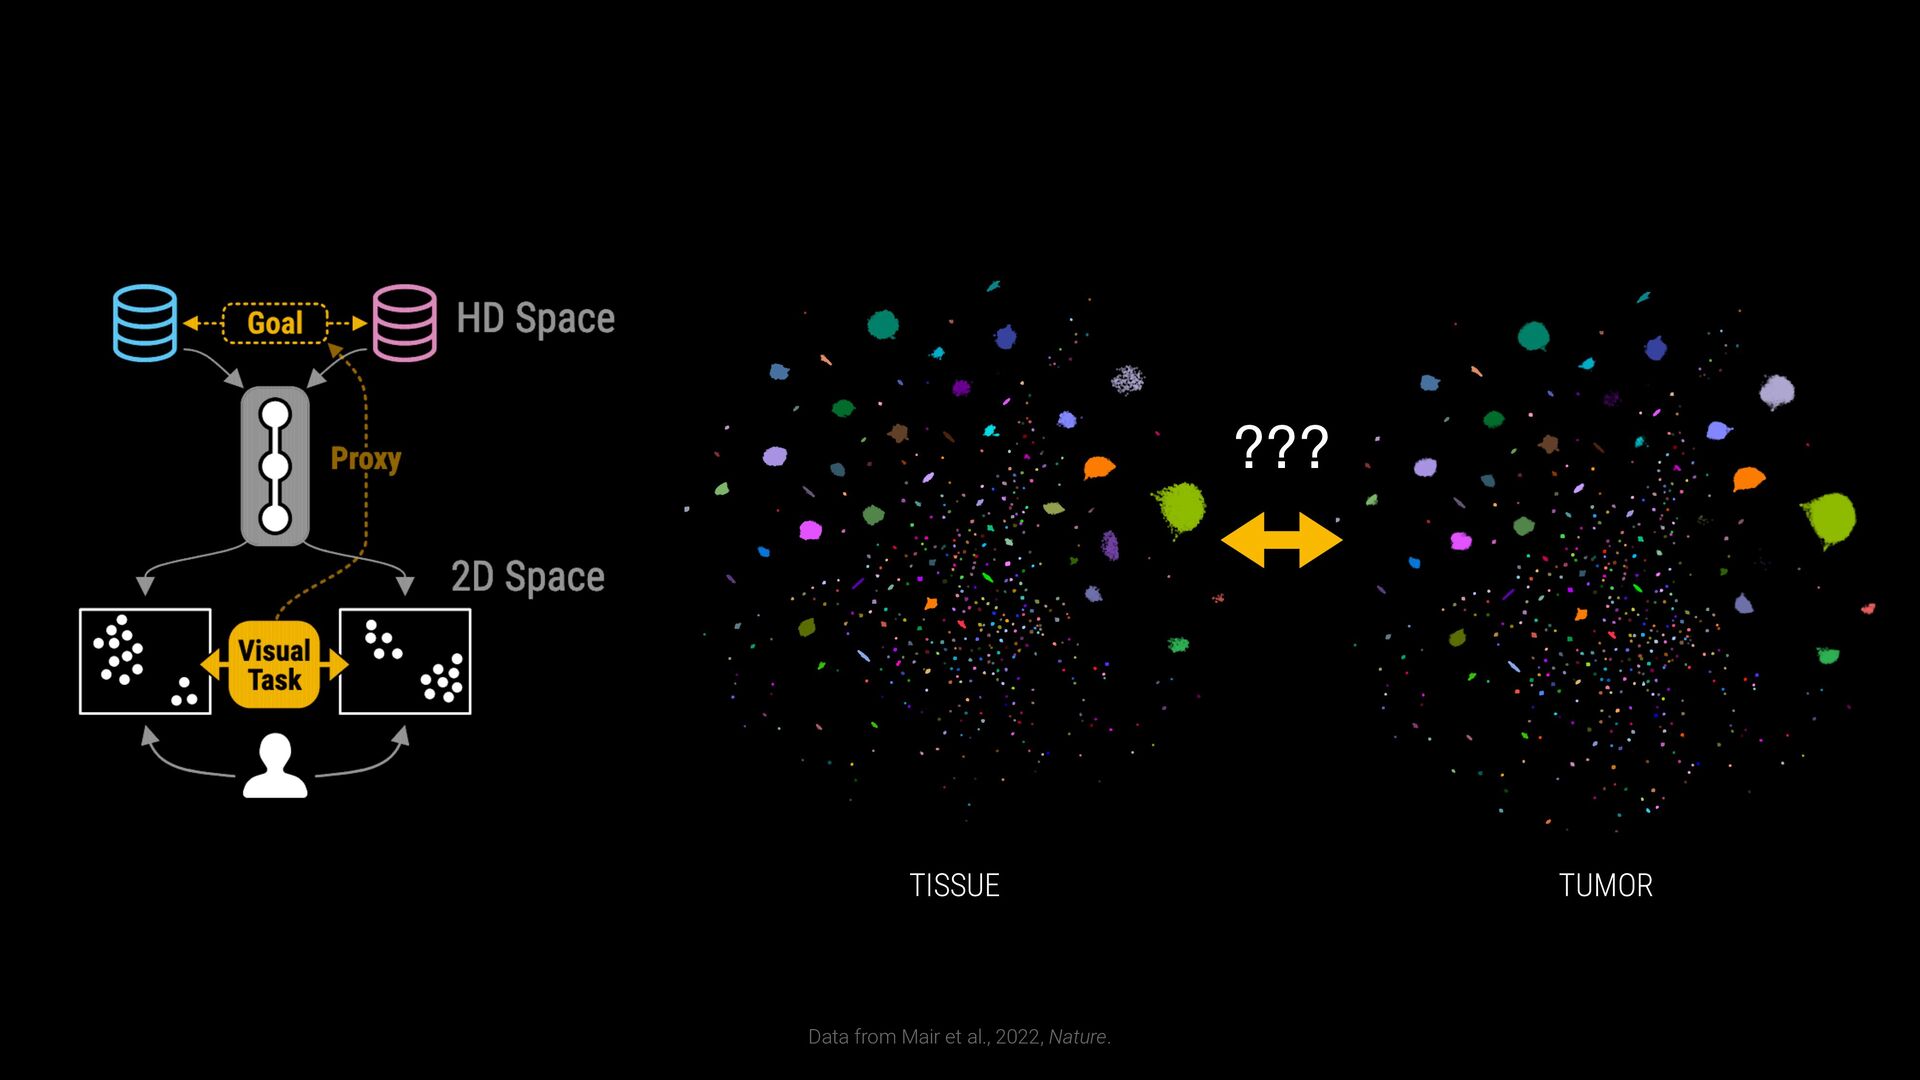
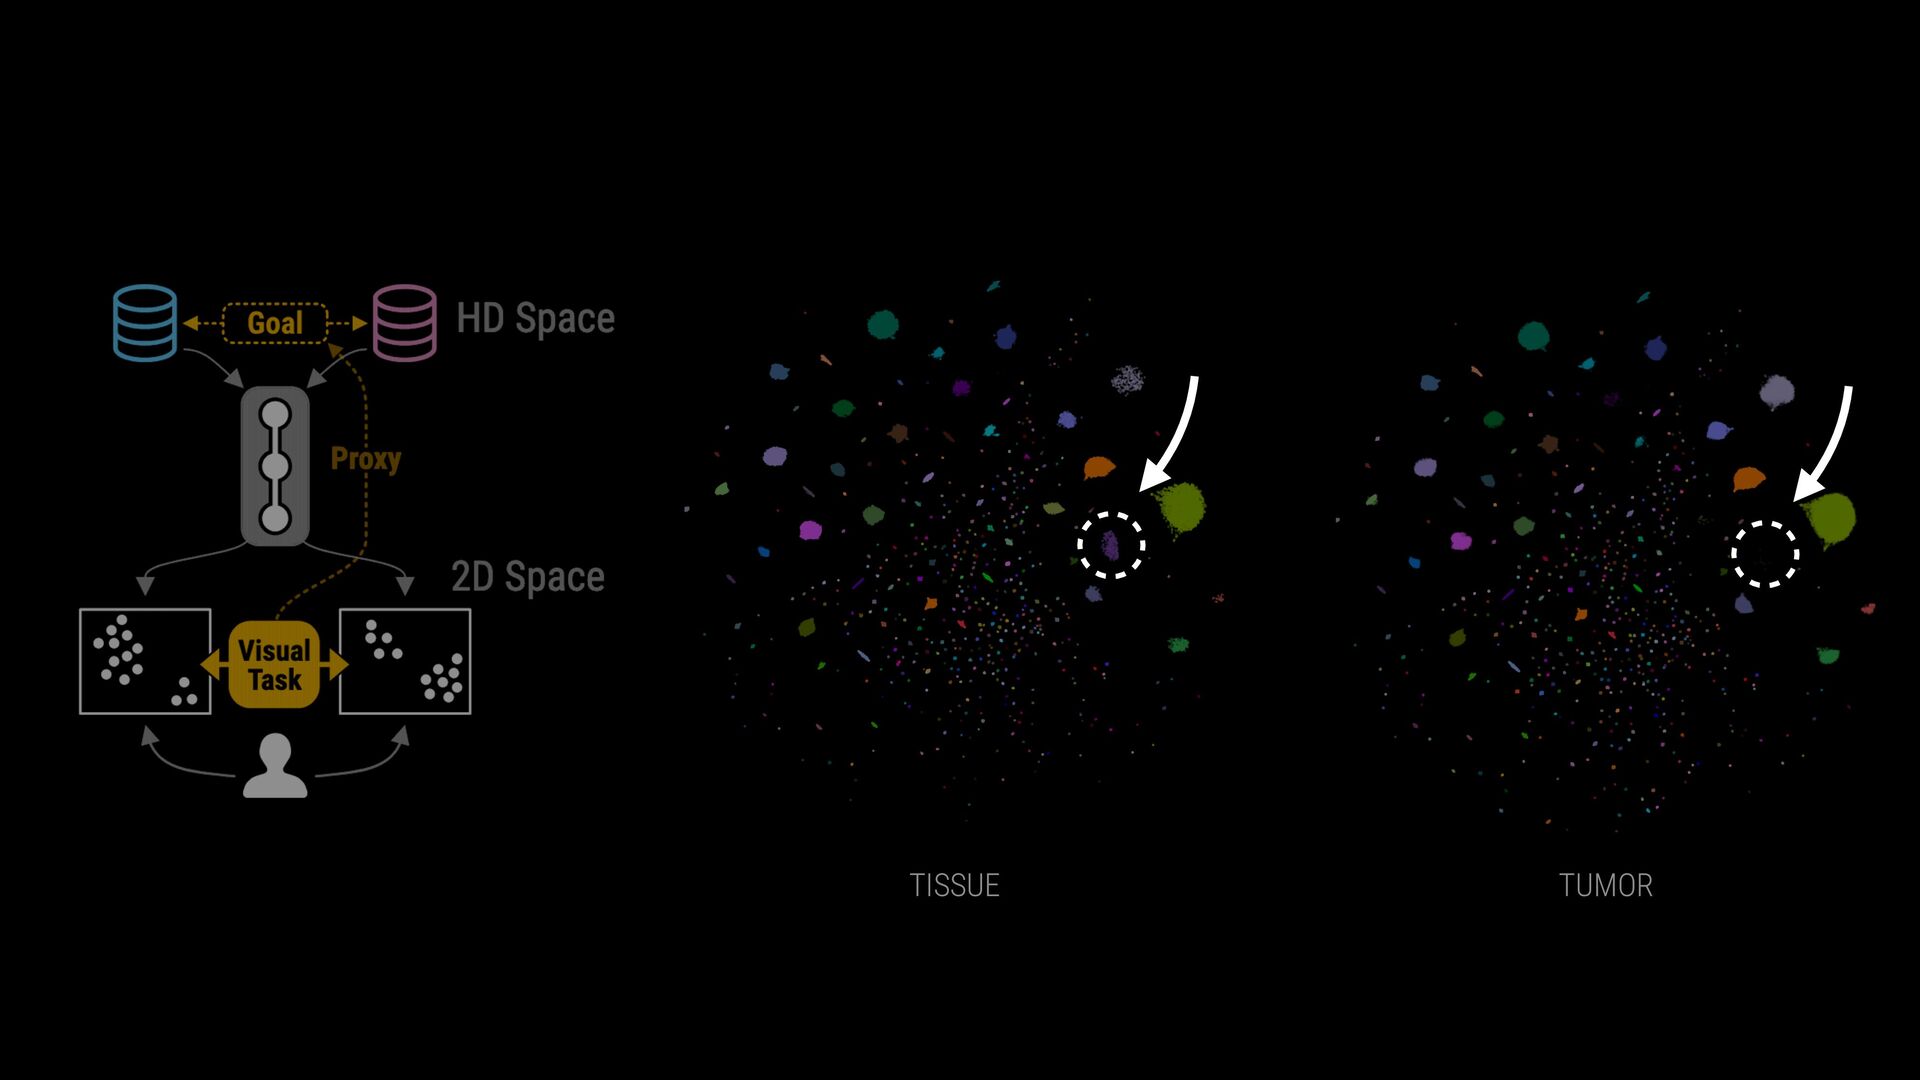
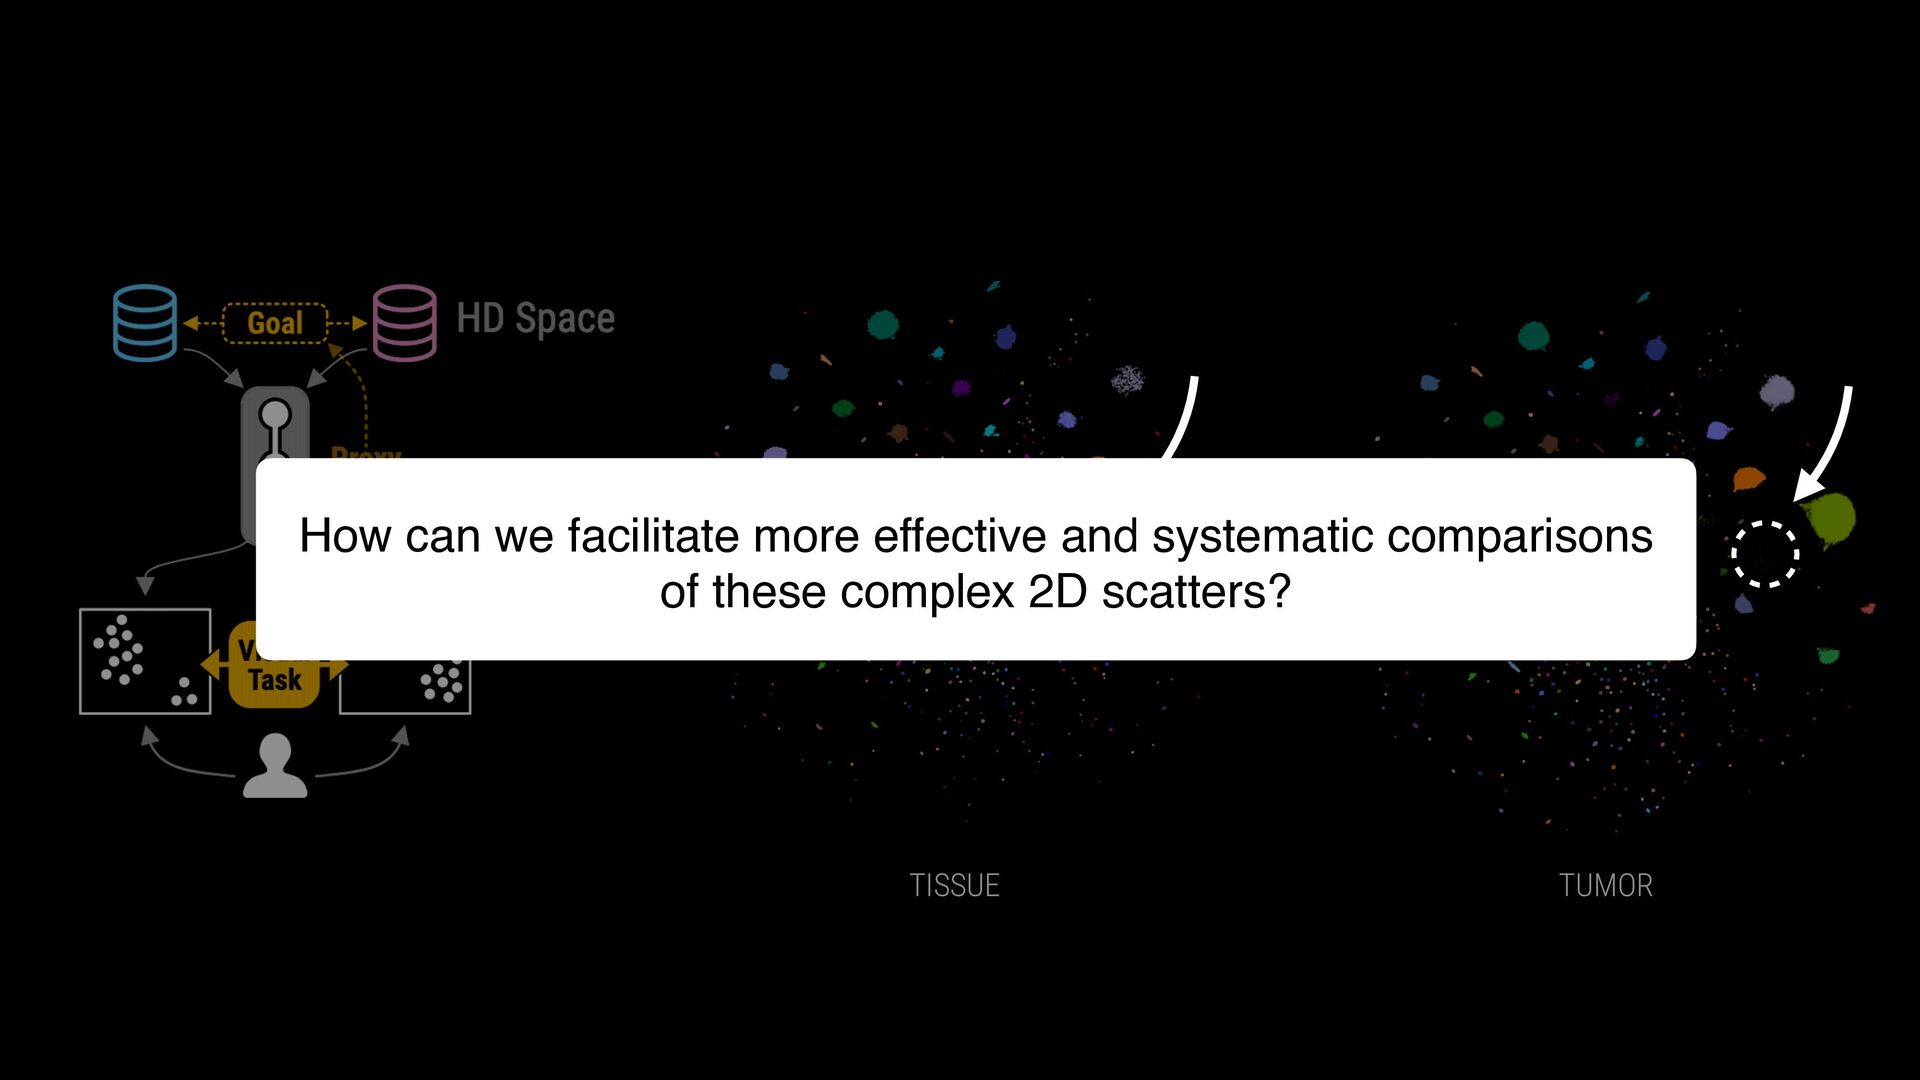
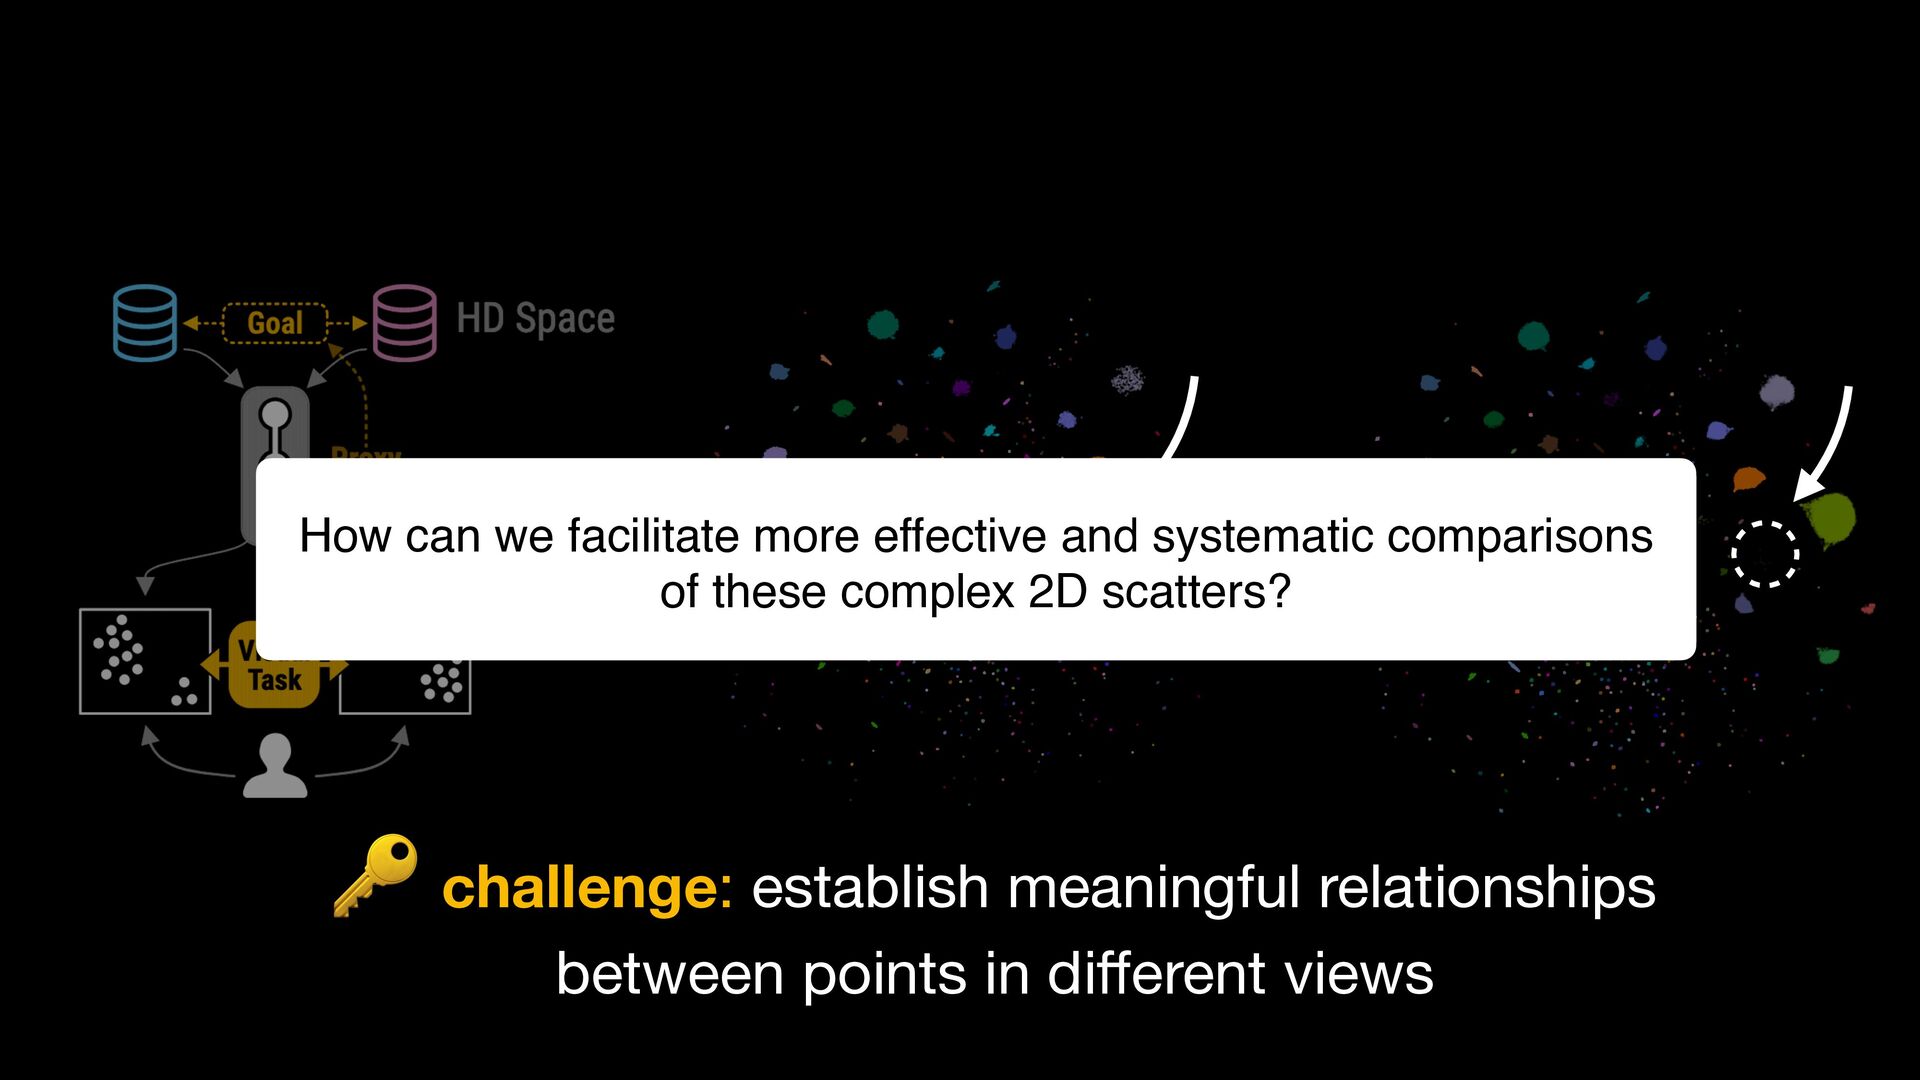
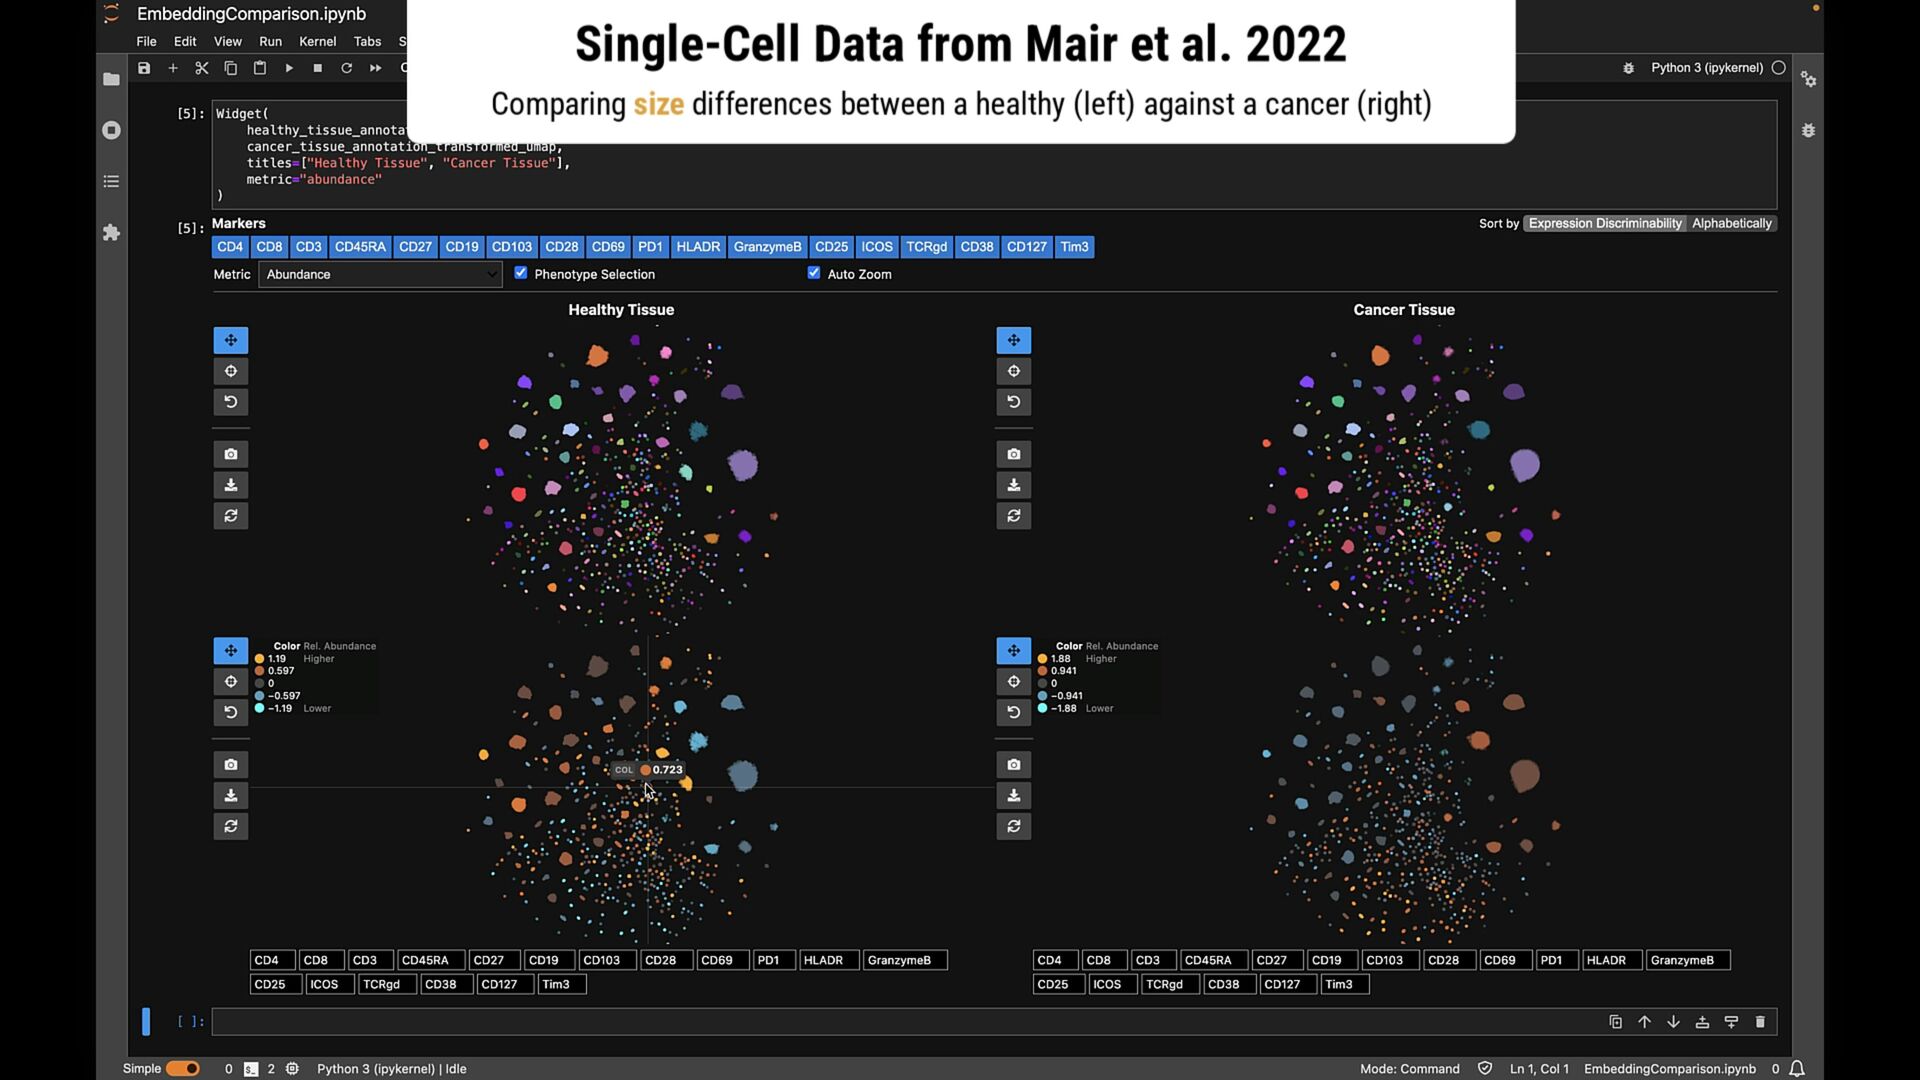
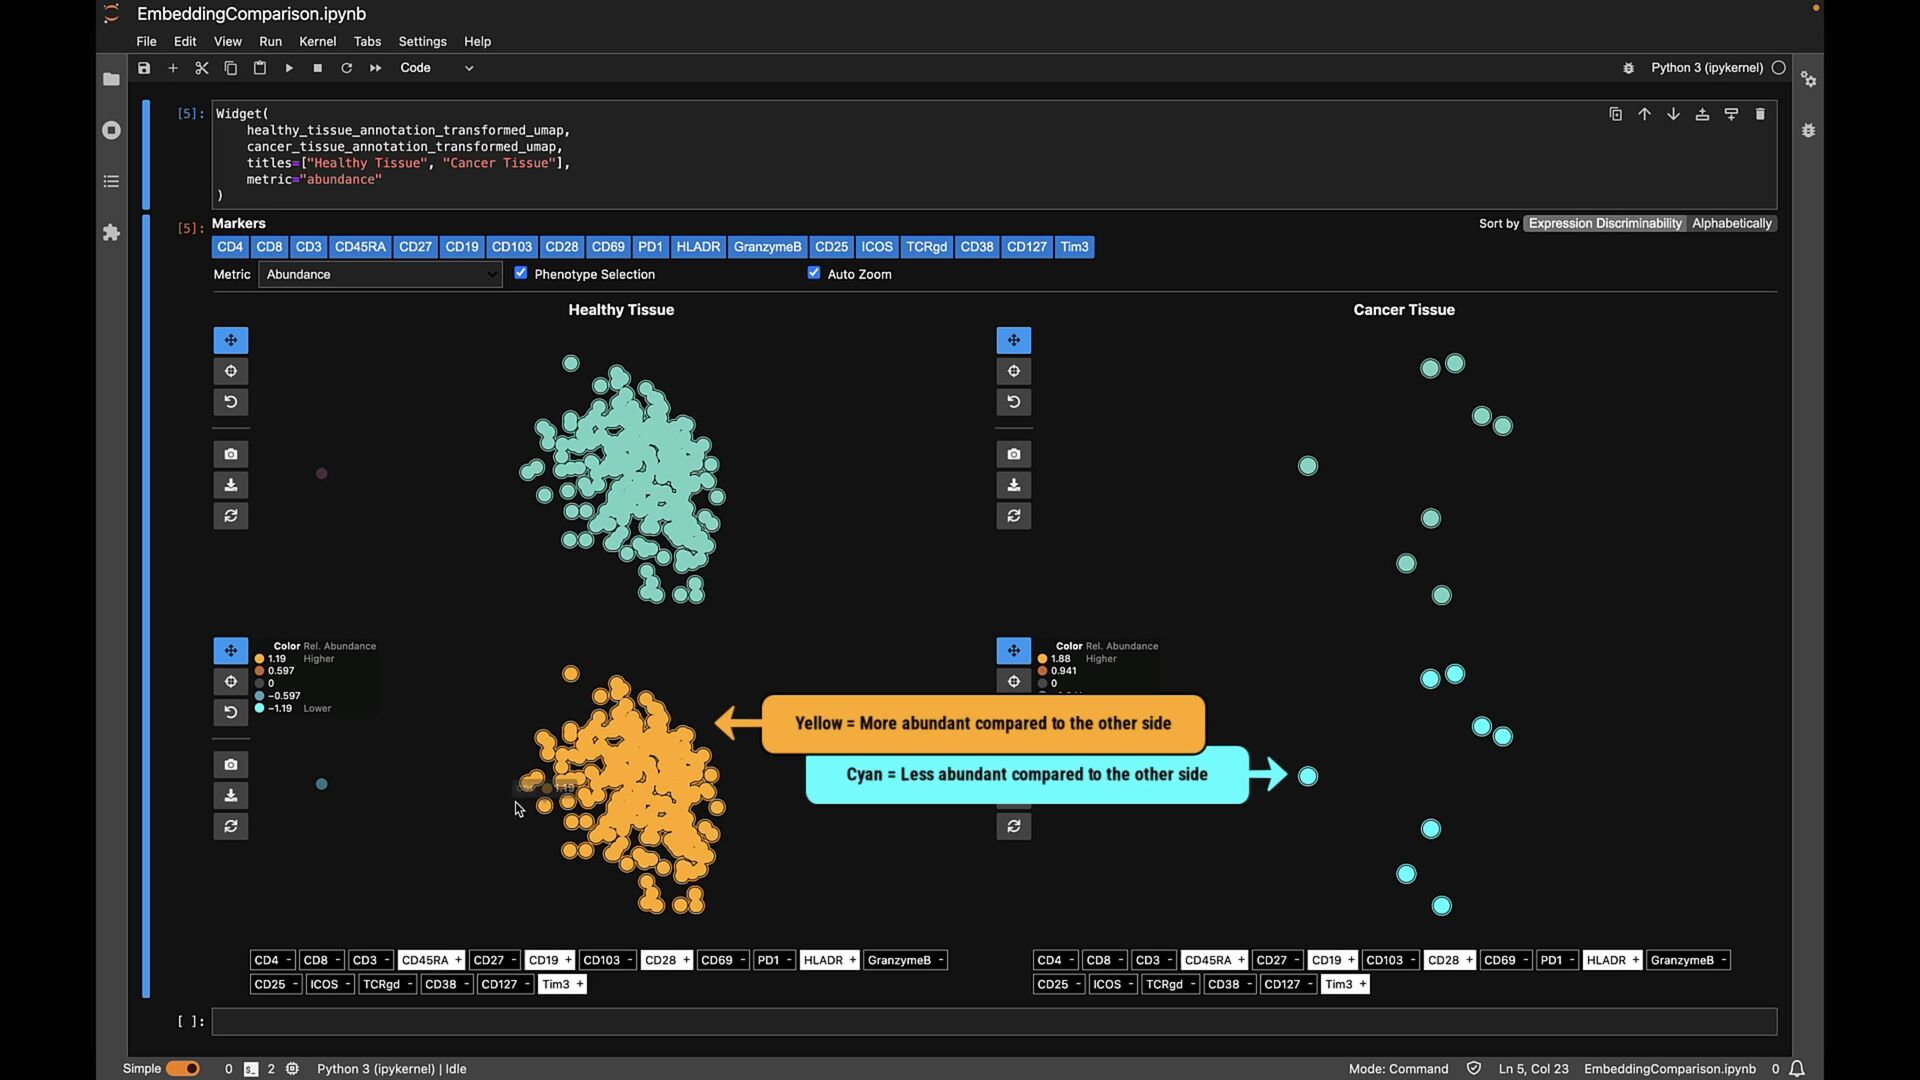
phenotypes? SAMPLE COMPARISON How to handle batch effects and aligning embeddings? vs CD8+ T Cells T Helper Cells B Cells Naive T Cells Sample B Sample A
phenotypes? SAMPLE COMPARISON How to handle batch effects and aligning embeddings? Sample B Sample A EXPLORATION VS EXPLANATION Is the visualization a representation of the clustering? vs CD8+ T Cells T Helper Cells B Cells Naive T Cells
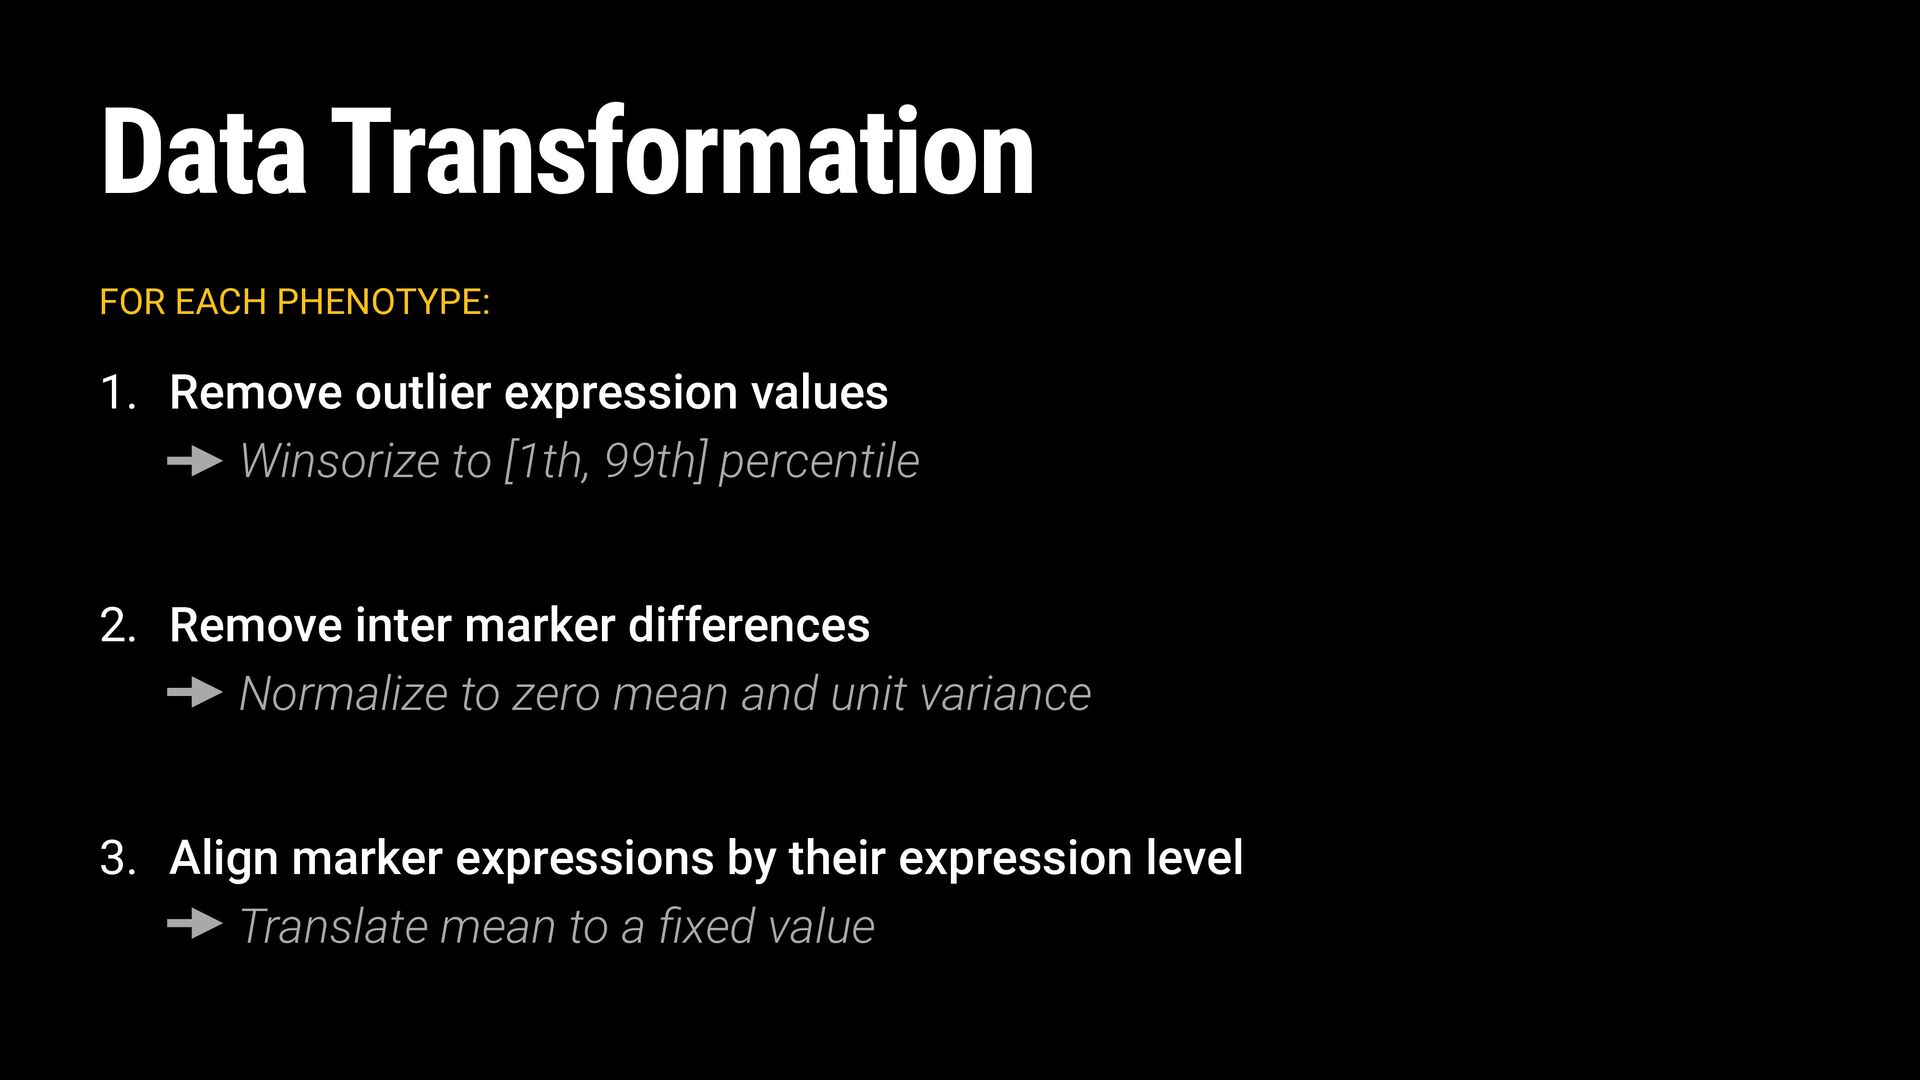
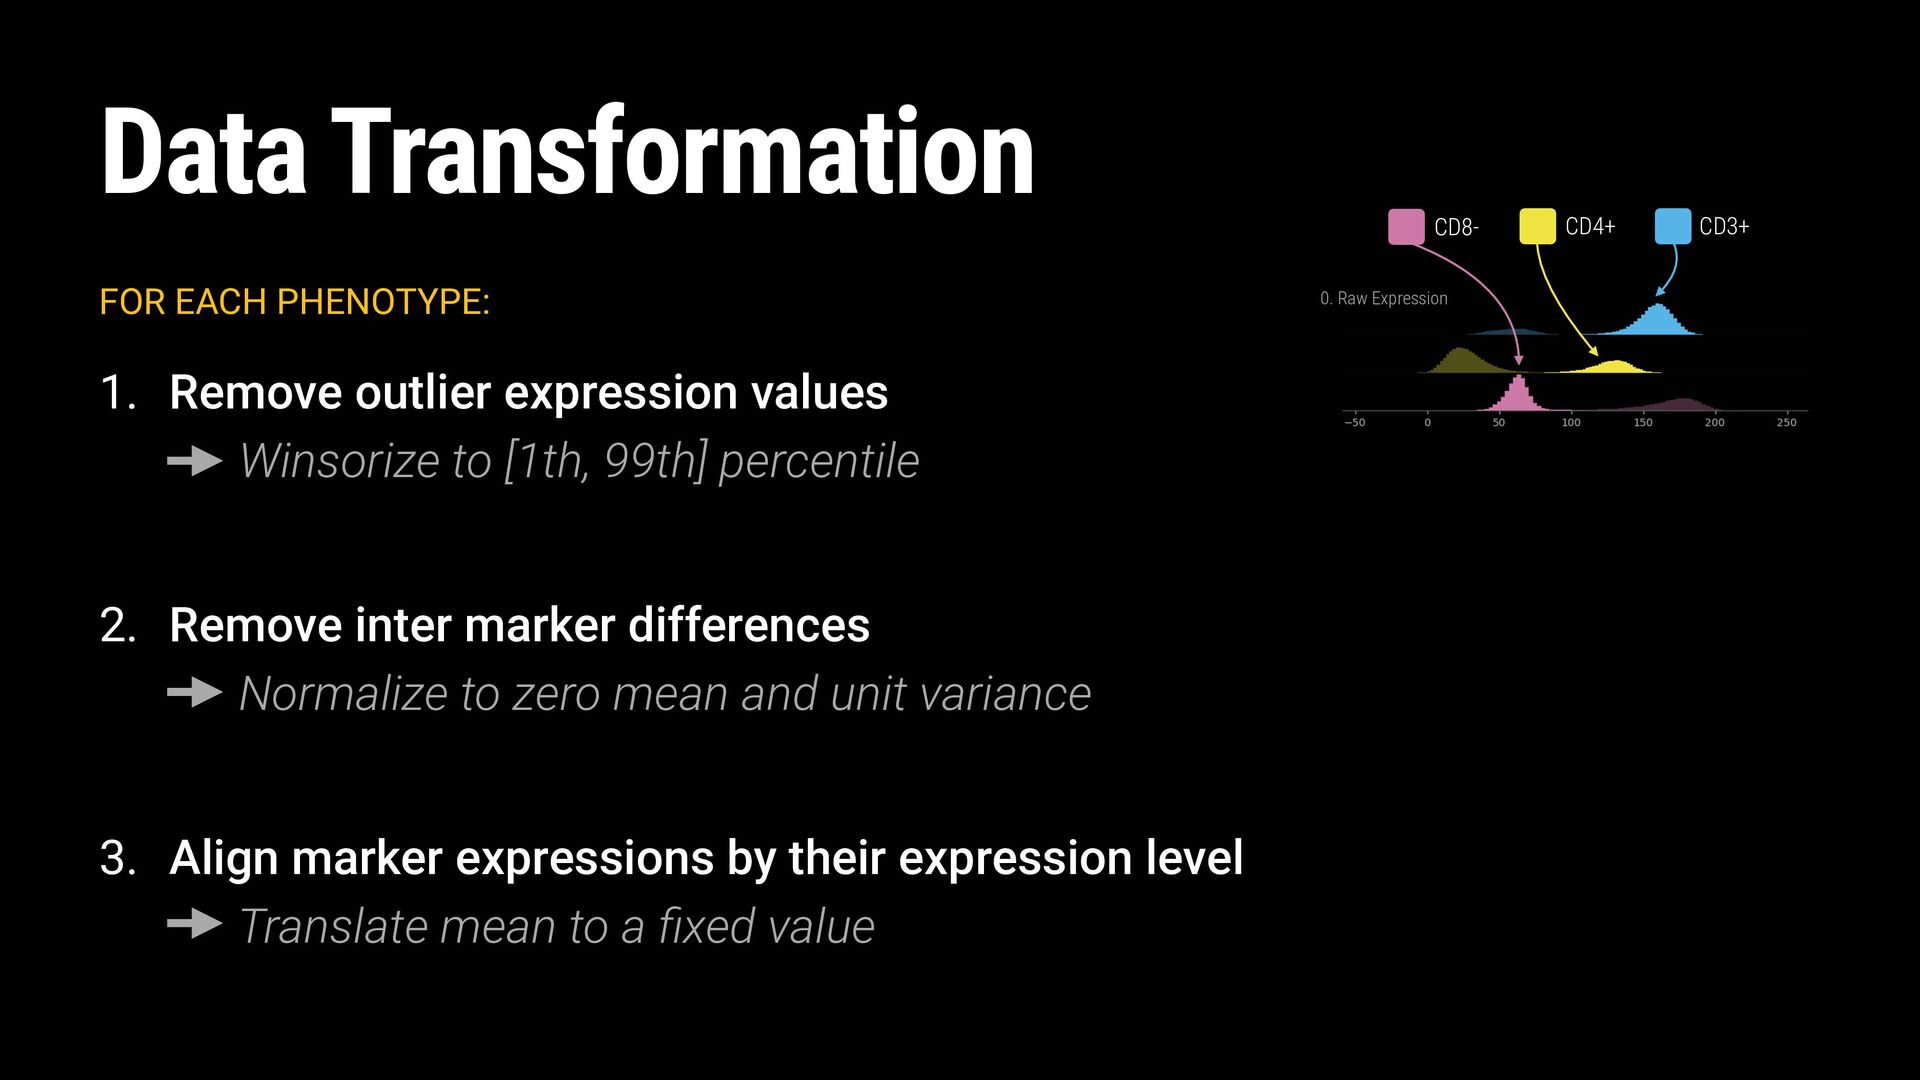
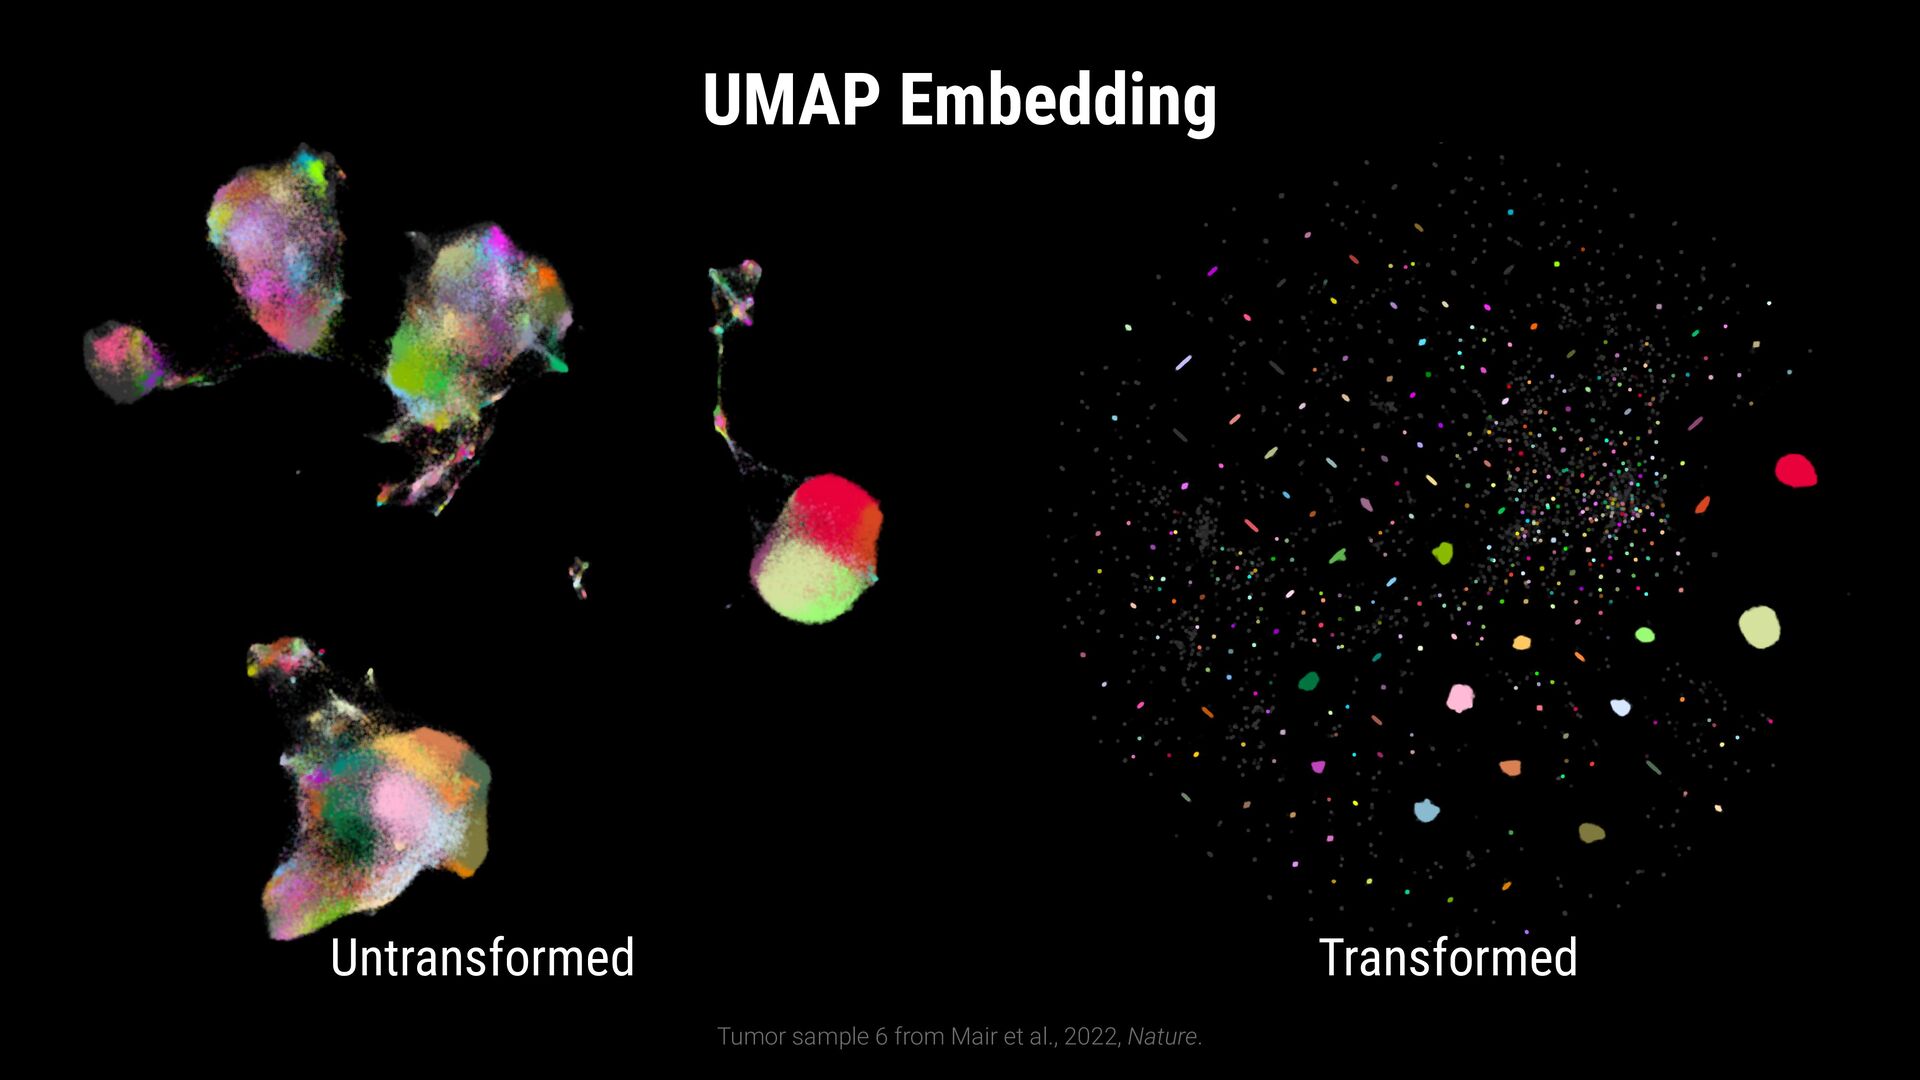
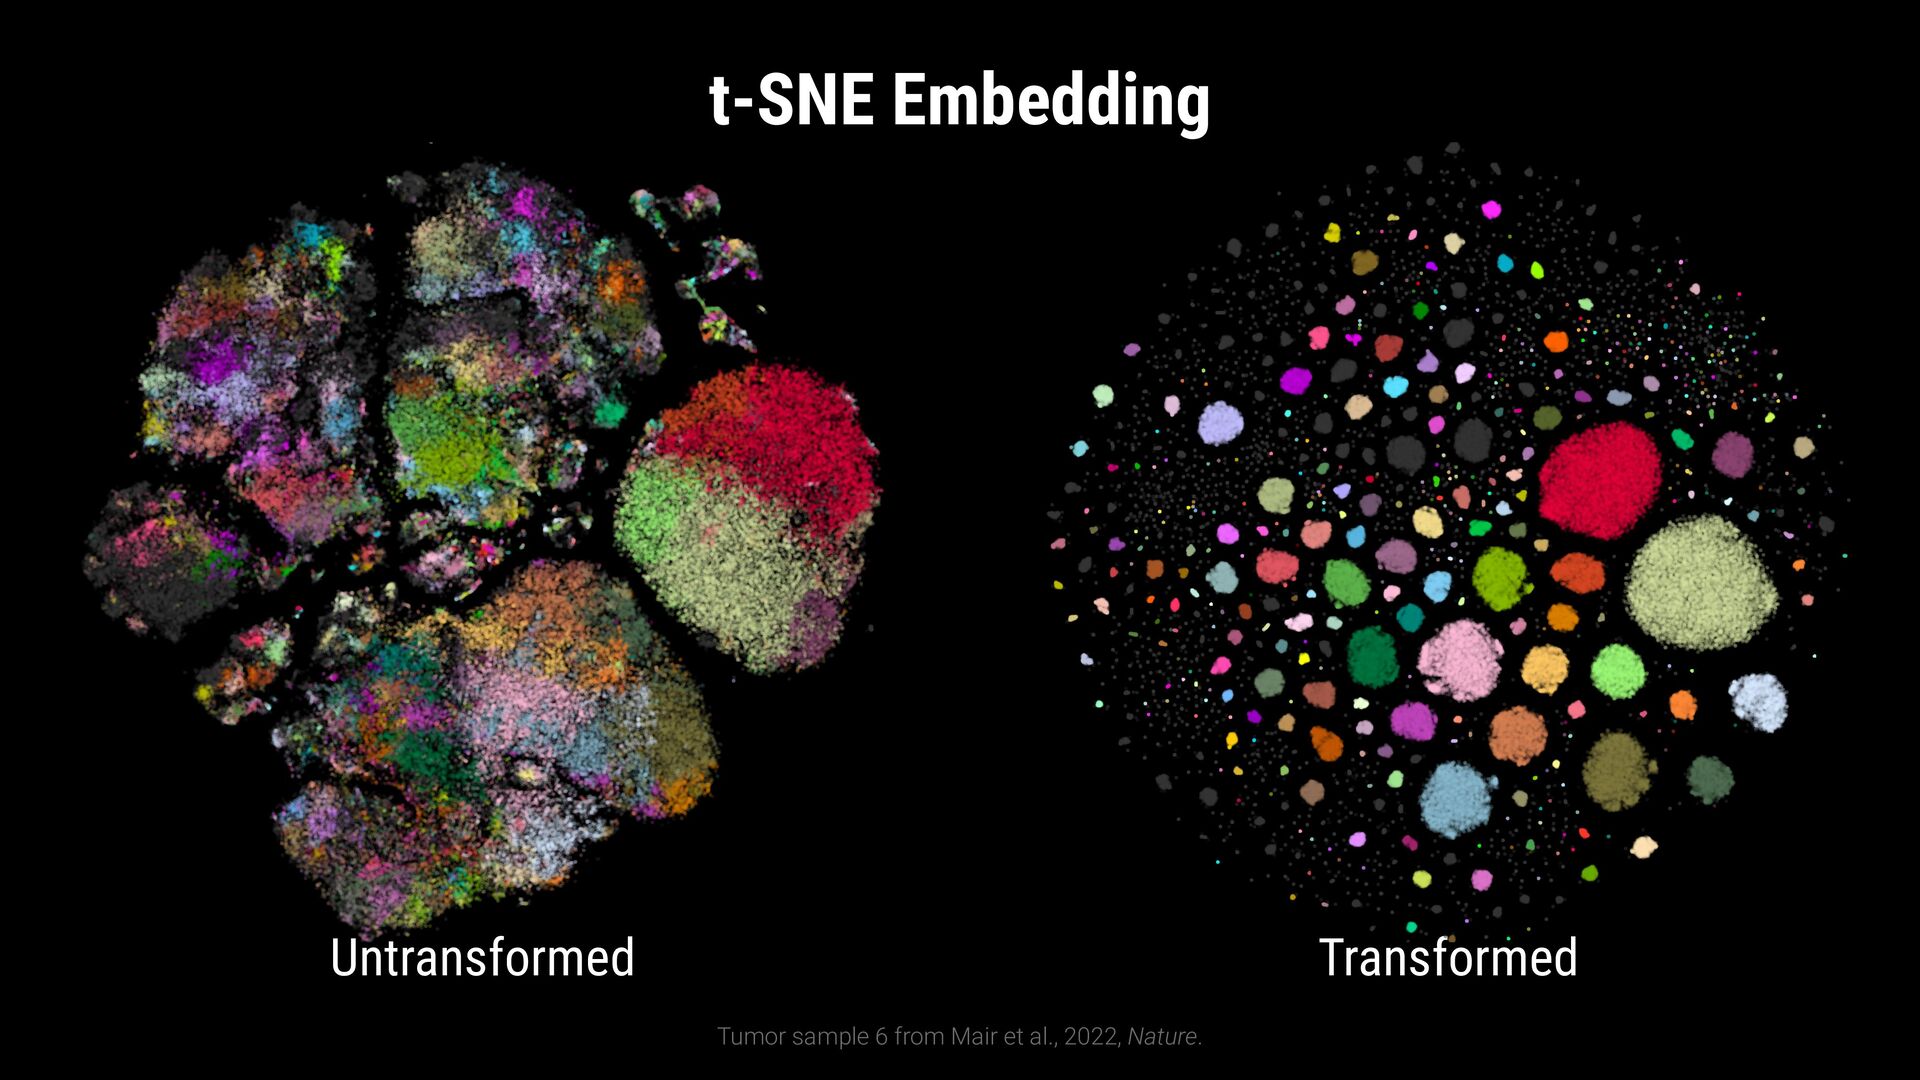
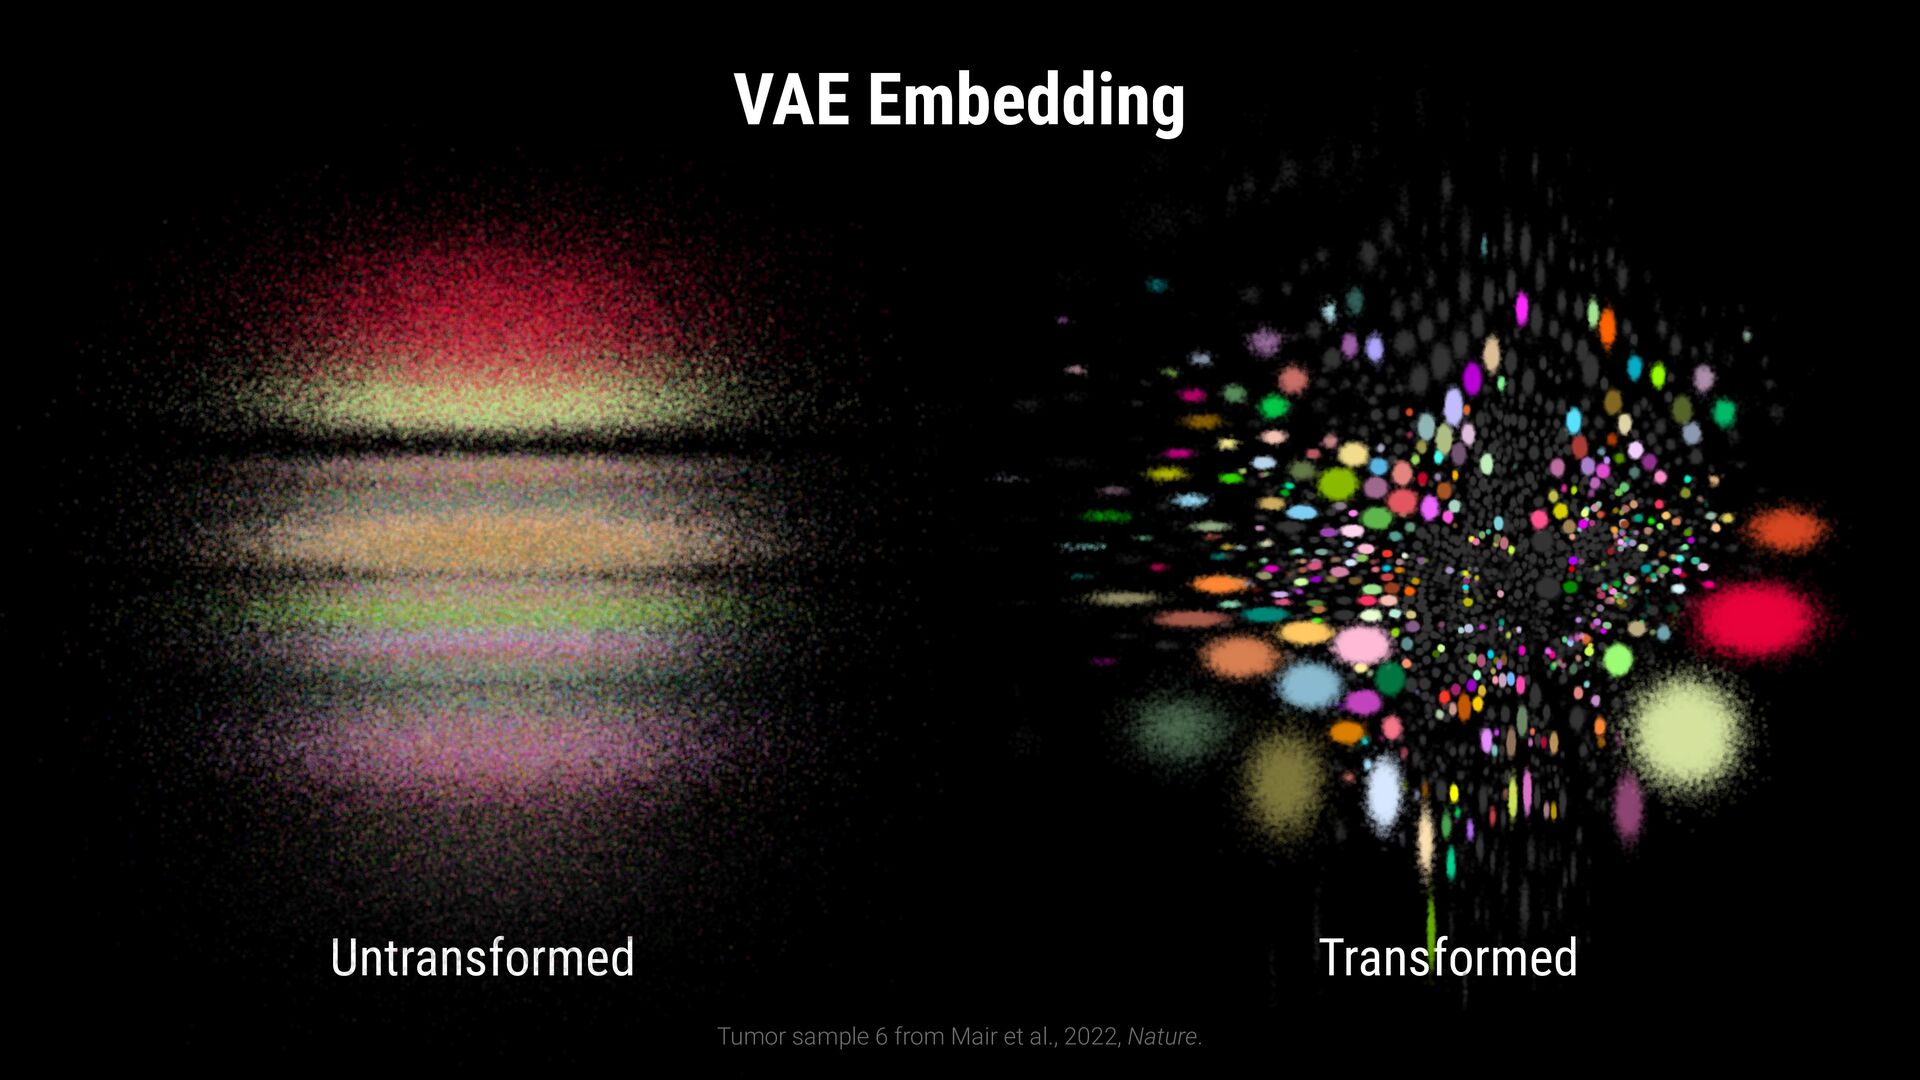
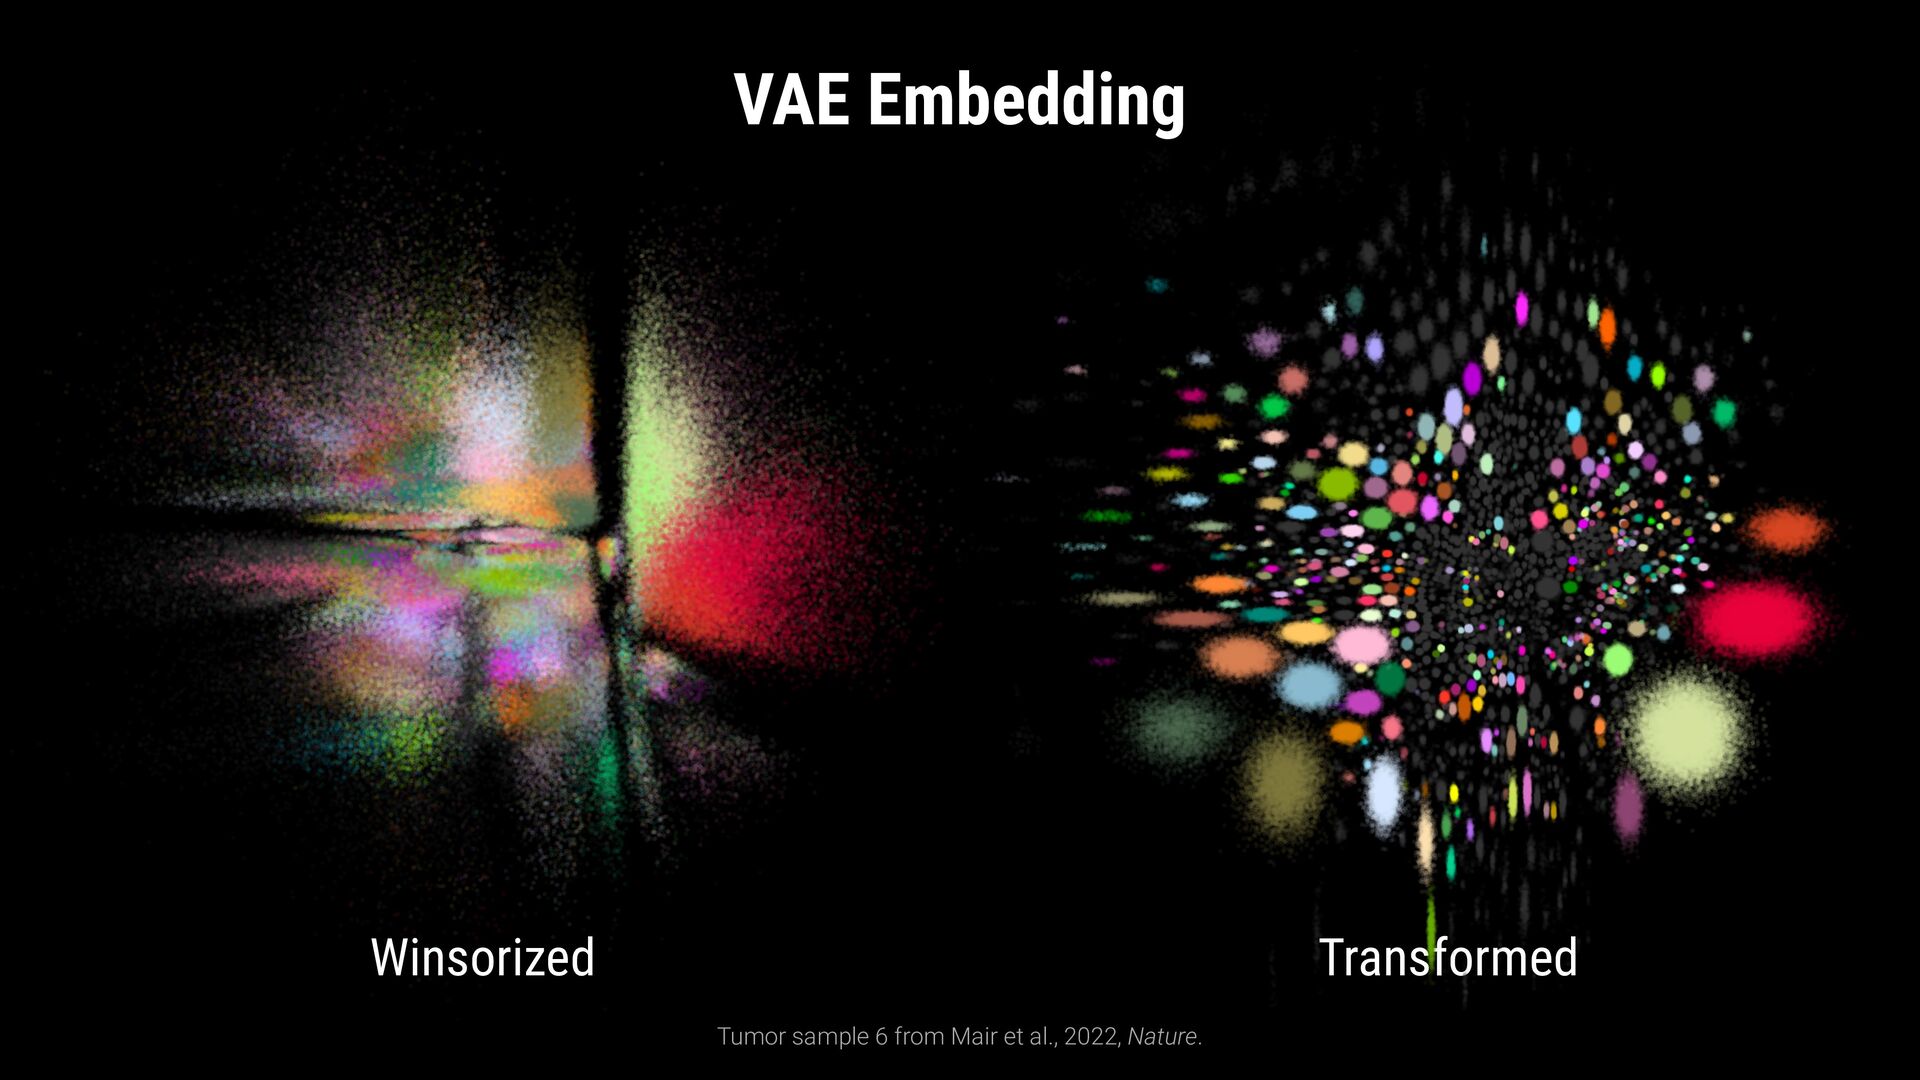
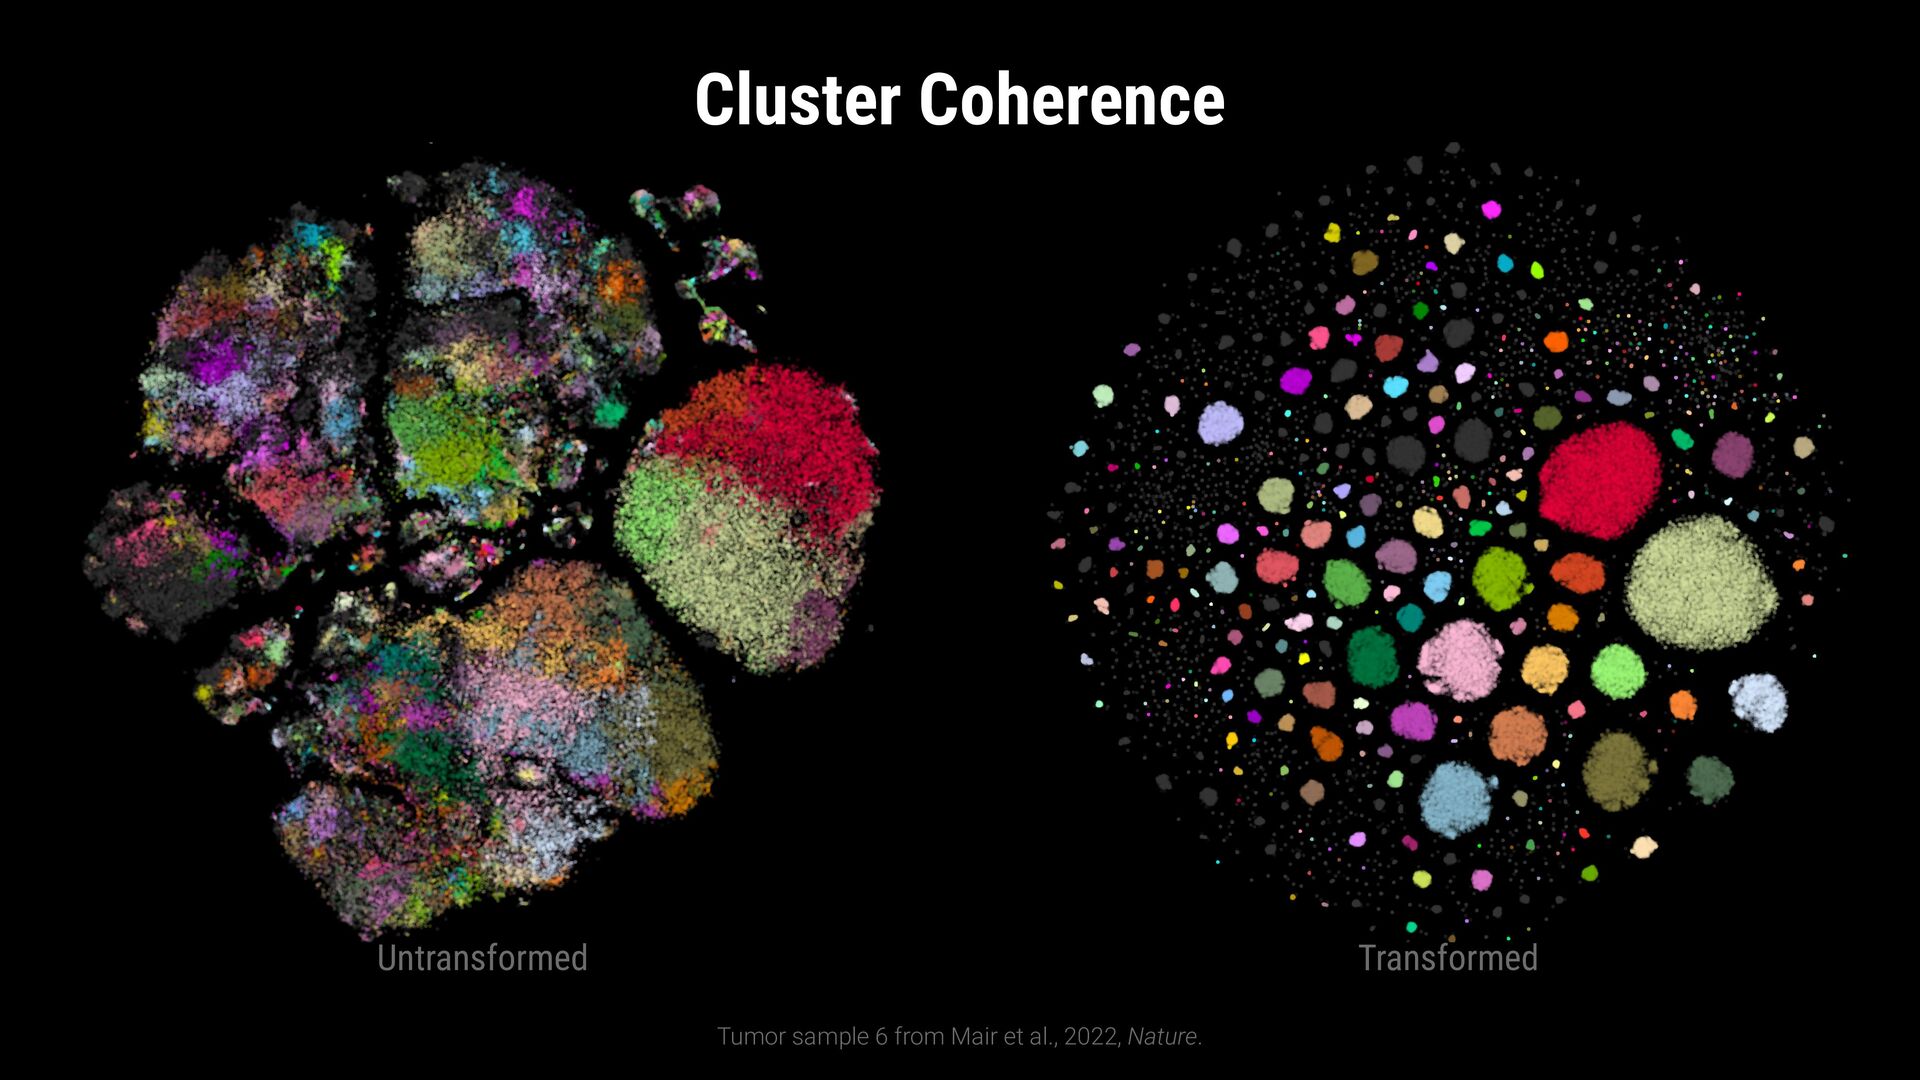
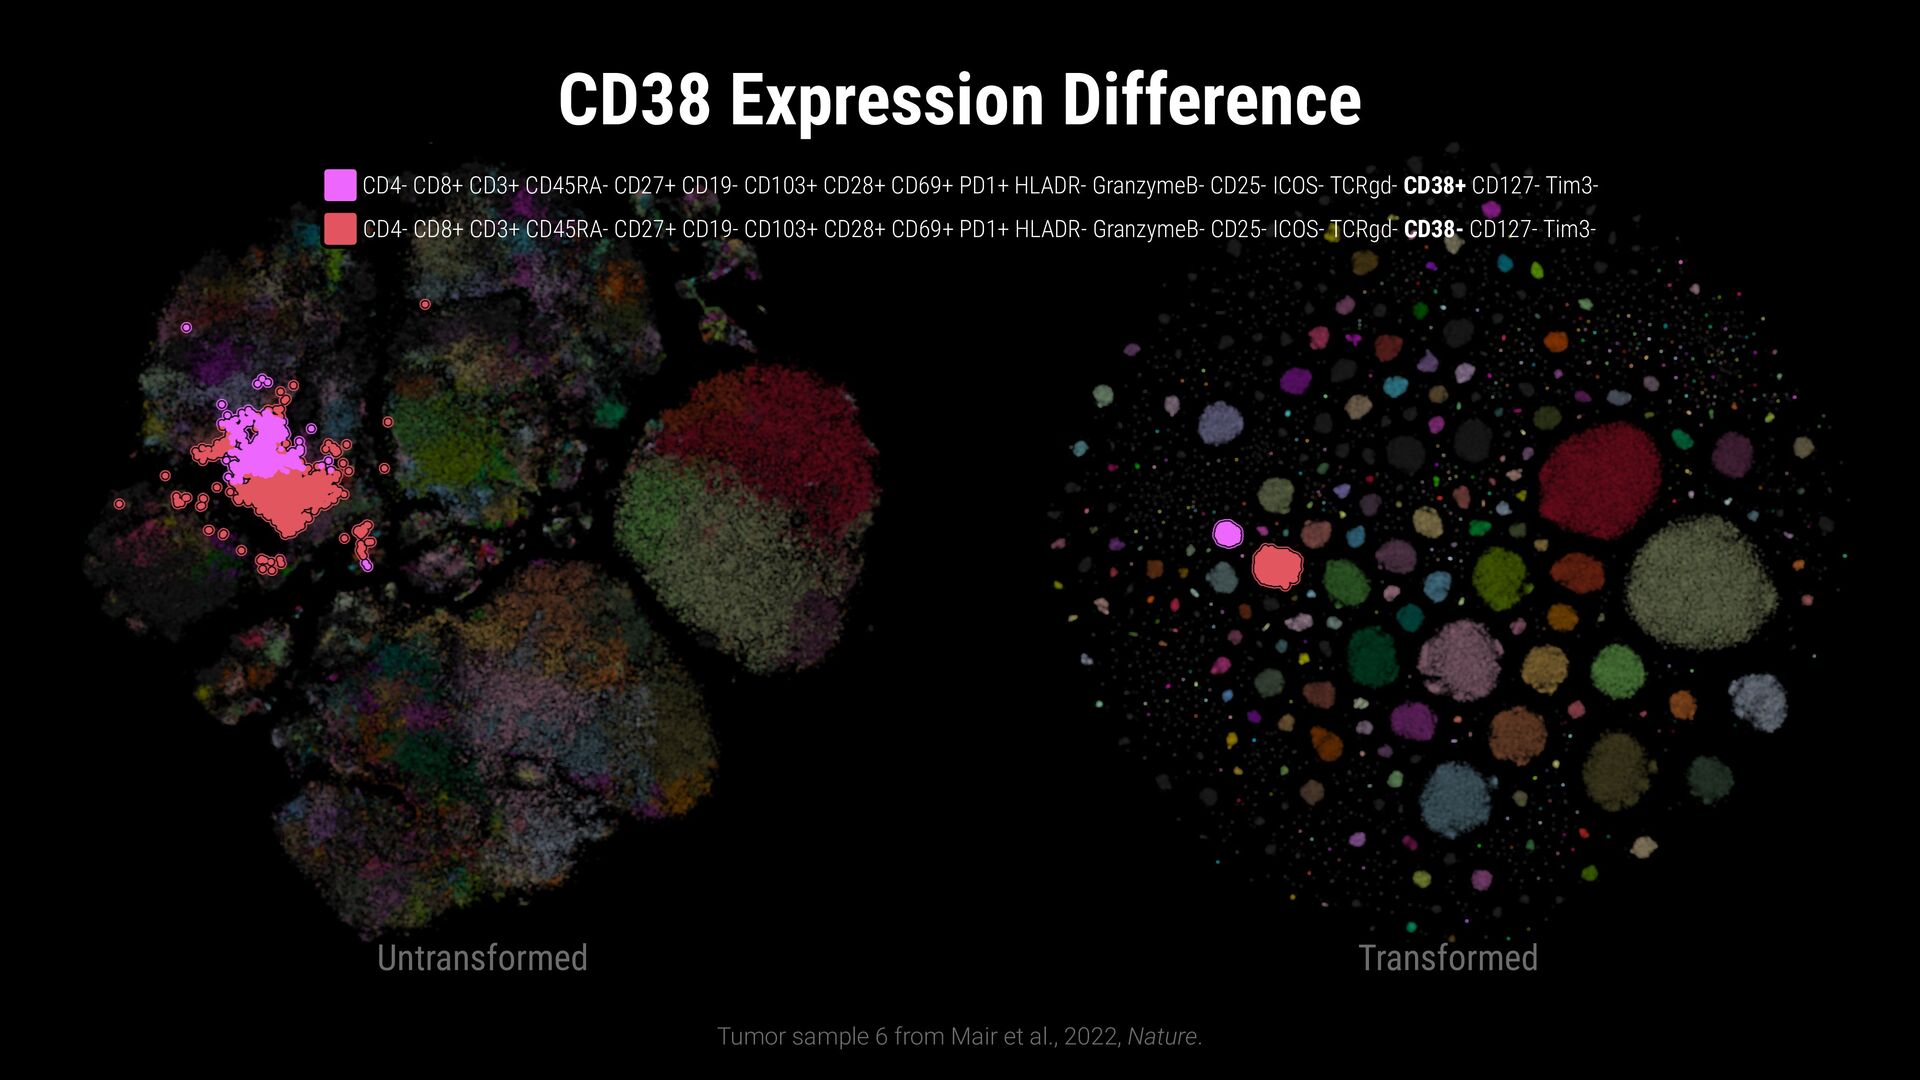
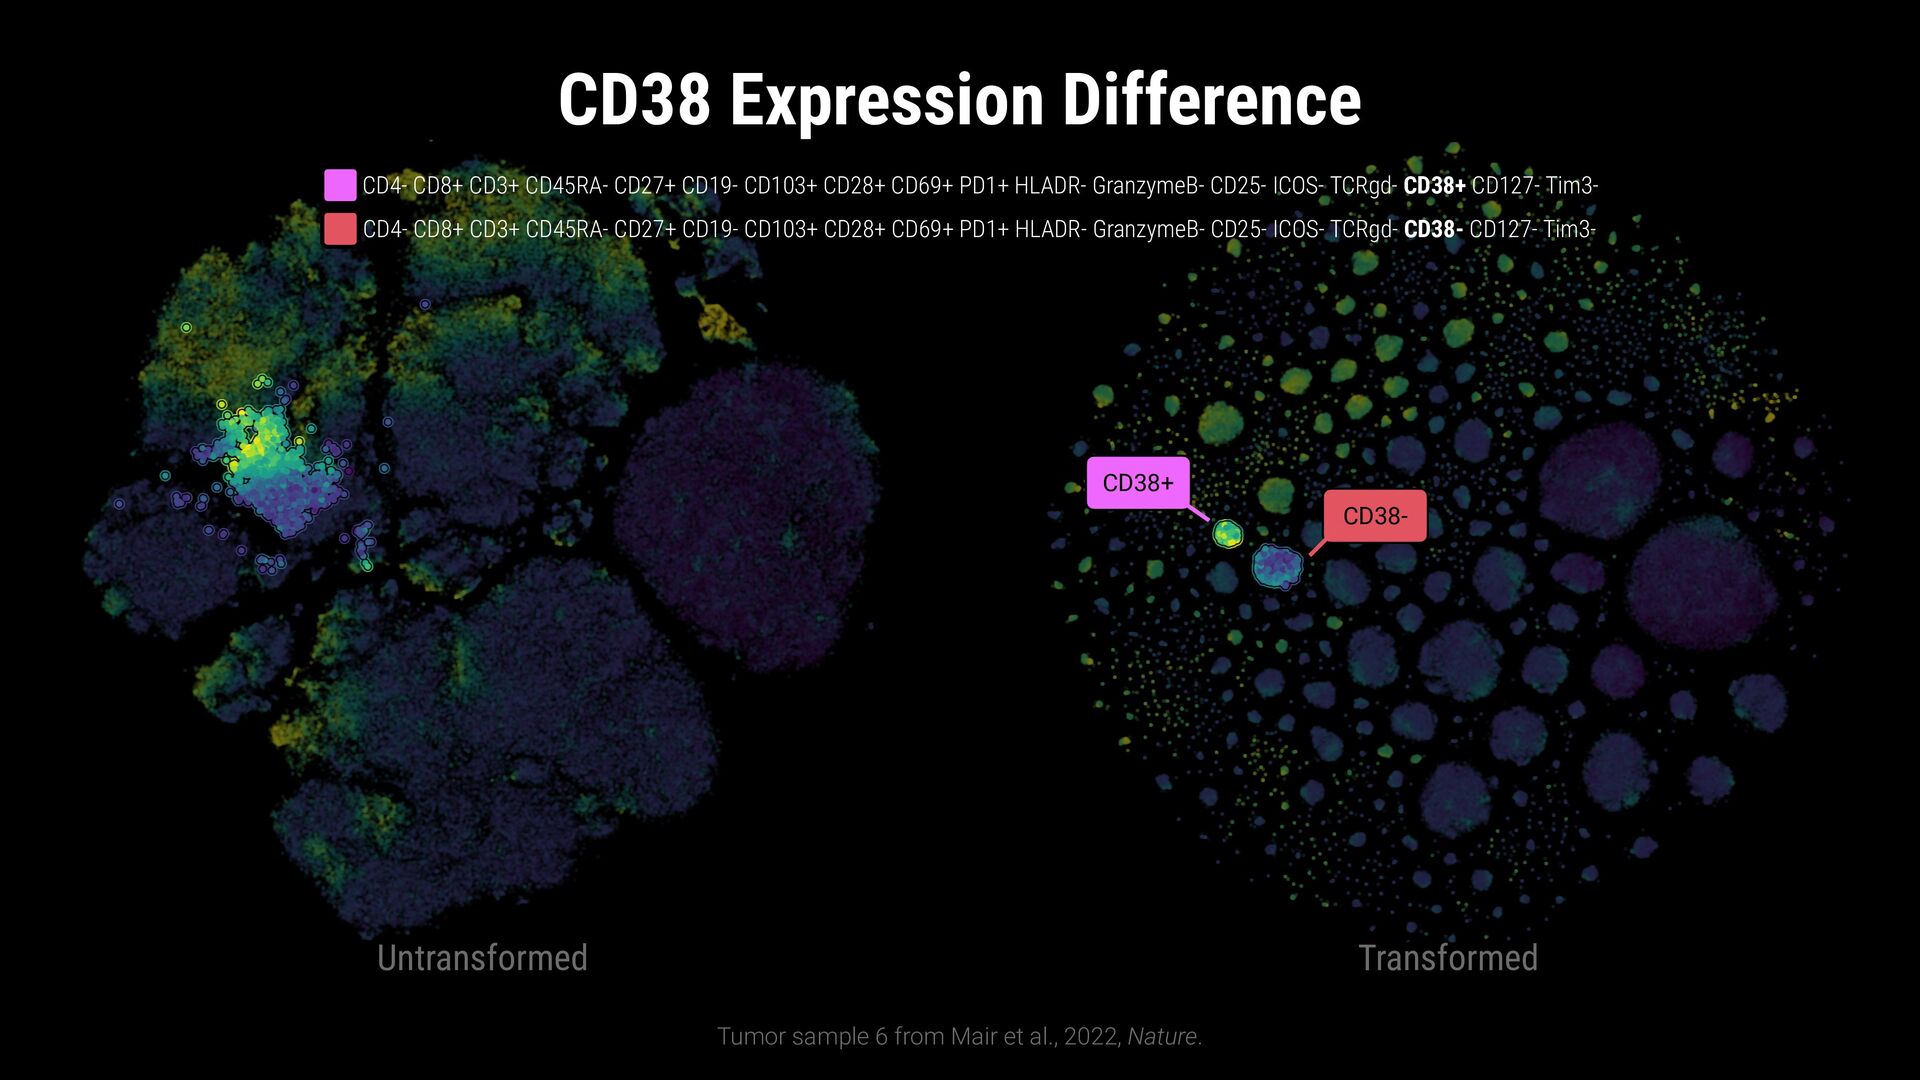
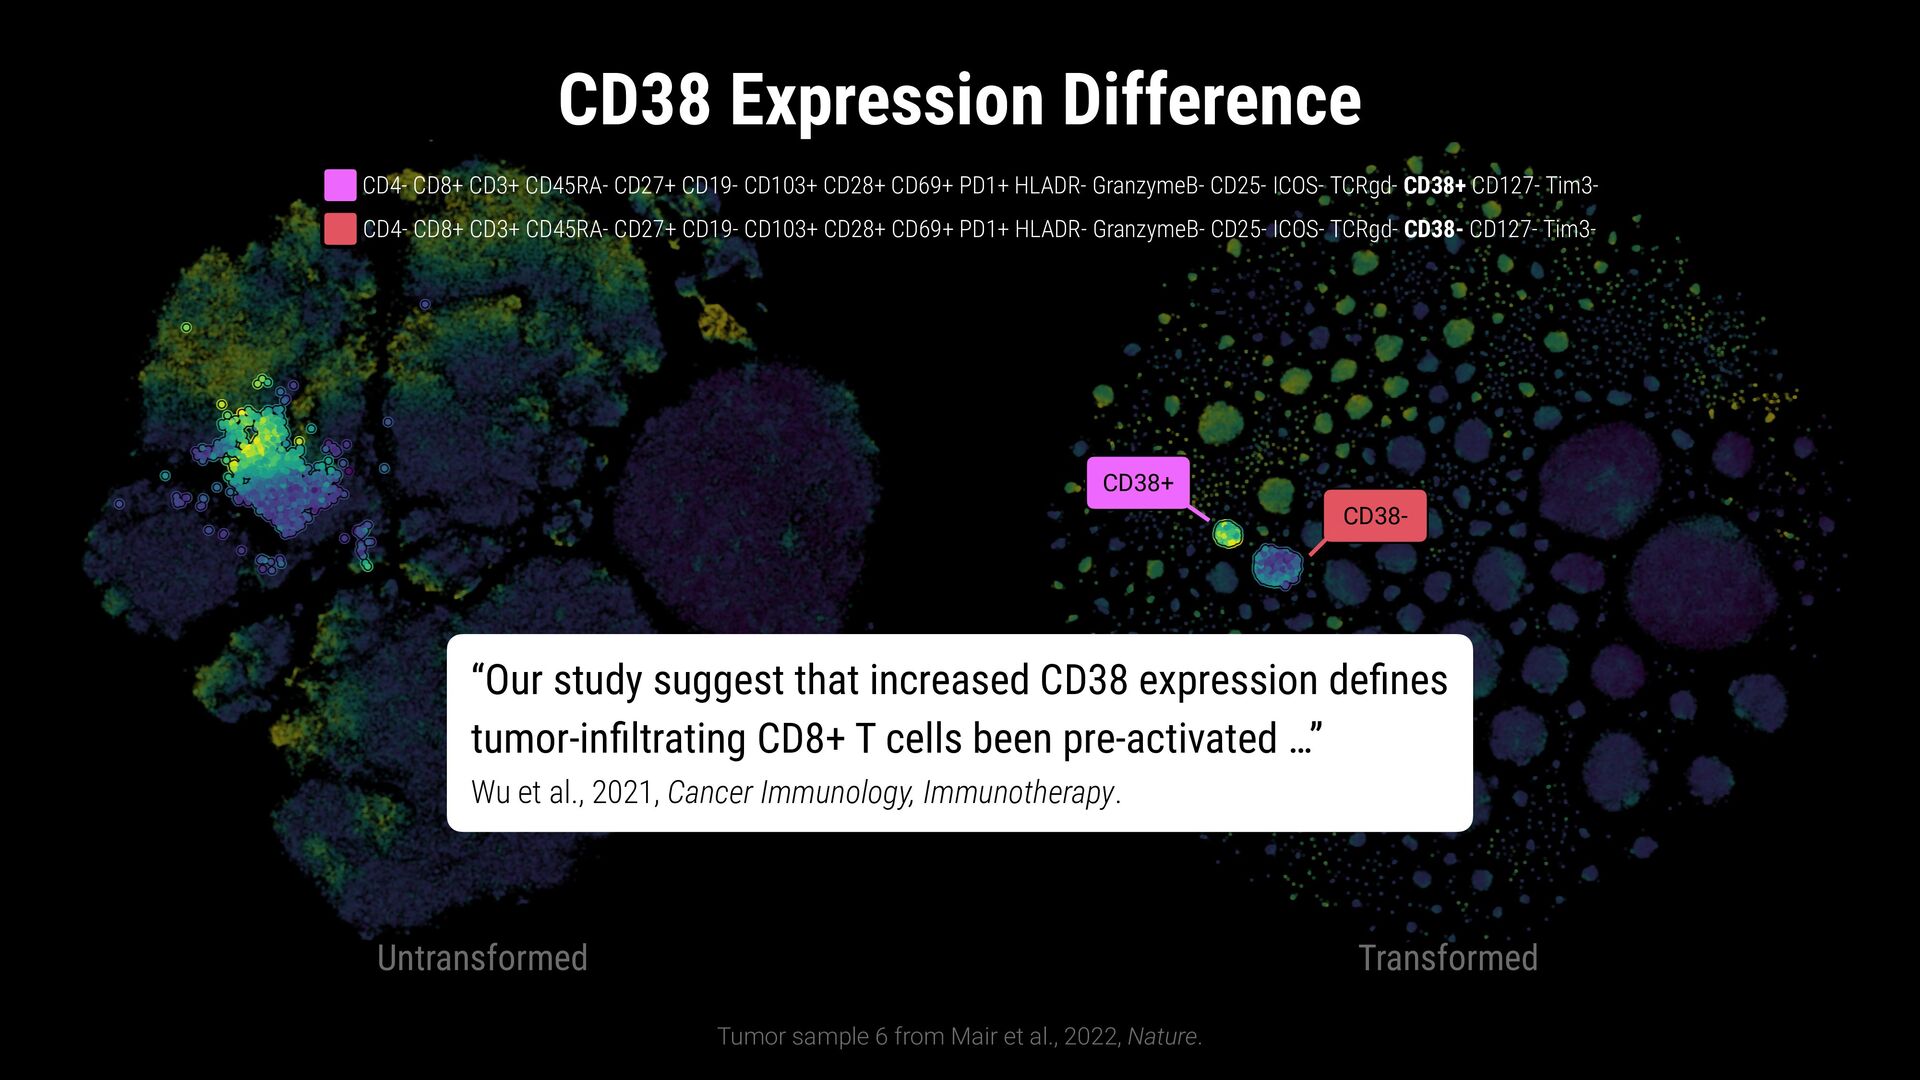
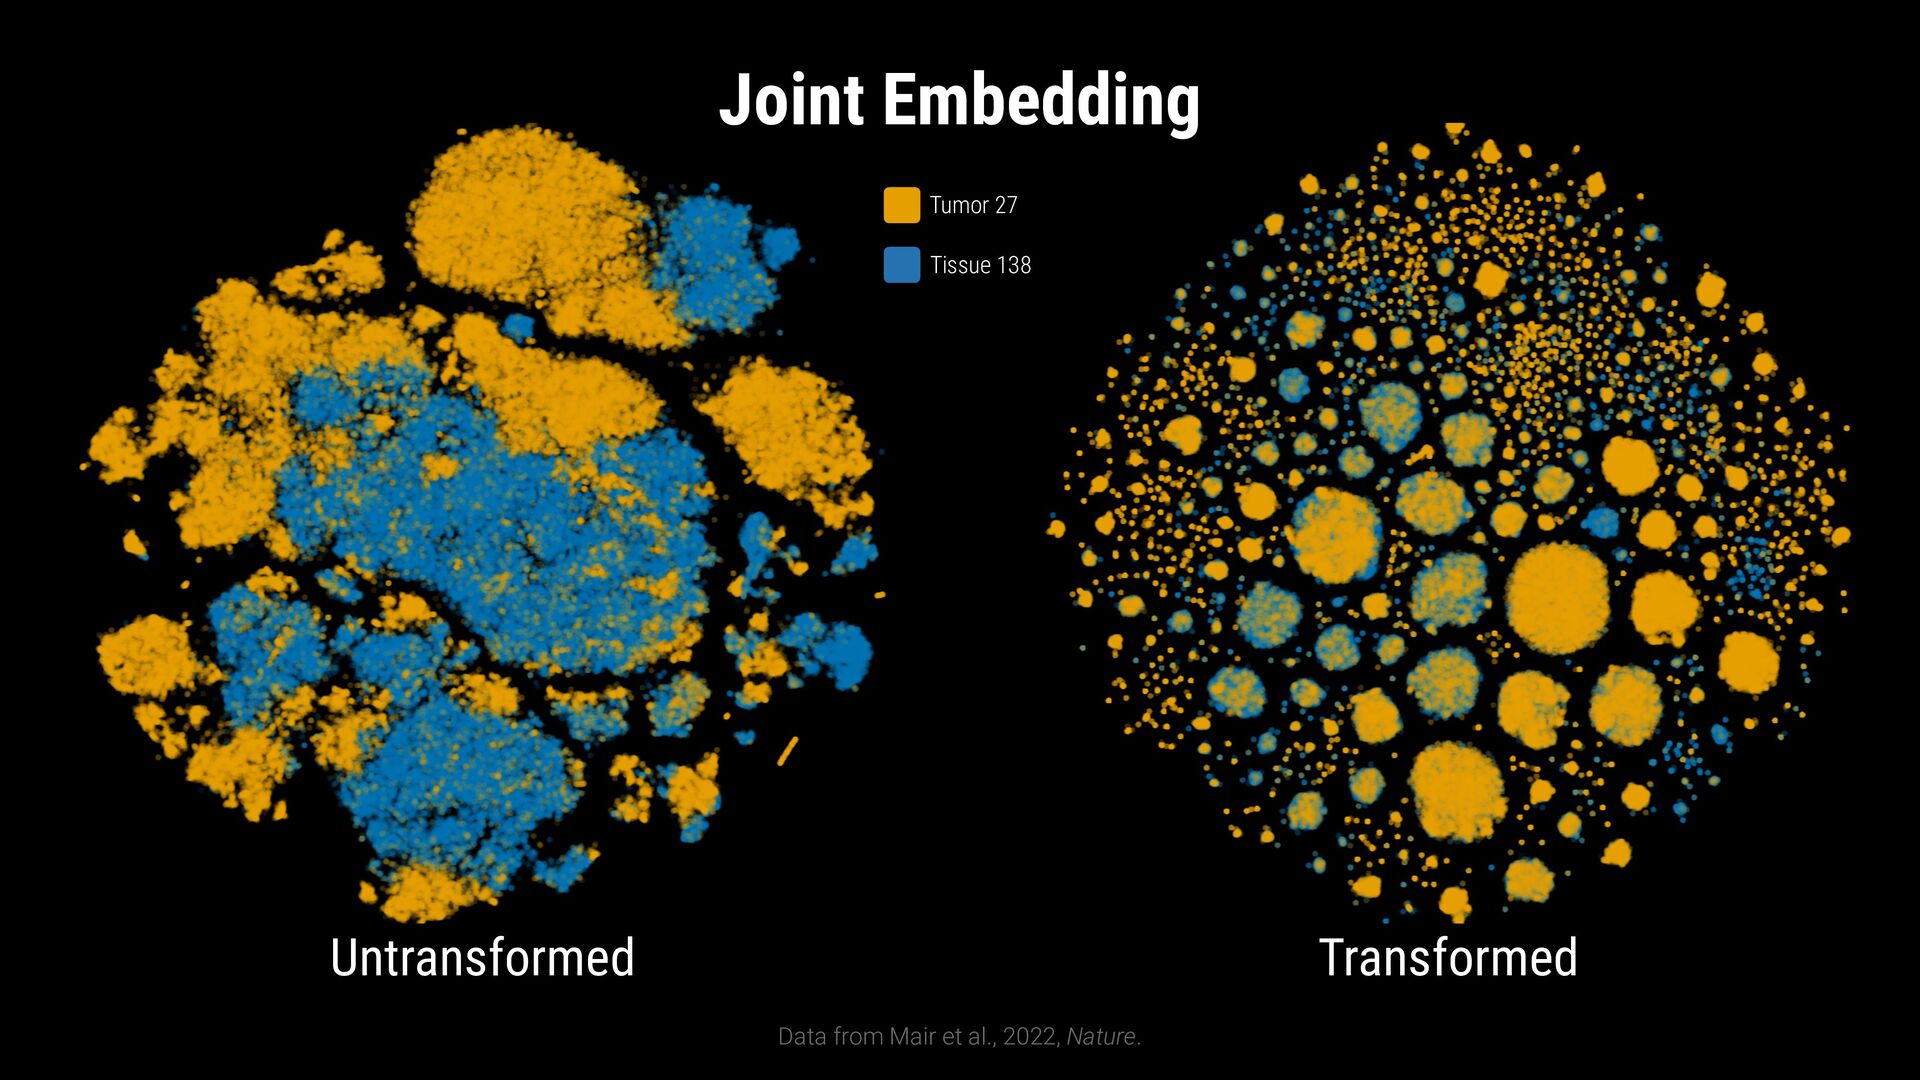
Winsorize to [1th, 99th] percentile 2. Remove inter marker differences Normalize to zero mean and unit variance 3. Align marker expressions by their expression level Translate mean to a fixed value
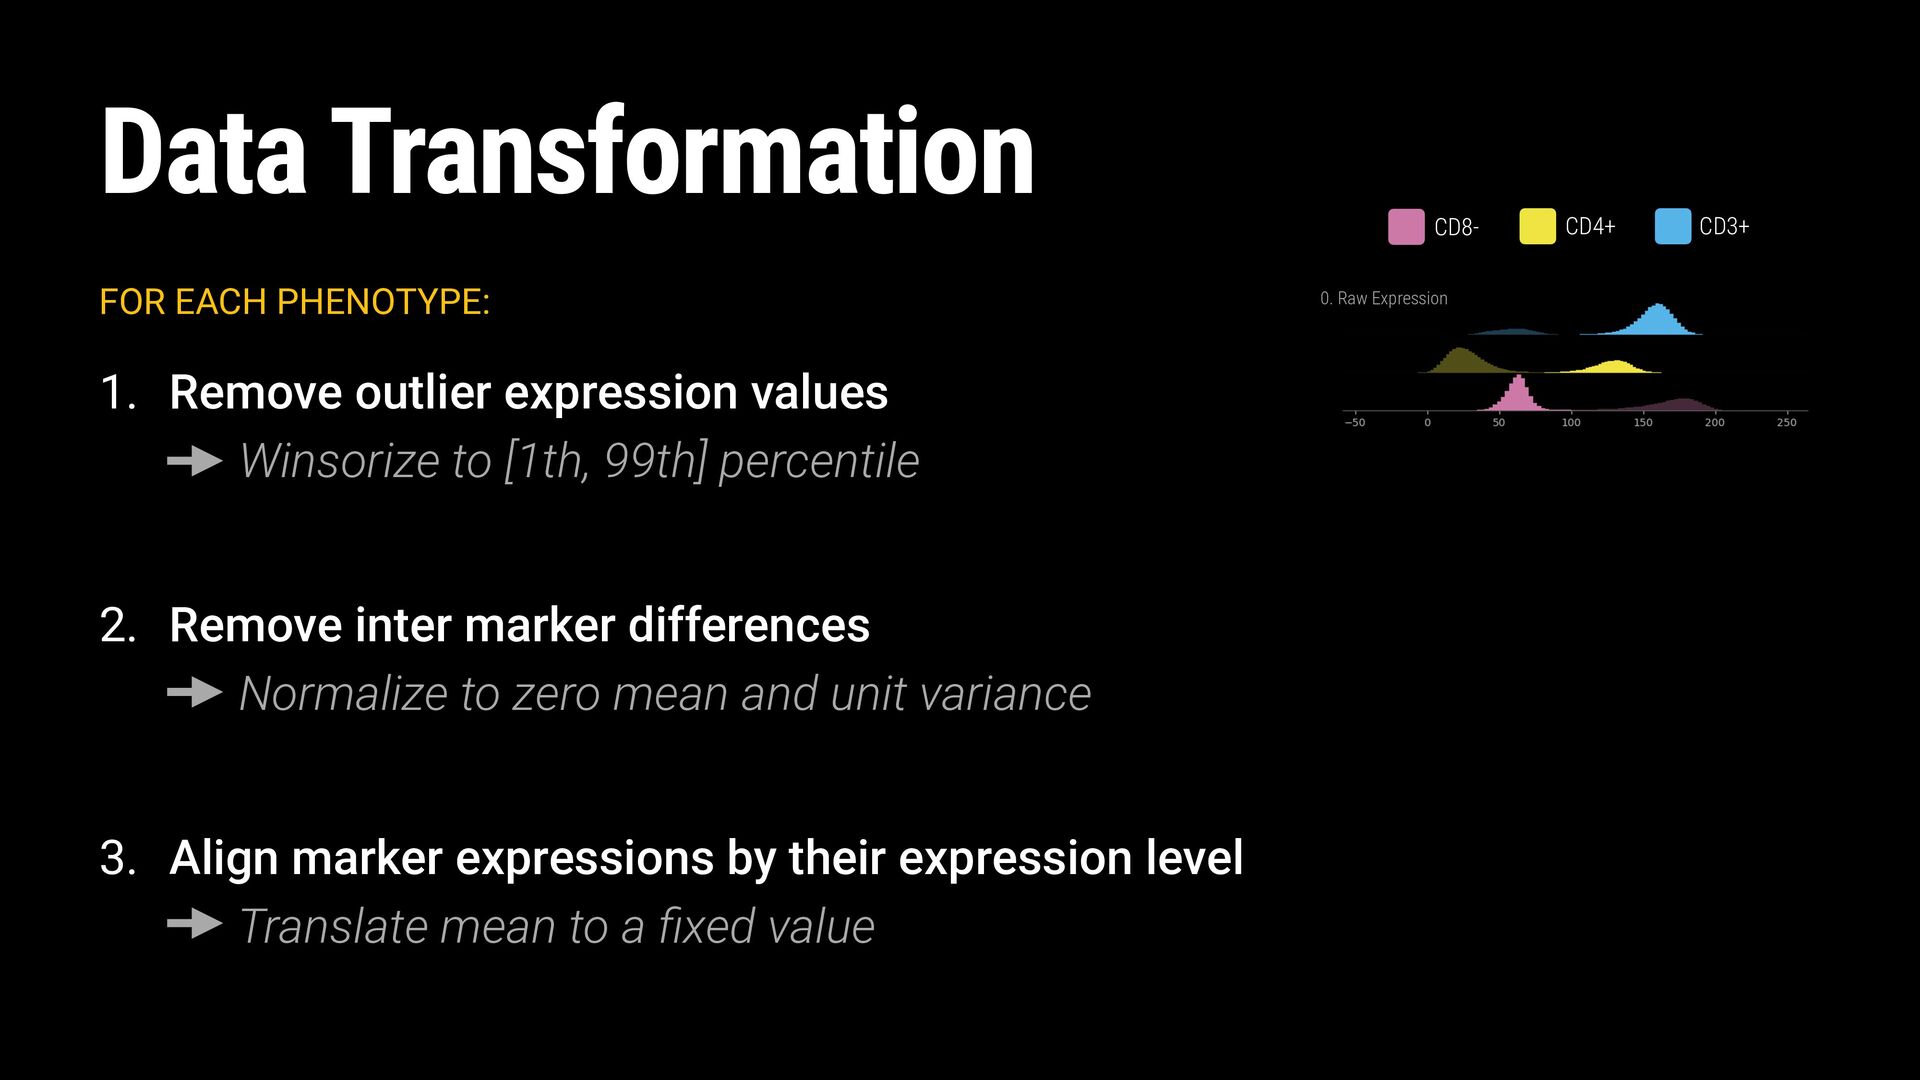
outlier expression values Winsorize to [1th, 99th] percentile 2. Remove inter marker differences Normalize to zero mean and unit variance 3. Align marker expressions by their expression level Translate mean to a fixed value CD3+ CD4+ CD8-
outlier expression values Winsorize to [1th, 99th] percentile 2. Remove inter marker differences Normalize to zero mean and unit variance 3. Align marker expressions by their expression level Translate mean to a fixed value CD3+ CD4+ CD8-
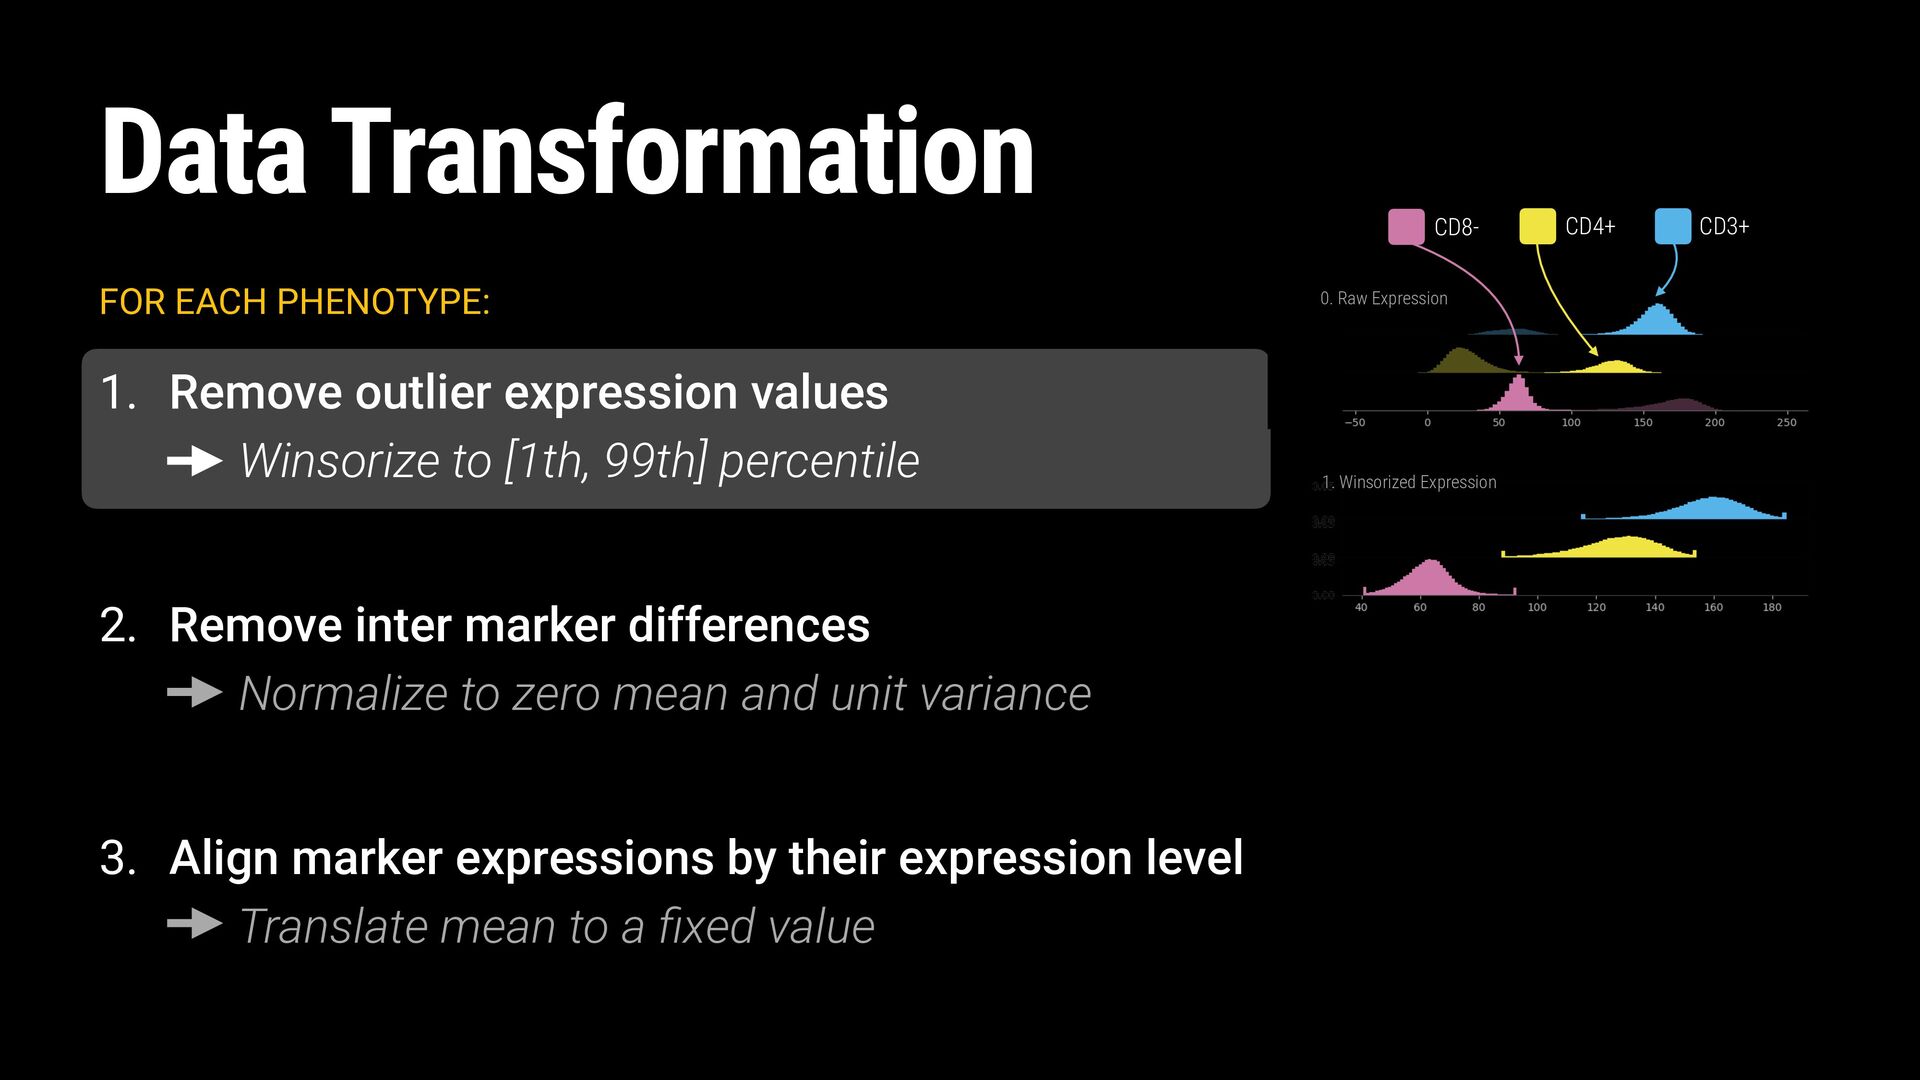
[1th, 99th] percentile 2. Remove inter marker differences Normalize to zero mean and unit variance 3. Align marker expressions by their expression level Translate mean to a fixed value Data Transformation 0. Raw Expression 1. Winsorized Expression CD3+ CD4+ CD8-
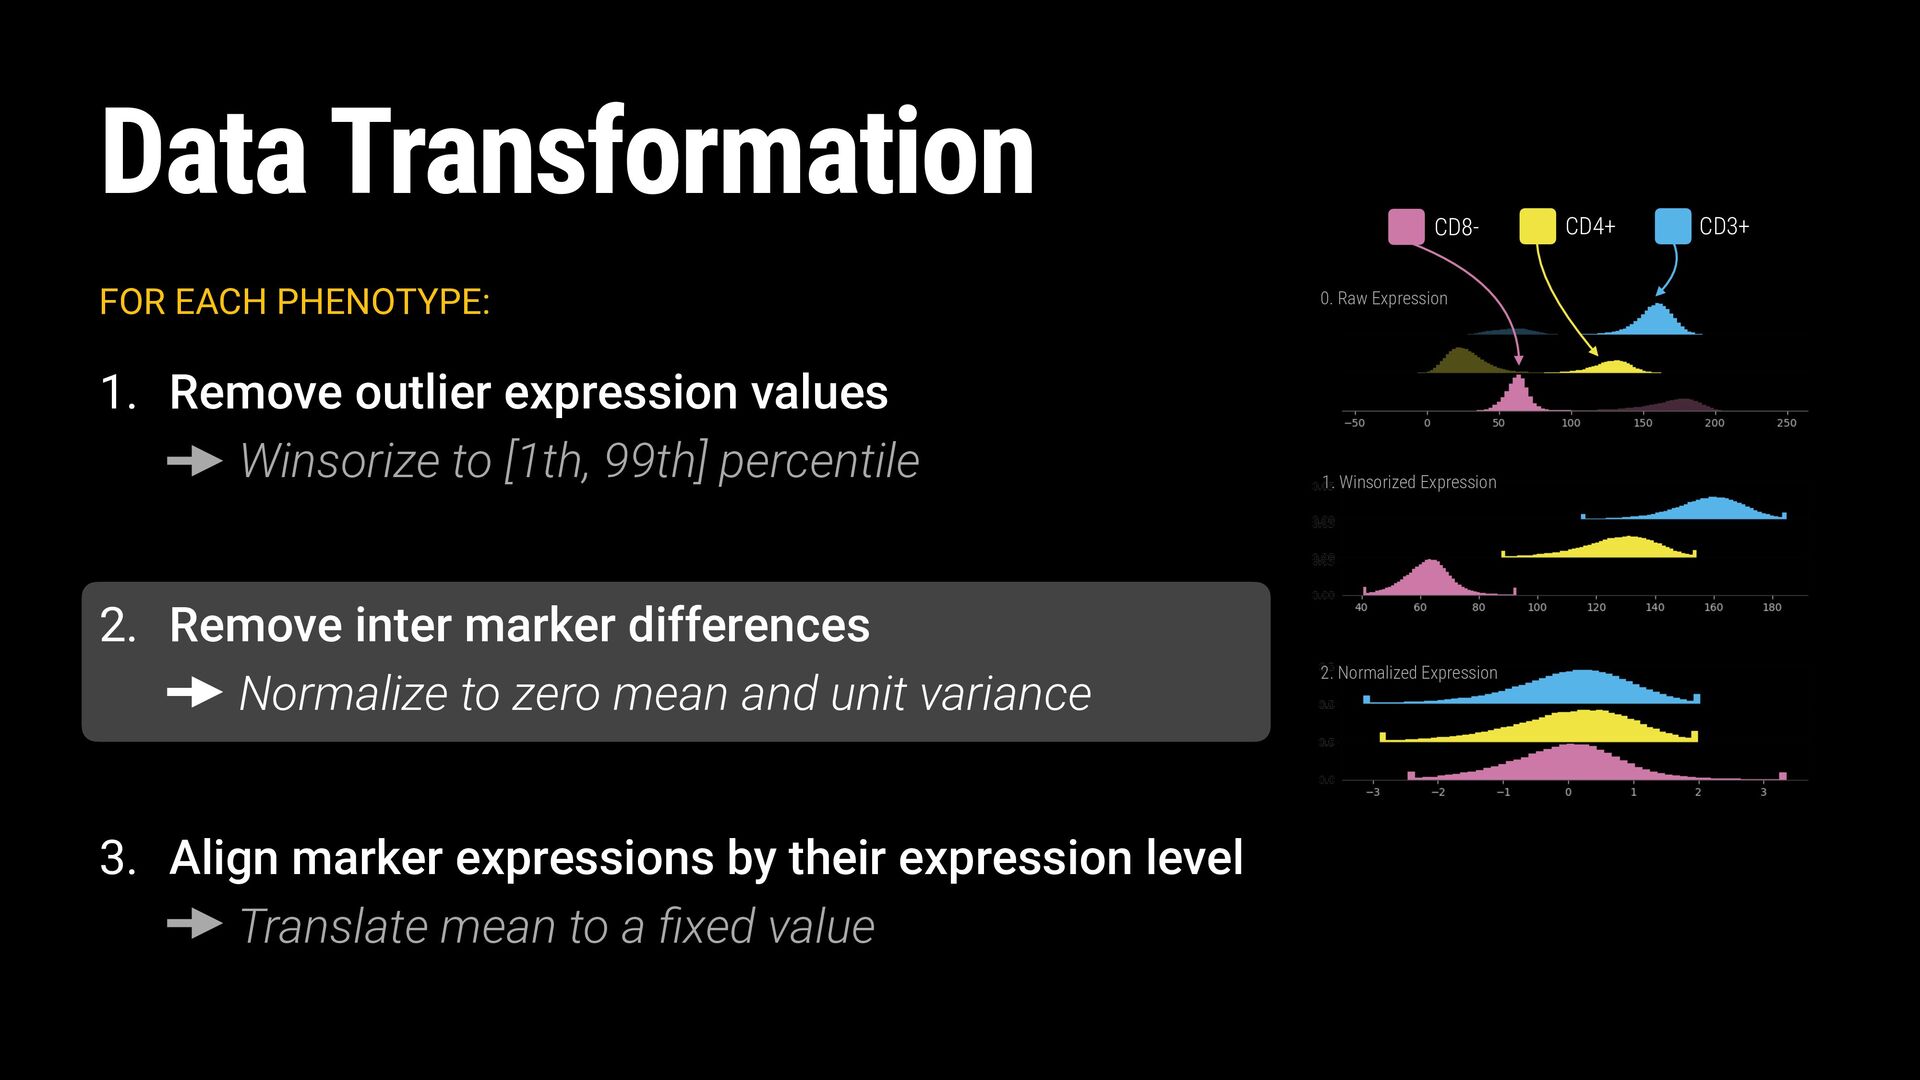
Winsorize to [1th, 99th] percentile 2. Remove inter marker differences Normalize to zero mean and unit variance 3. Align marker expressions by their expression level Translate mean to a fixed value 0. Raw Expression 1. Winsorized Expression 2. Normalized Expression CD3+ CD4+ CD8-
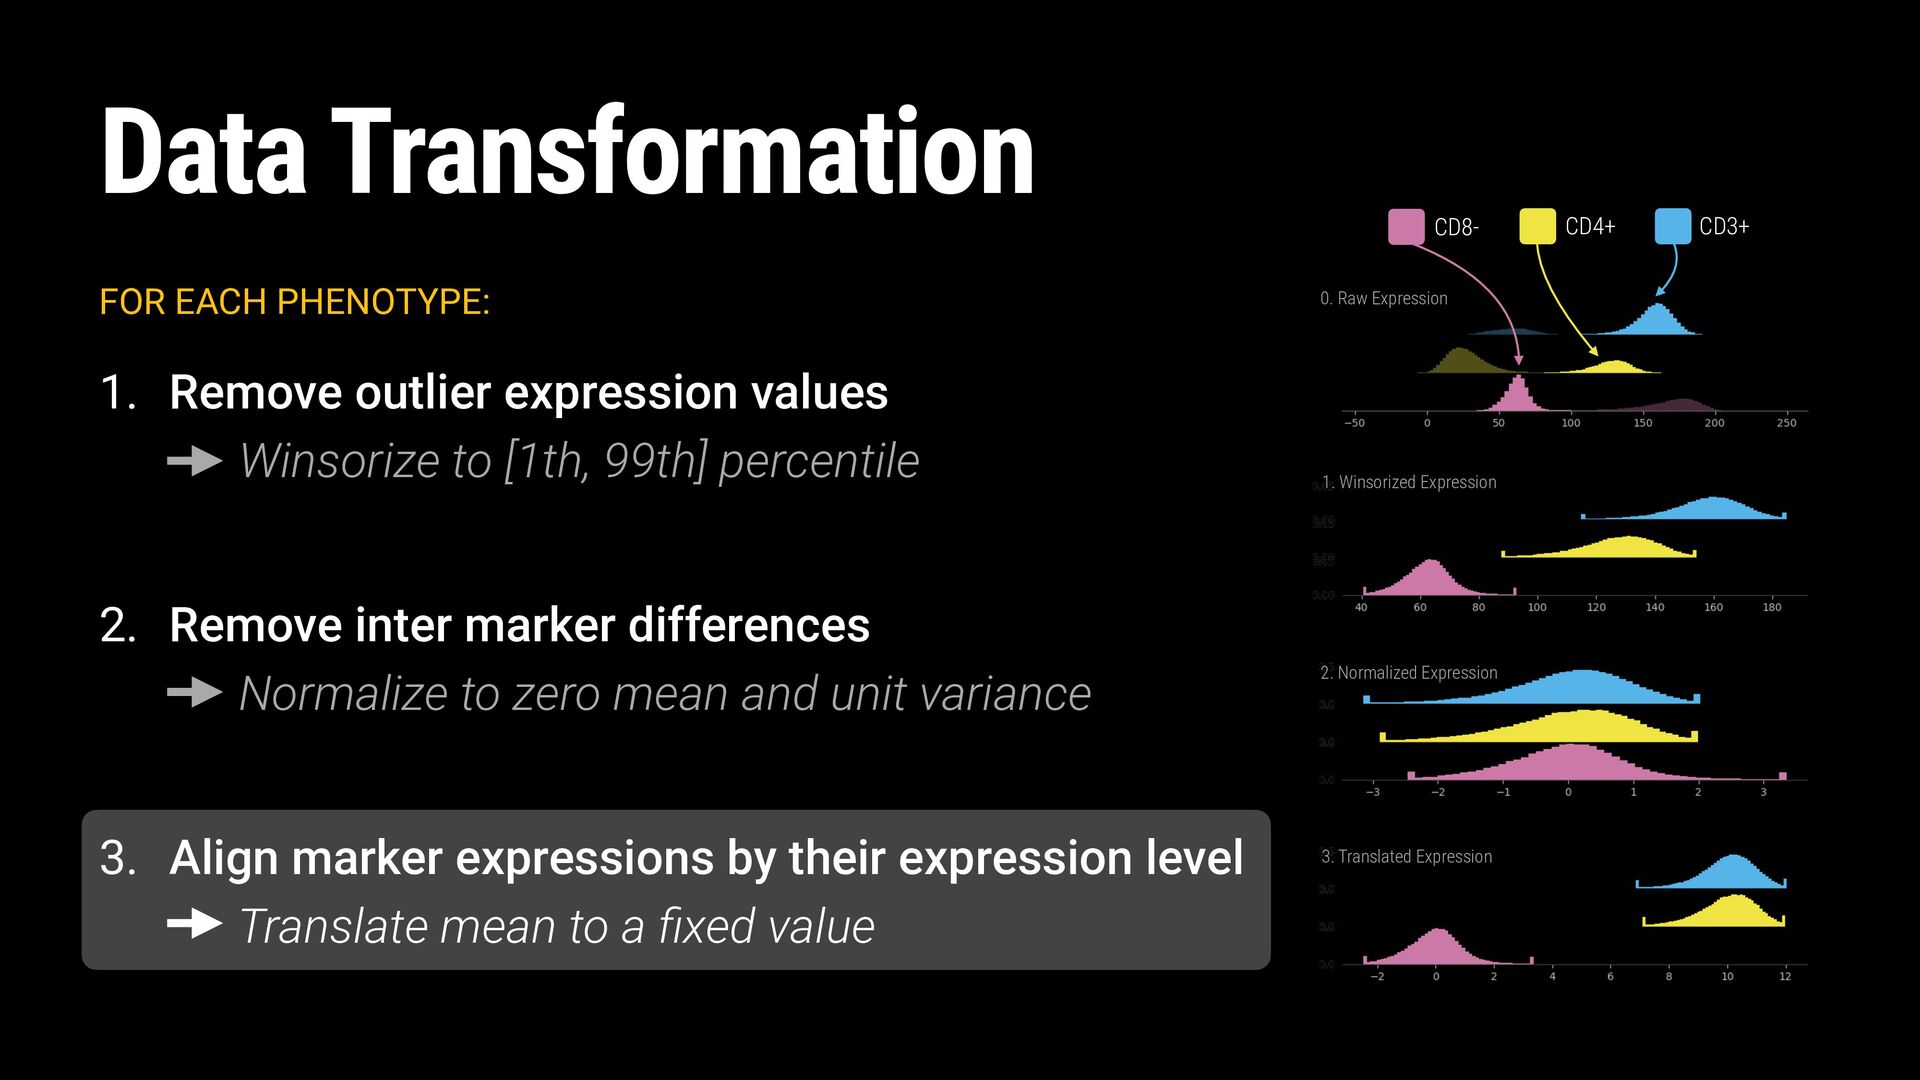
Winsorize to [1th, 99th] percentile 2. Remove inter marker differences Normalize to zero mean and unit variance 3. Align marker expressions by their expression level Translate mean to a fixed value 0. Raw Expression 1. Winsorized Expression 2. Normalized Expression 3. Translated Expression CD3+ CD4+ CD8-
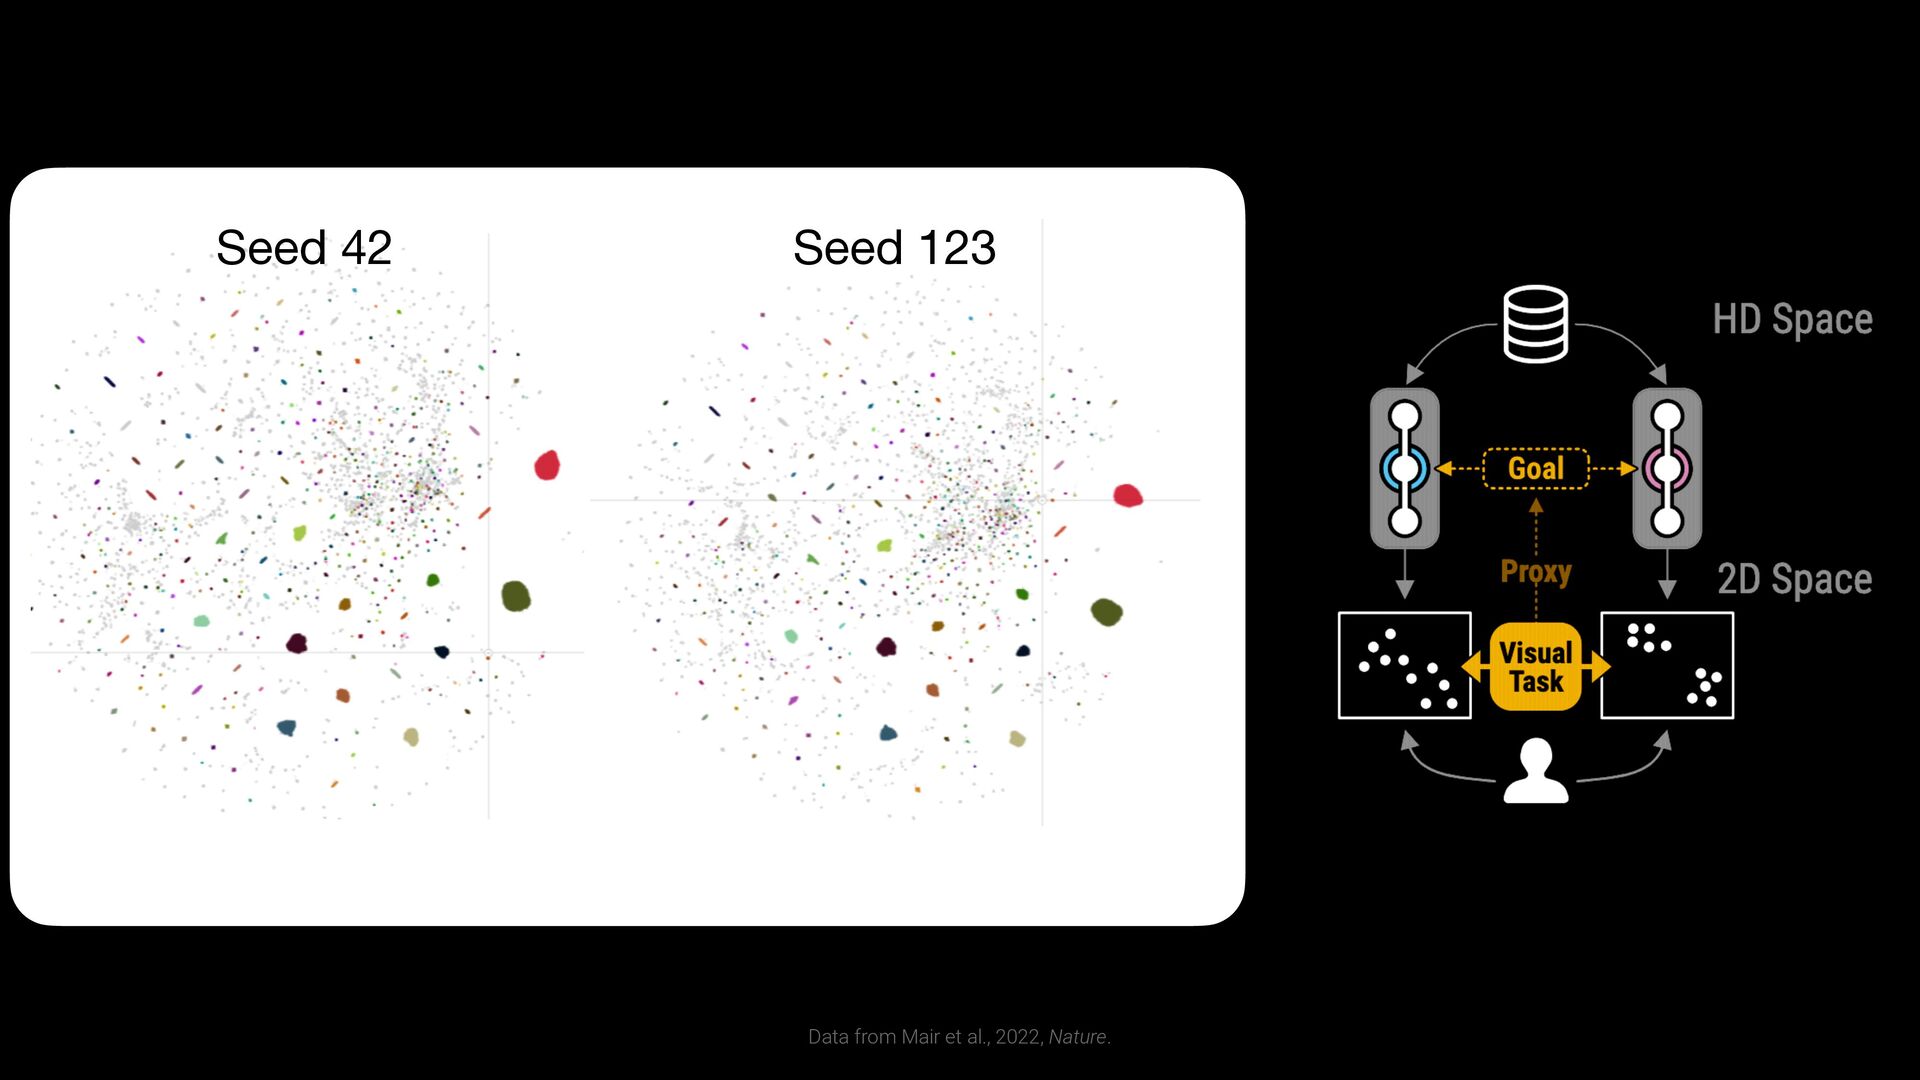
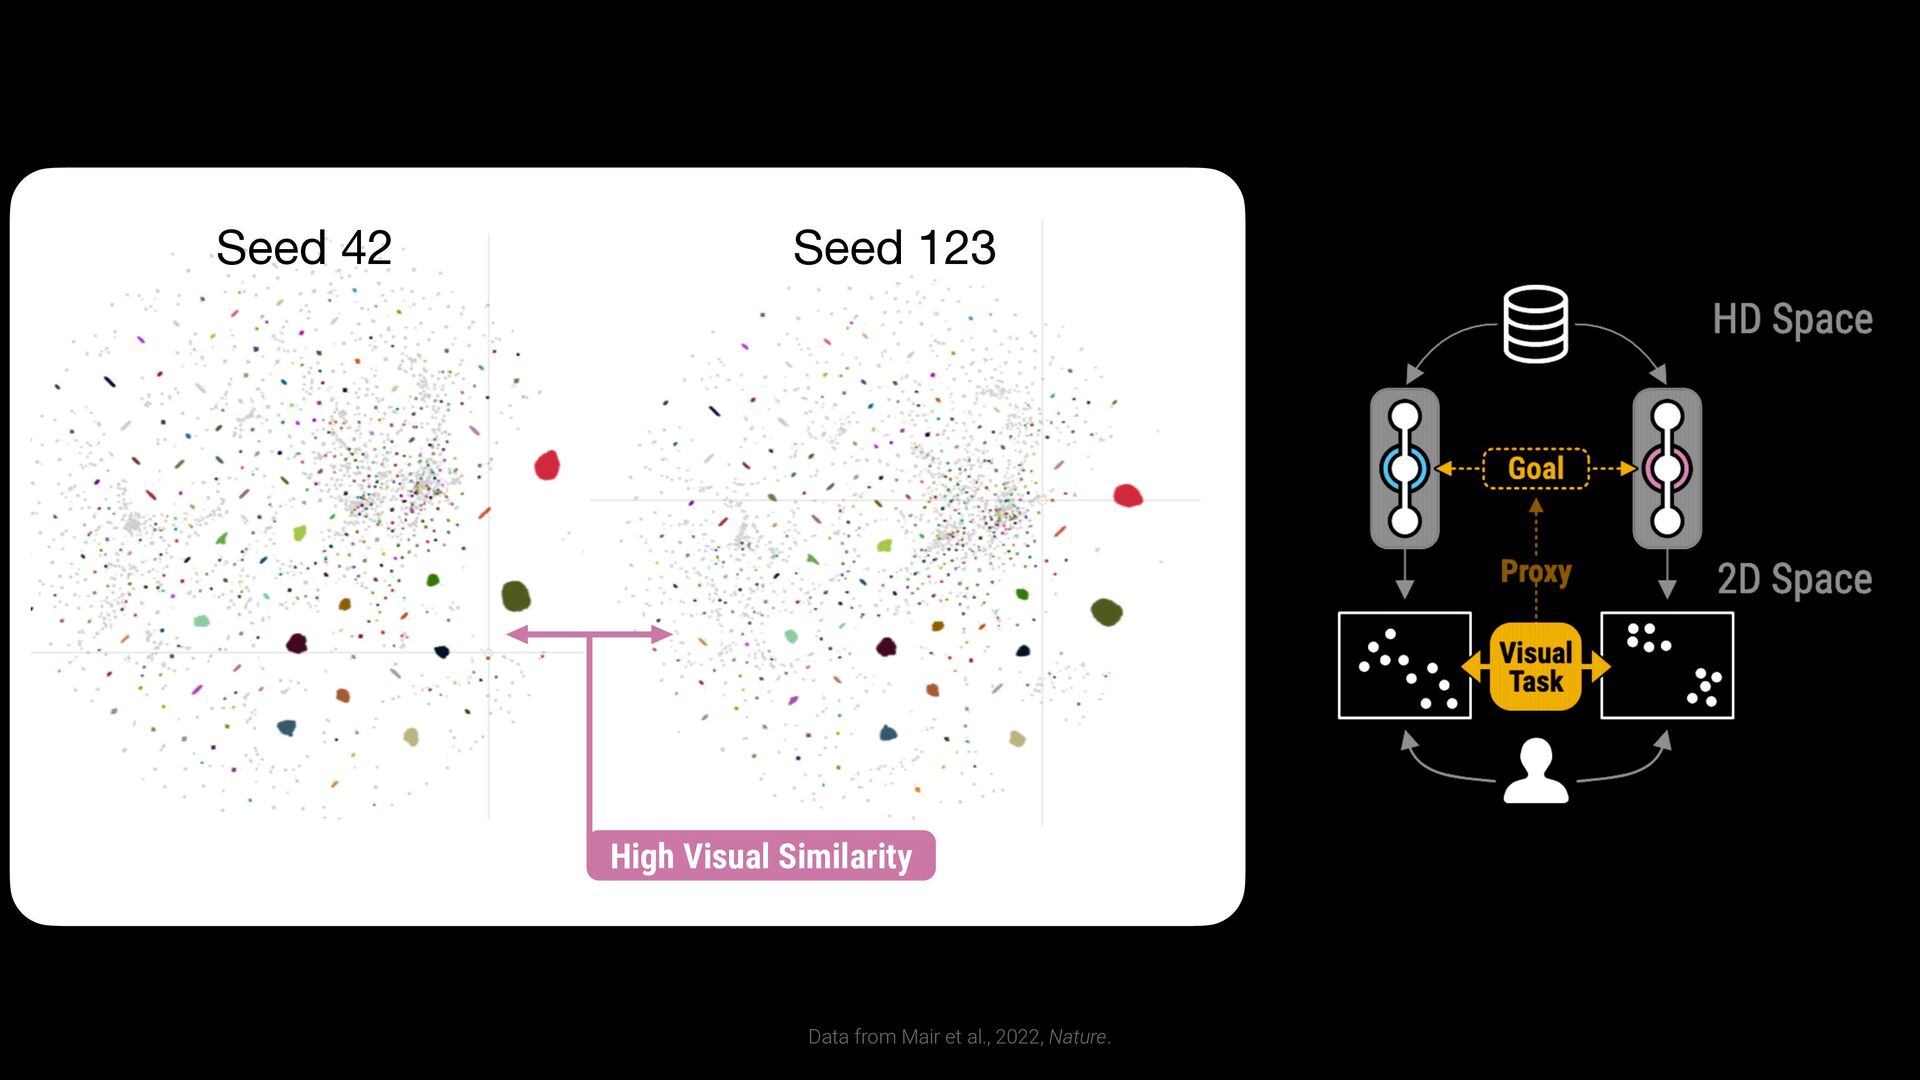
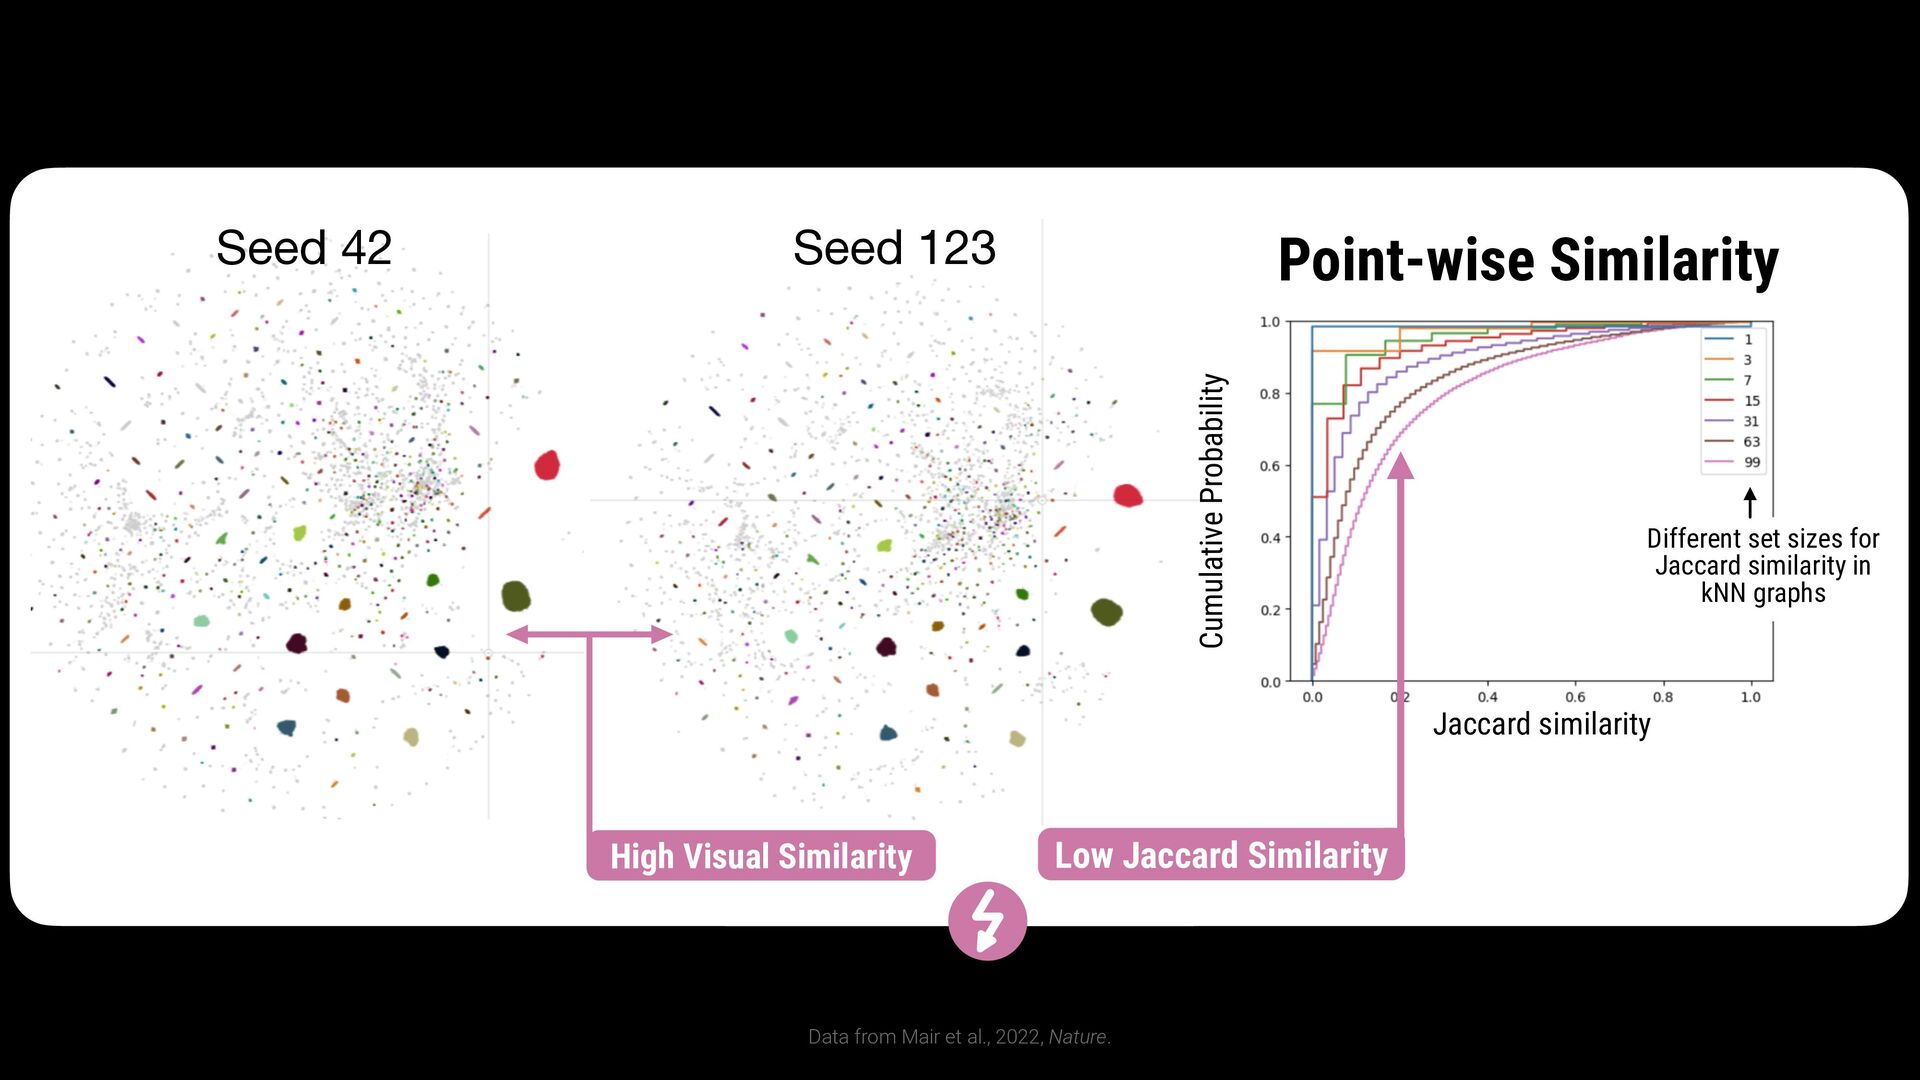
42 Seed 123 High Visual Similarity Jaccard similarity Different set sizes for Jaccard similarity in kNN graphs Cumulative Probability Point-wise Similarity Low Jaccard Similarity
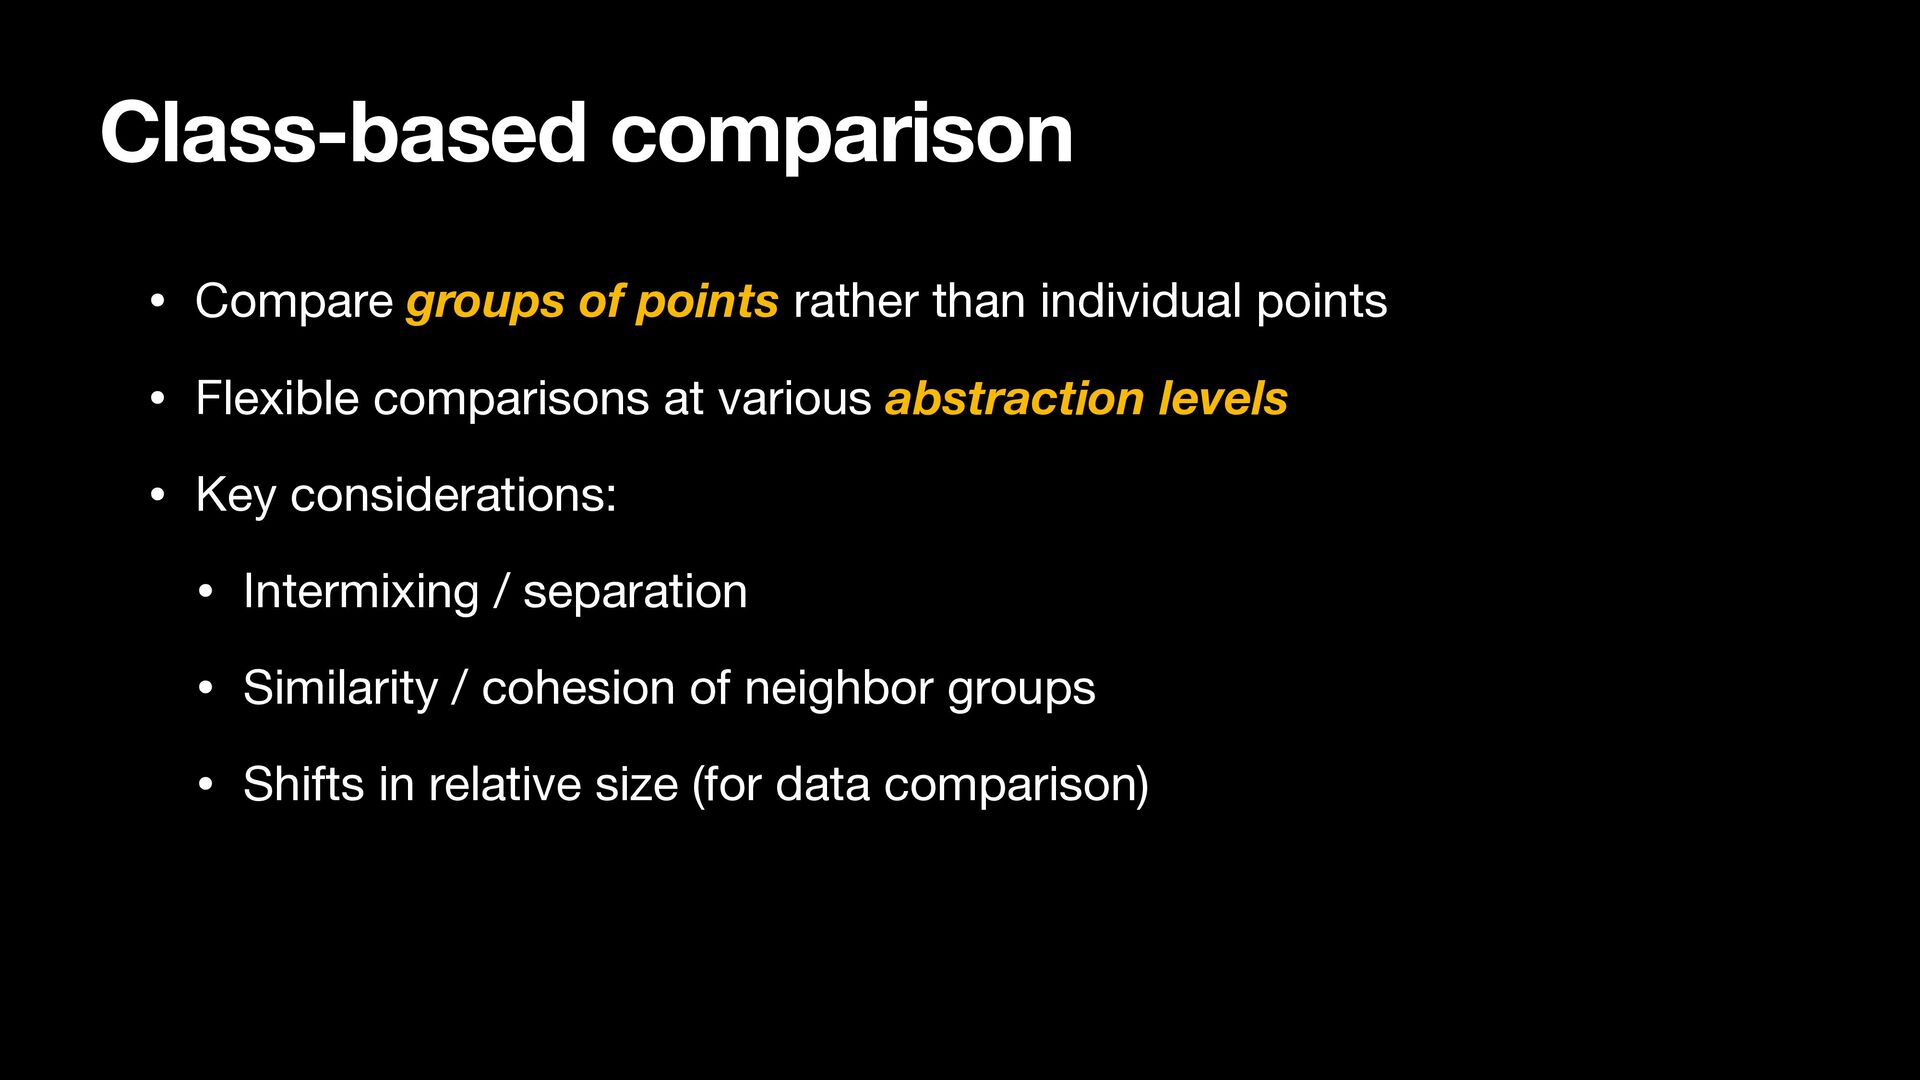
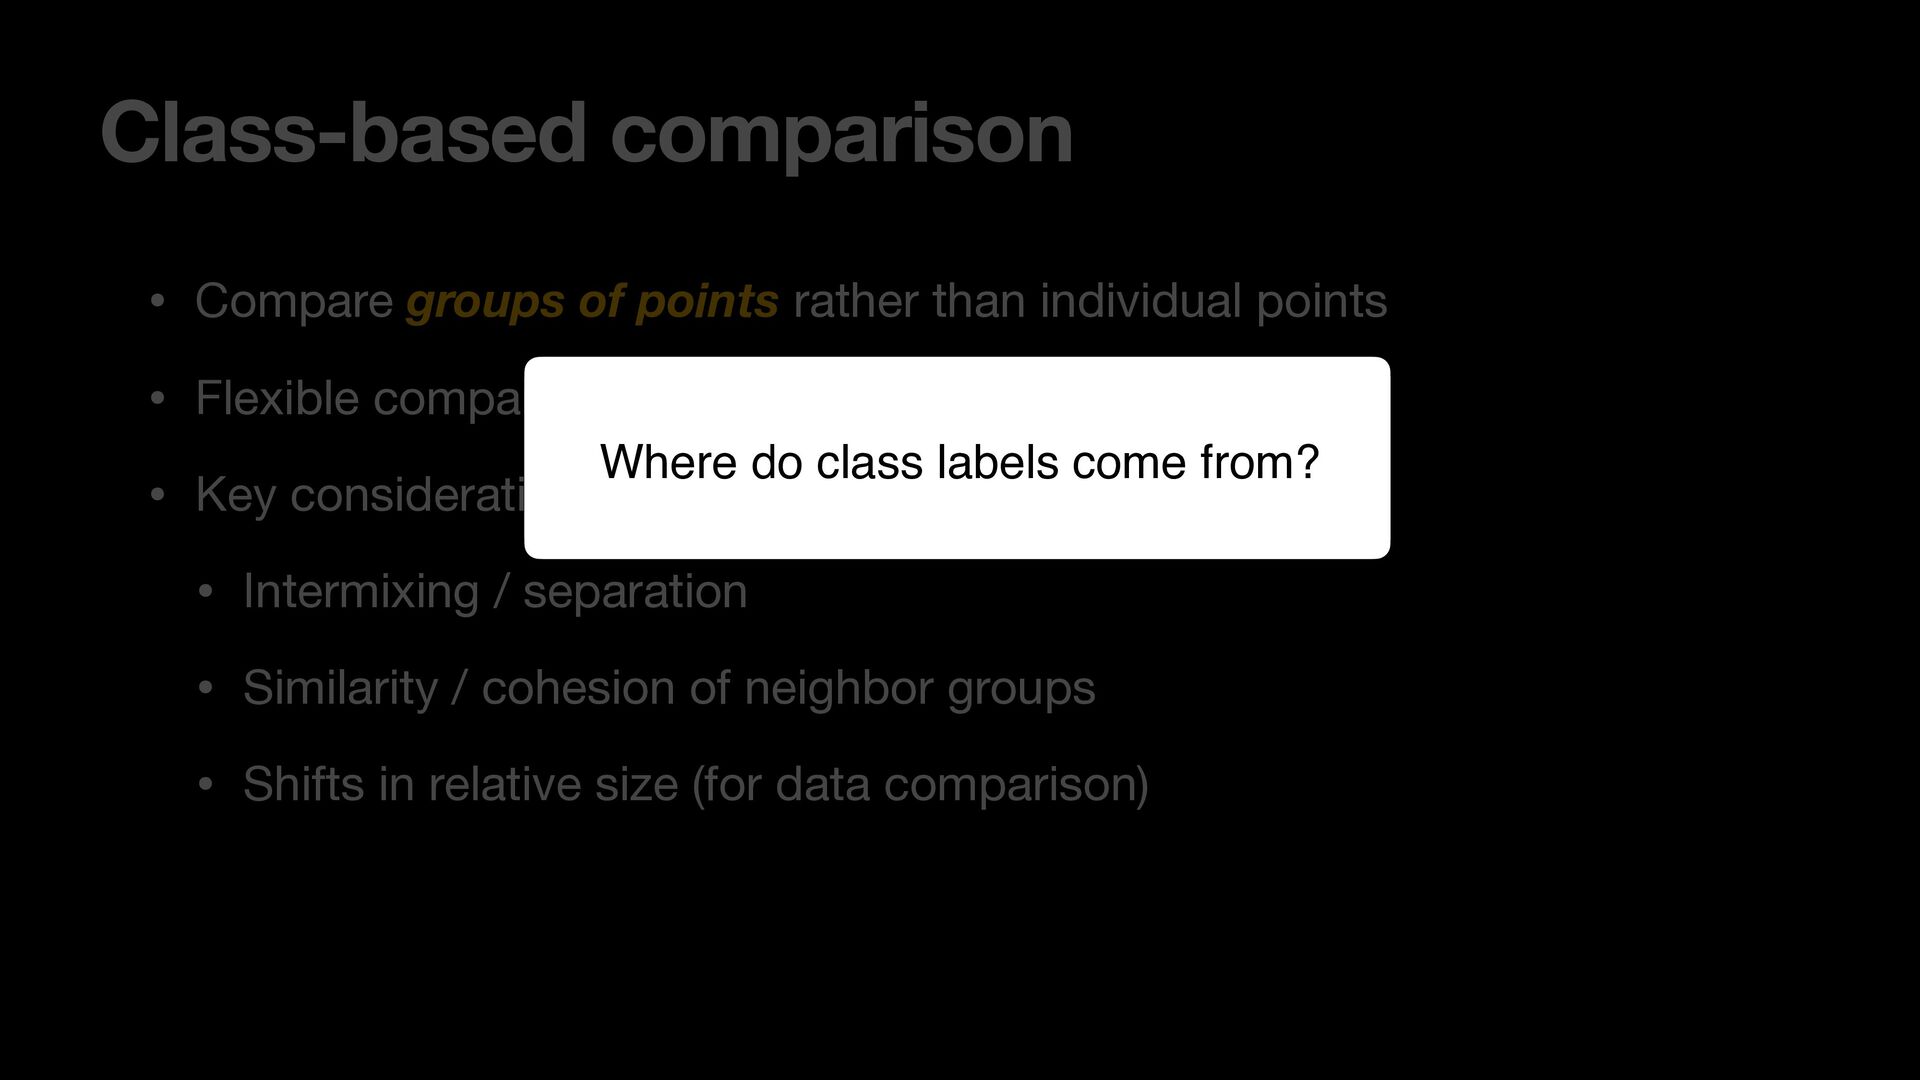
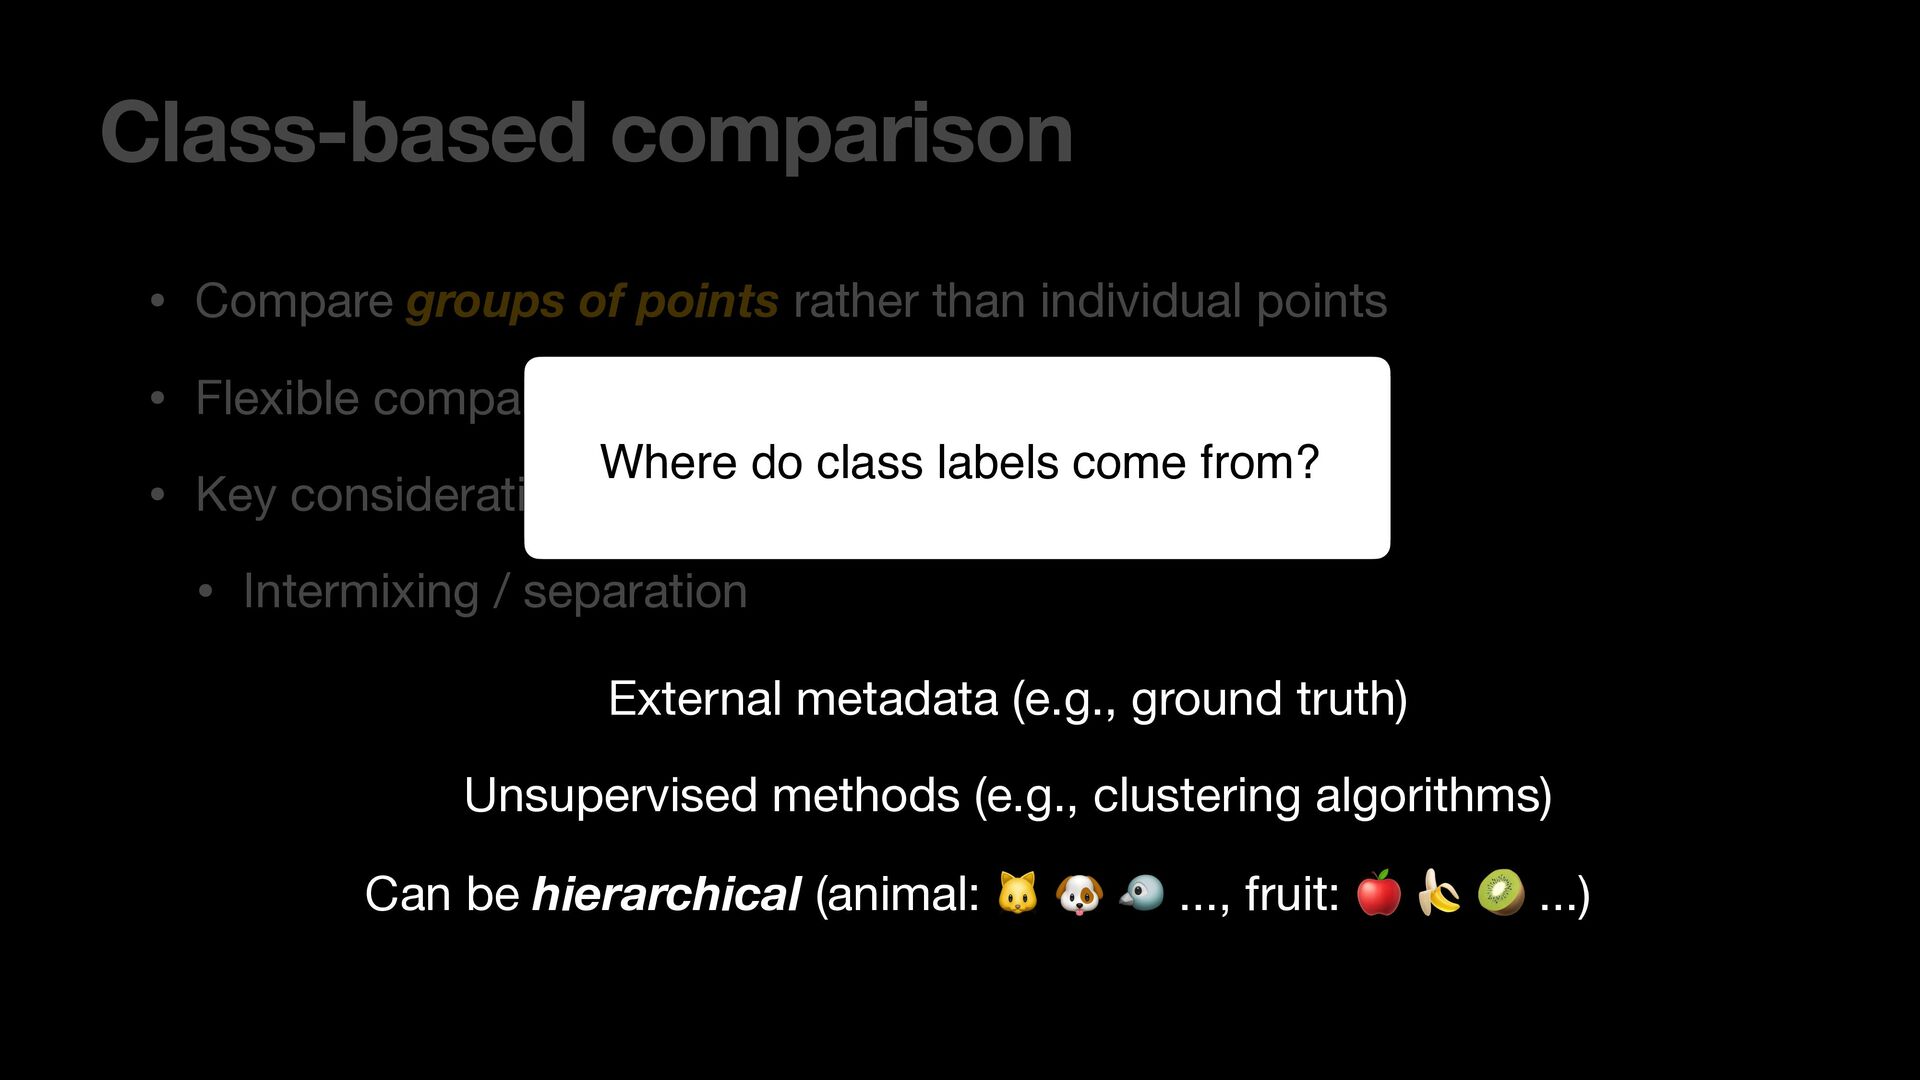
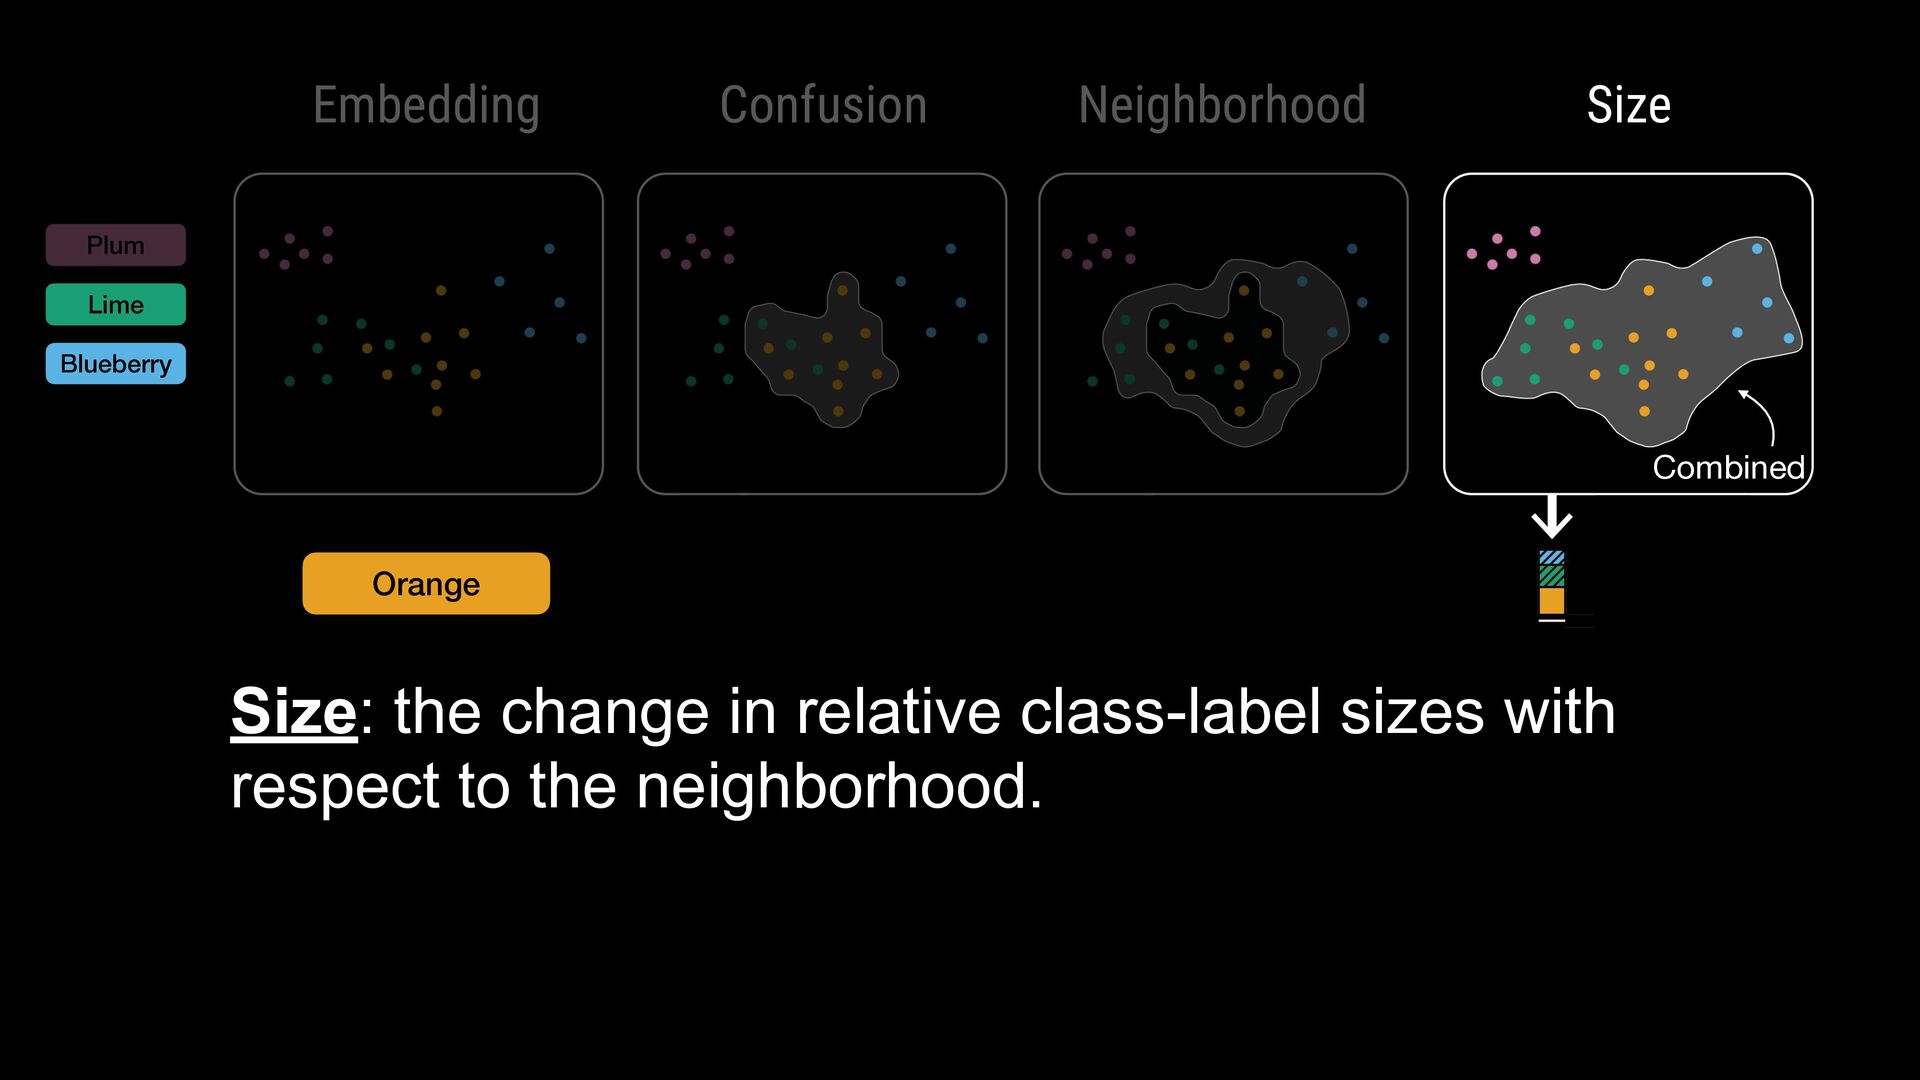
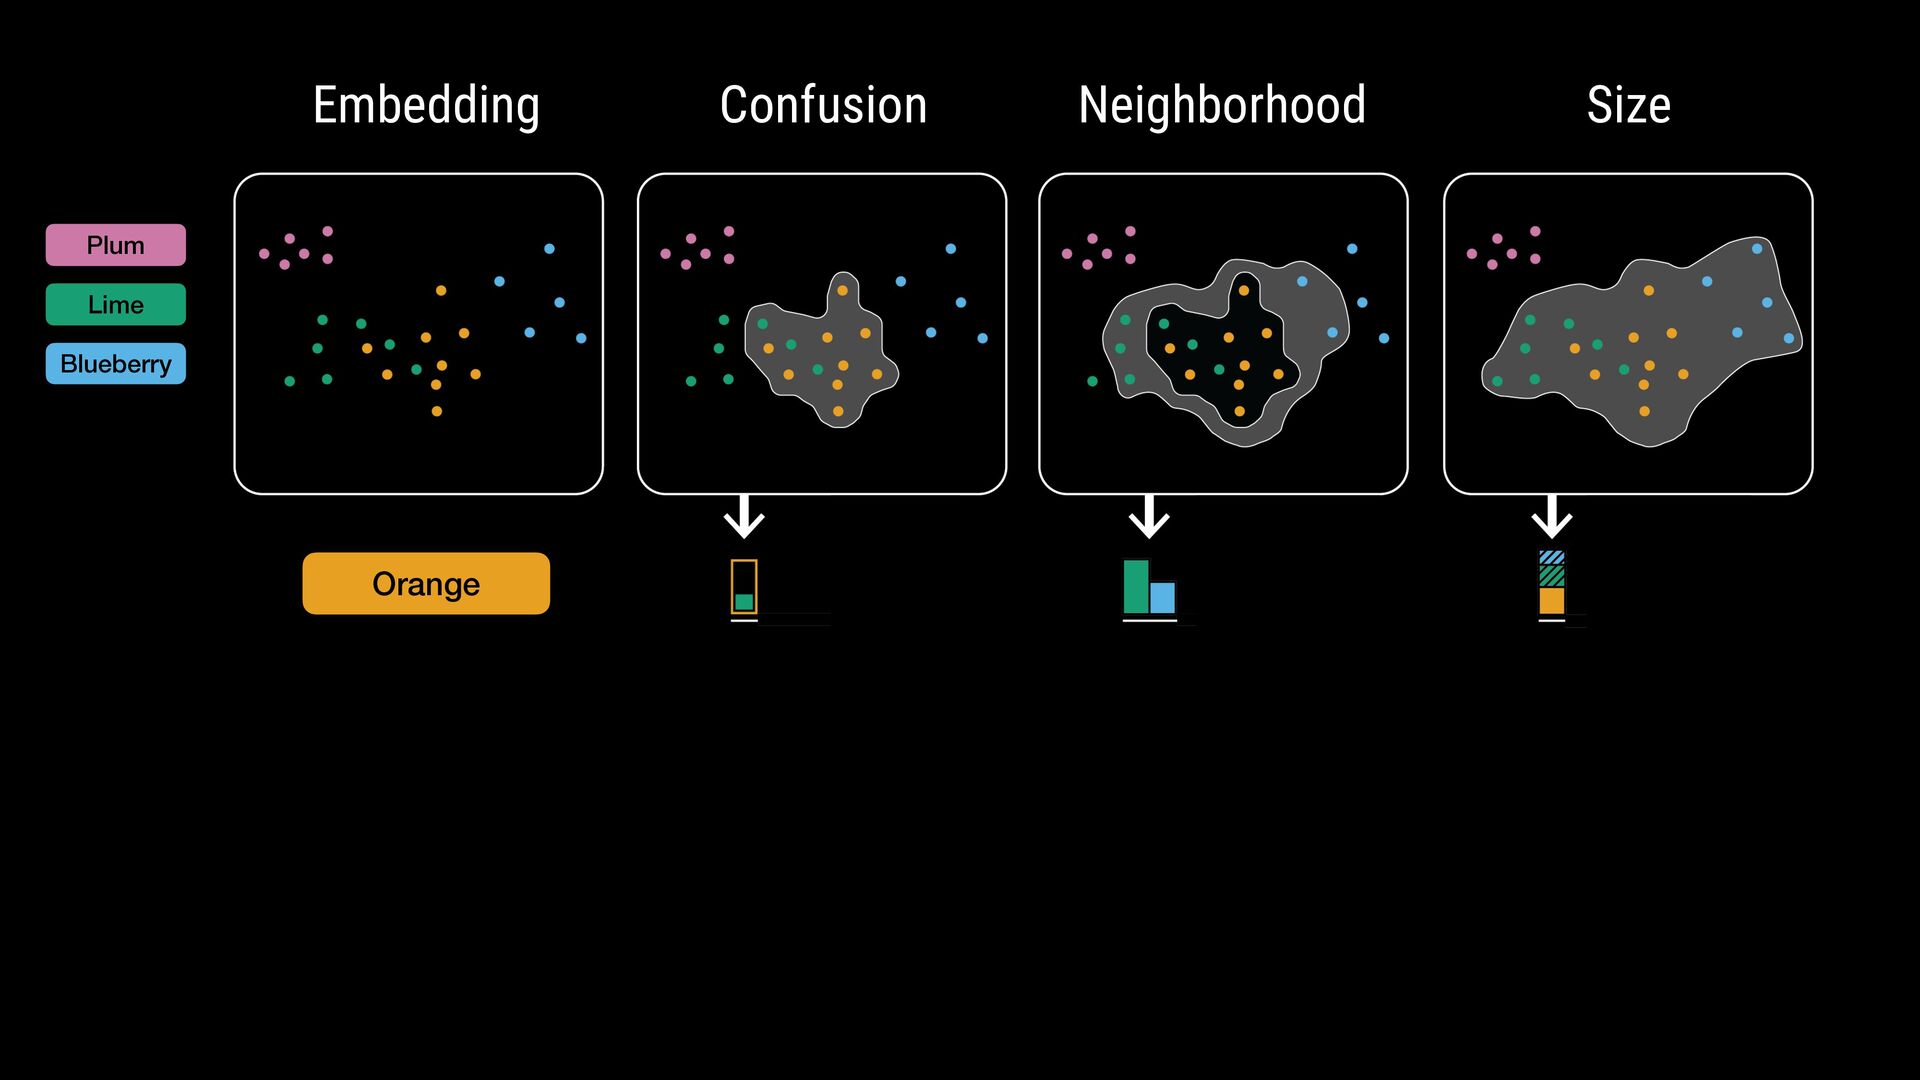
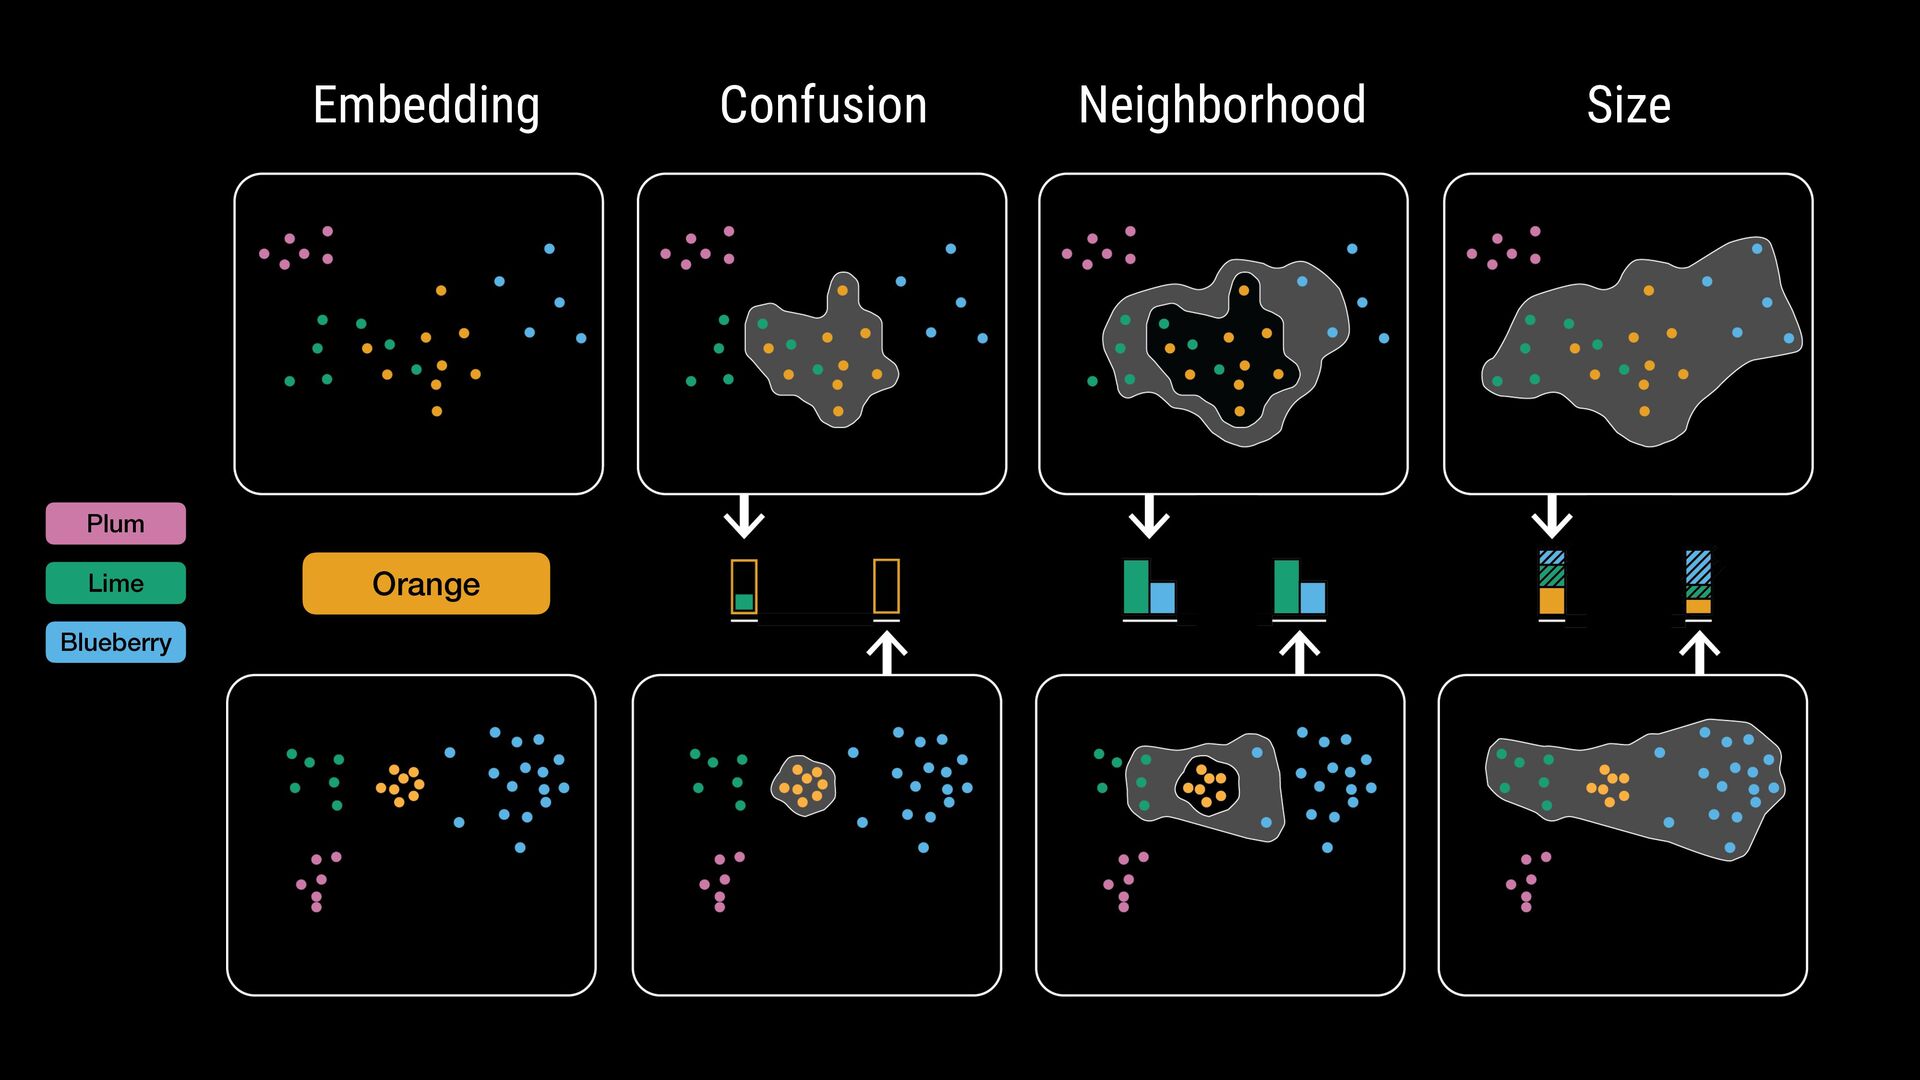
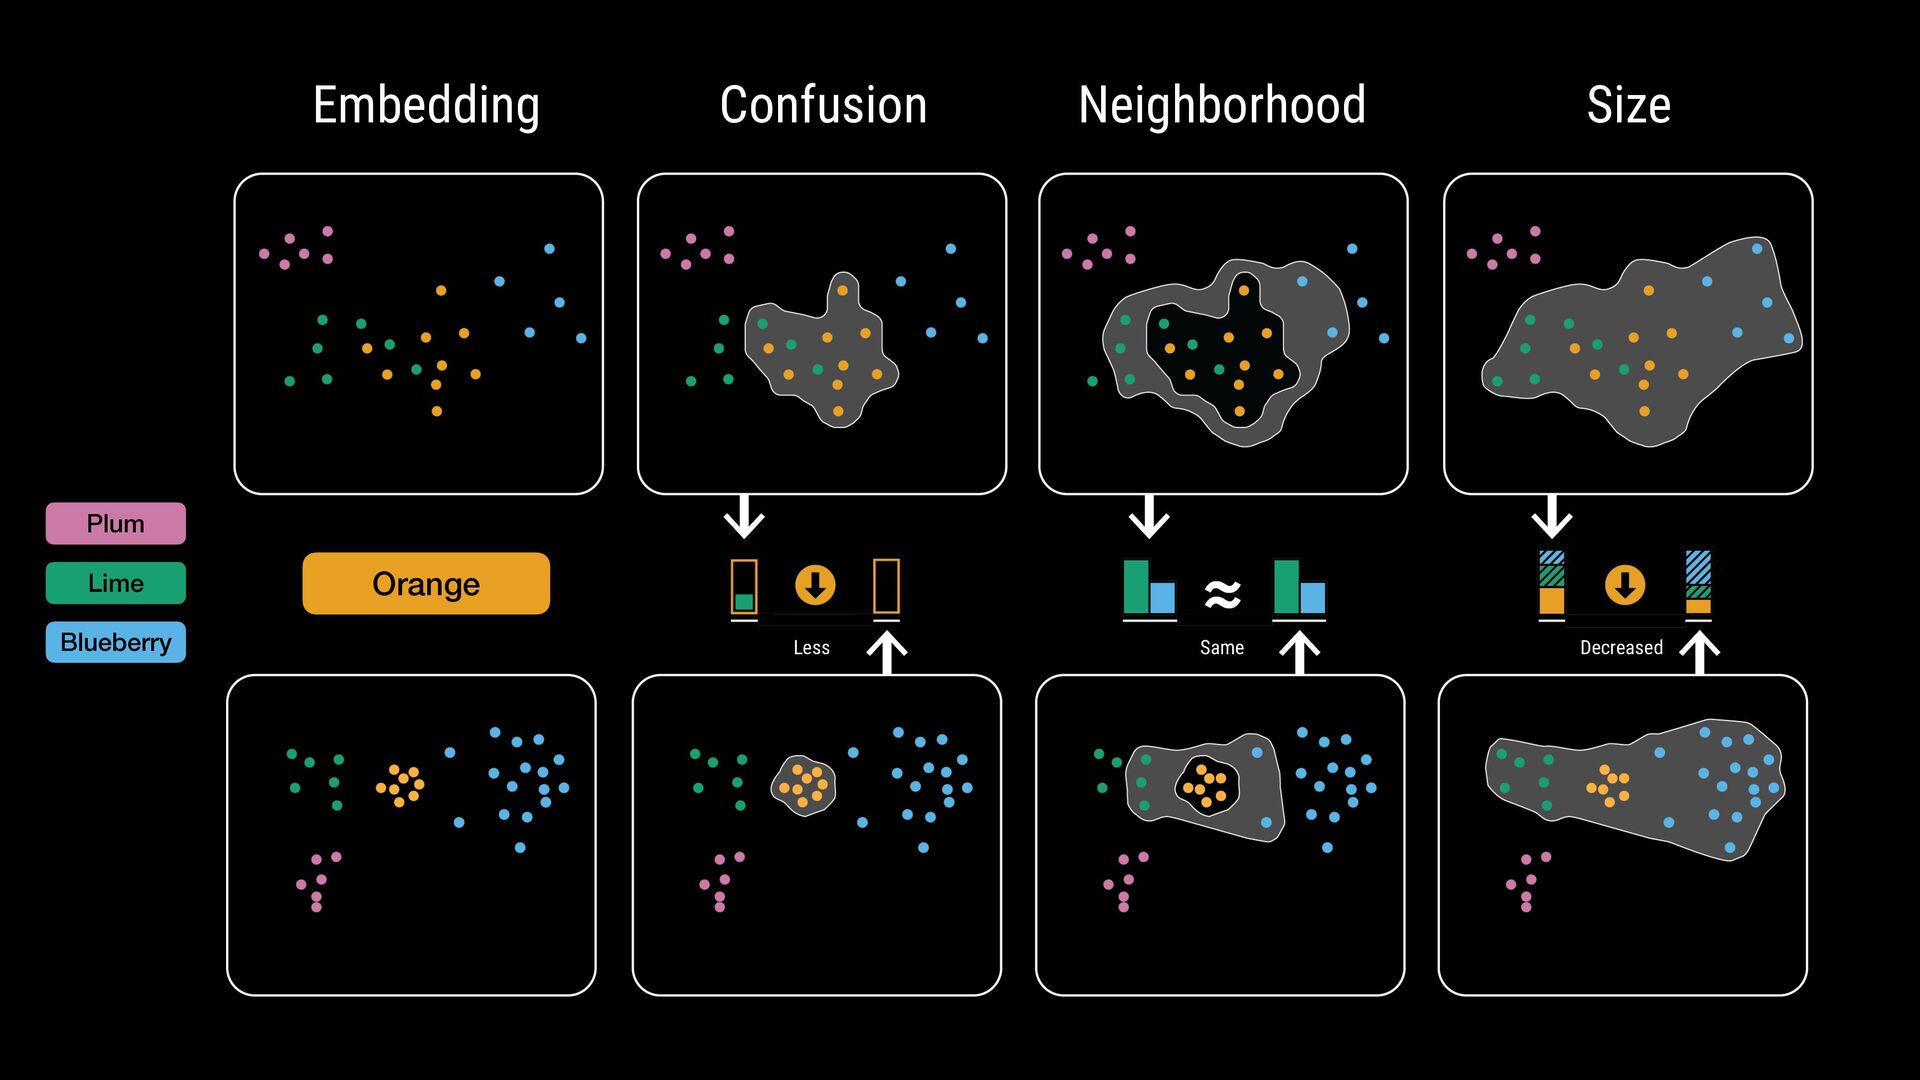
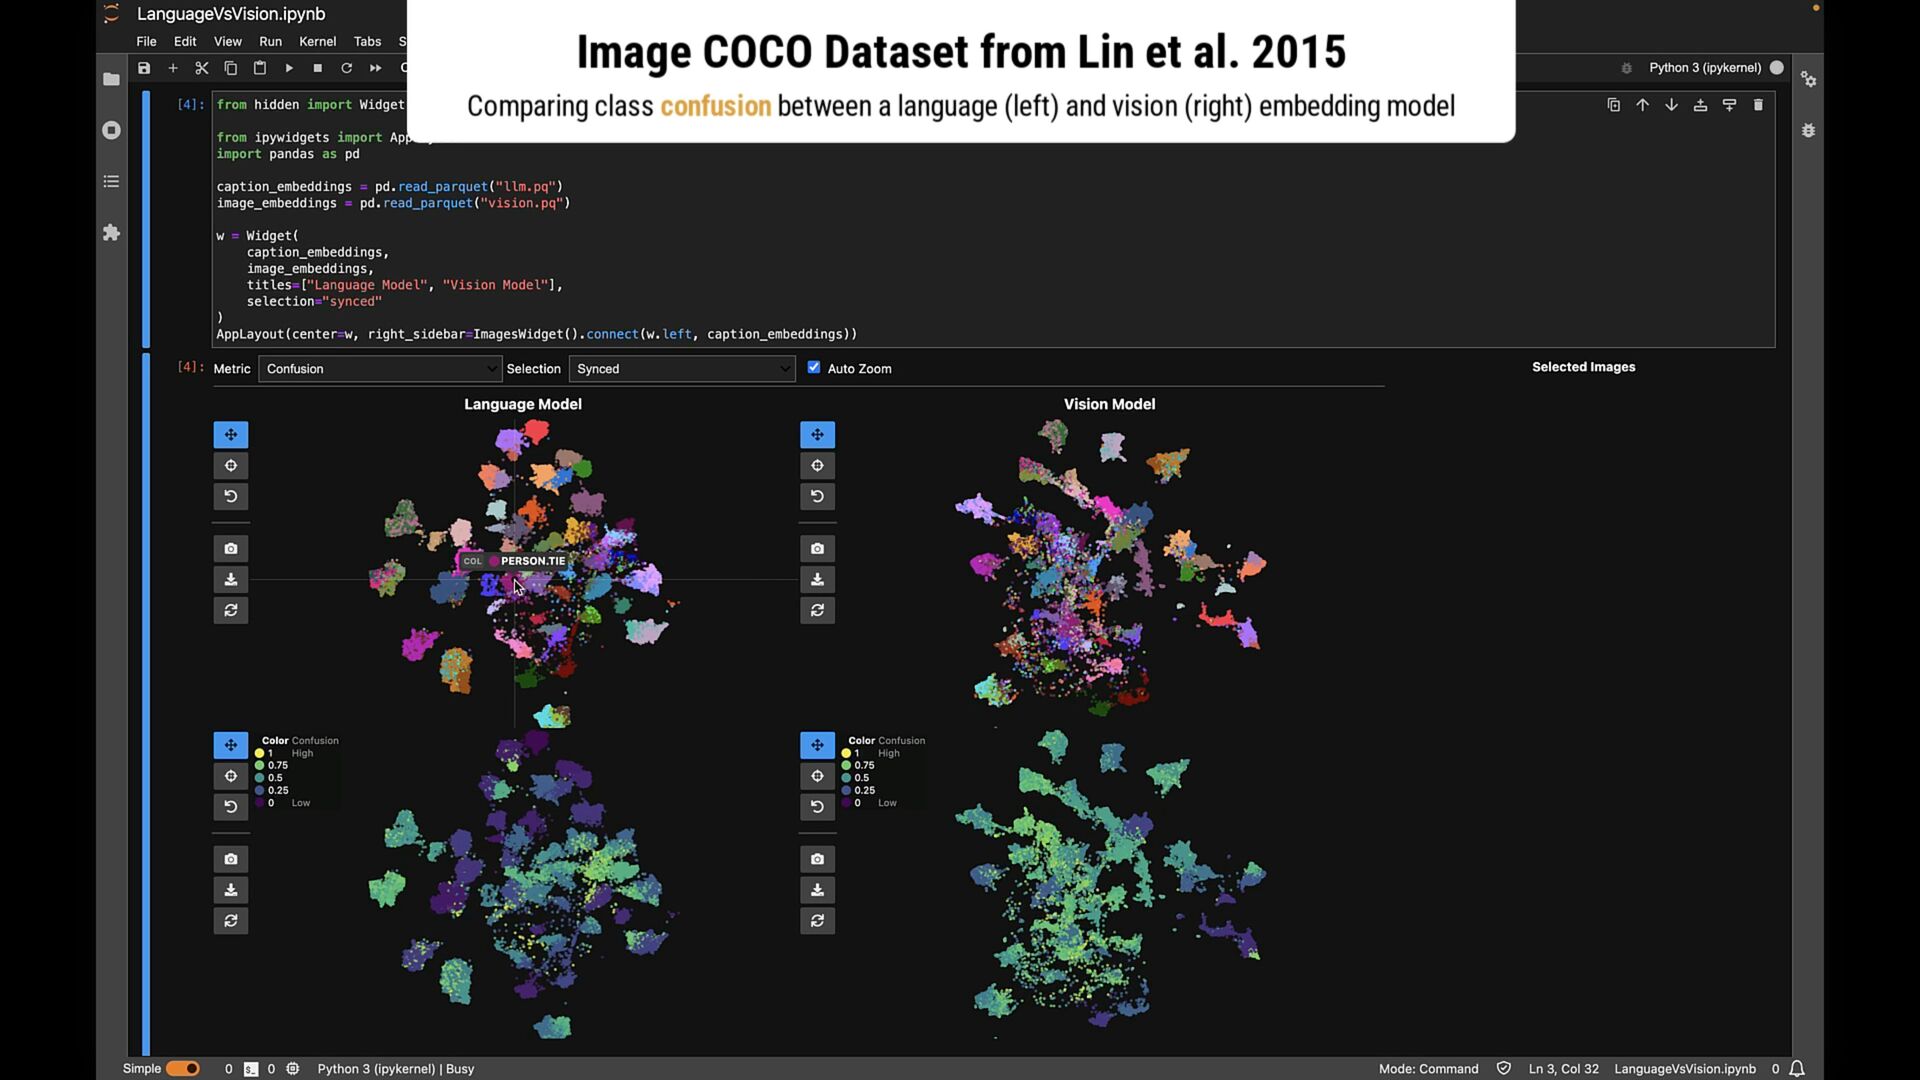
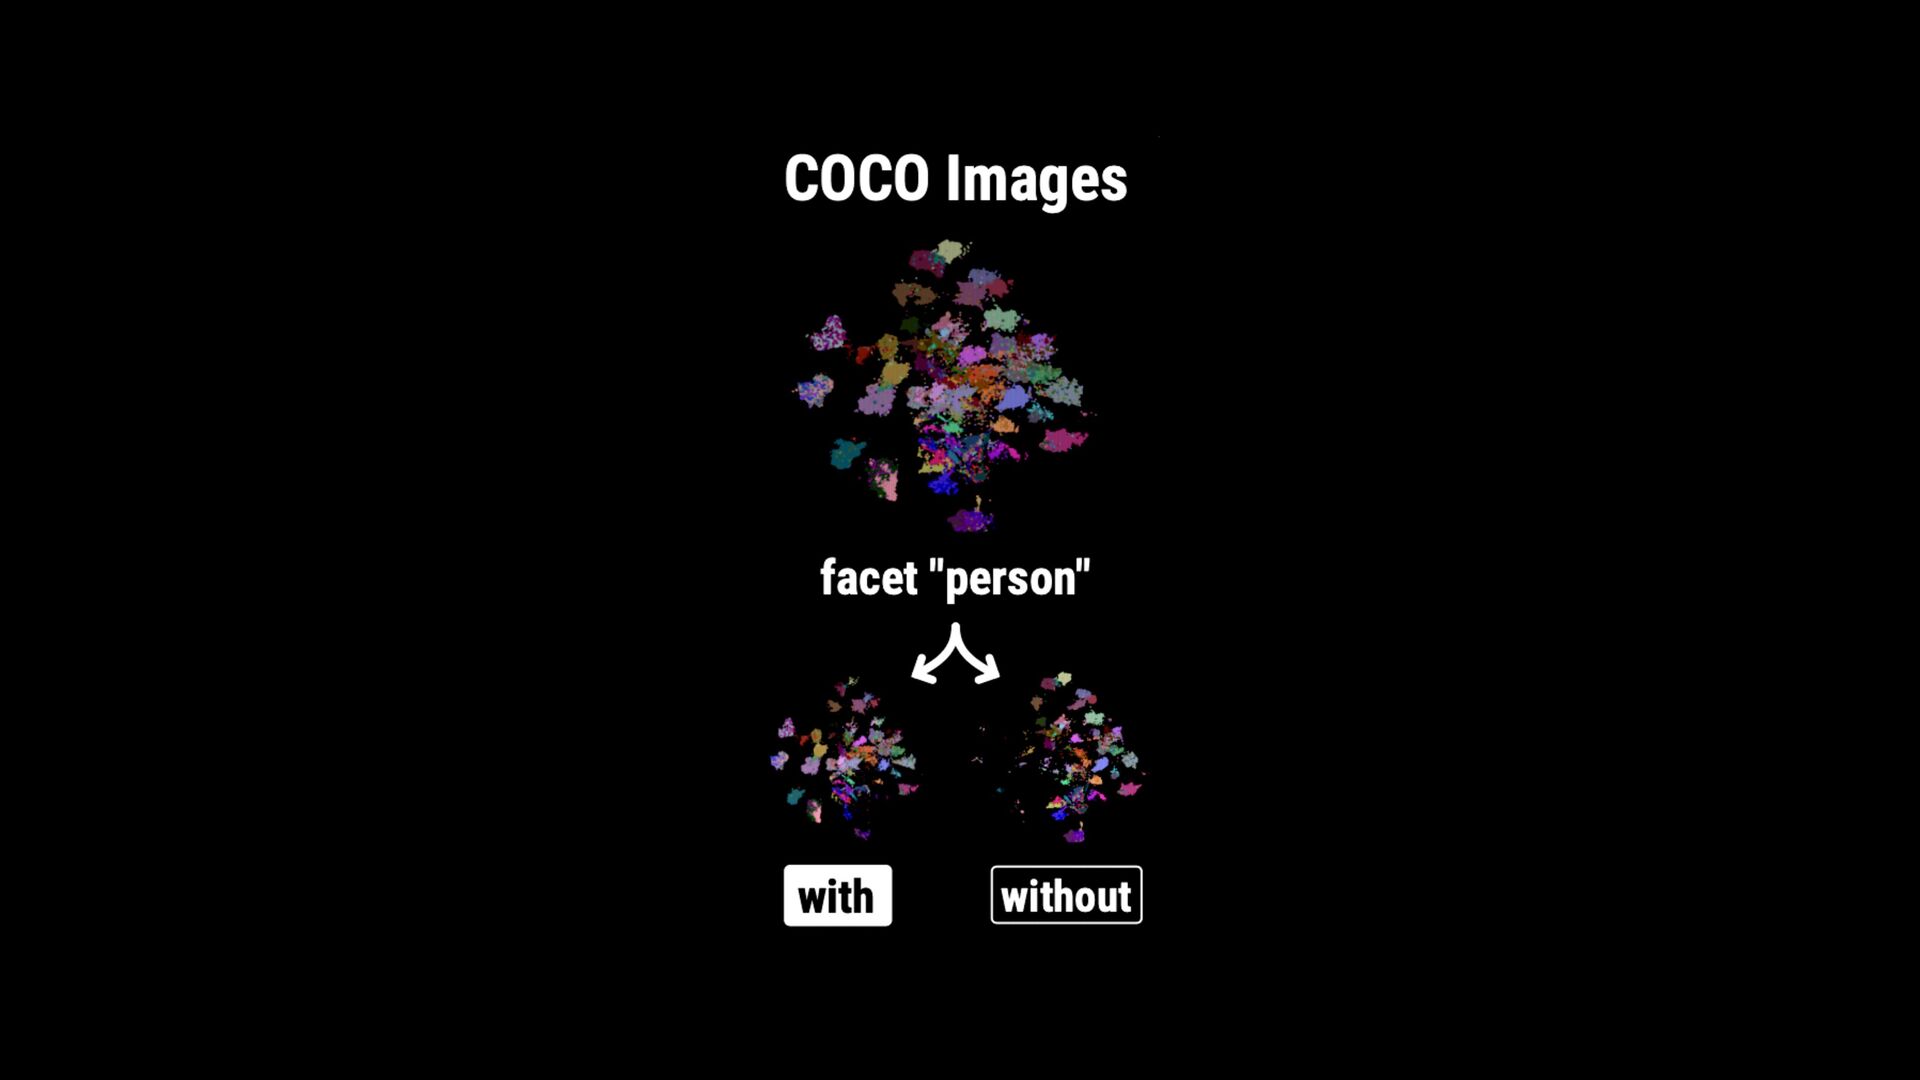
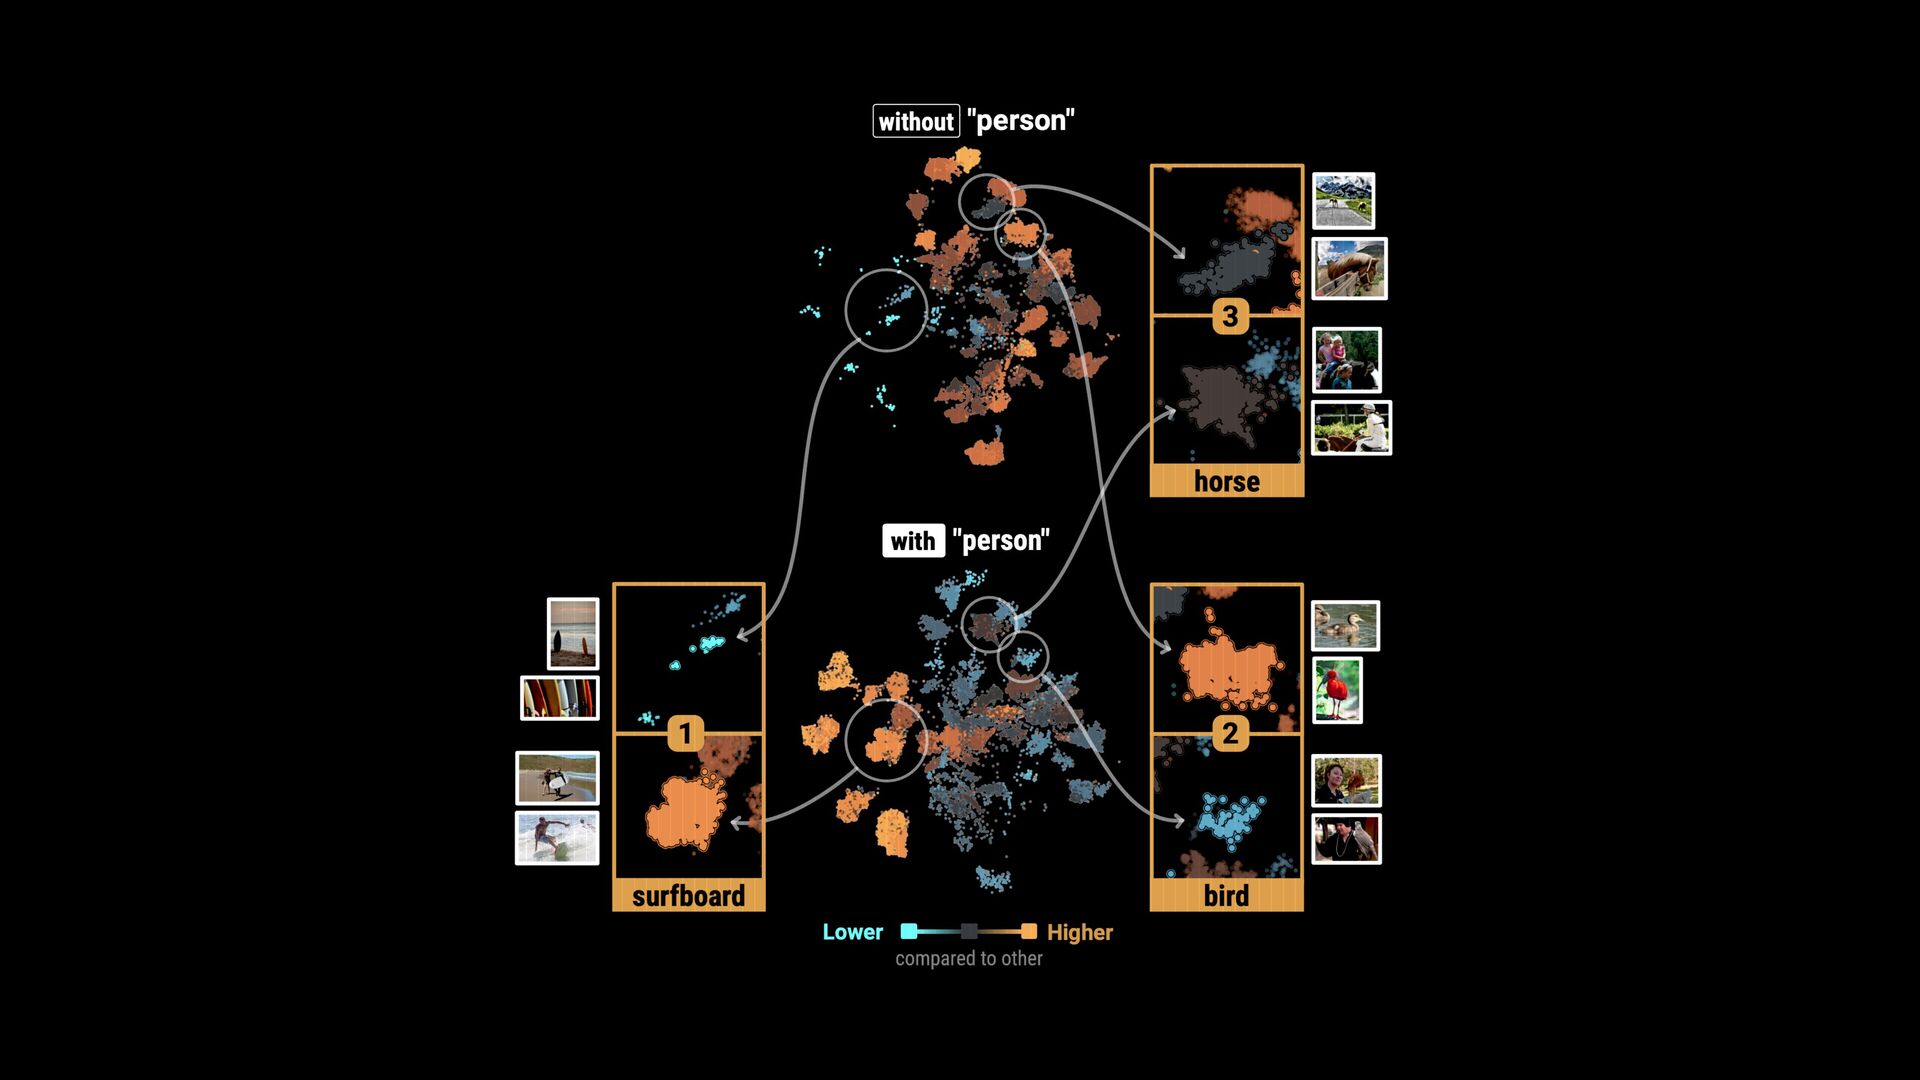
points • Flexible comparisons at various abstraction levels • Key considerations: • Intermixing / separation • Similarity / cohesion of neighbor groups • Shifts in relative size (for data comparison) \ Where do class labels come from?
points • Flexible comparisons at various abstraction levels • Key considerations: • Intermixing / separation • Similarity / cohesion of neighbor groups • Shifts in relative size (for data comparison) \ Where do class labels come from? External metadata (e.g., ground truth) Unsupervised methods (e.g., clustering algorithms) Can be hierarchical (animal: # $ % ..., fruit: & ' ( ...)
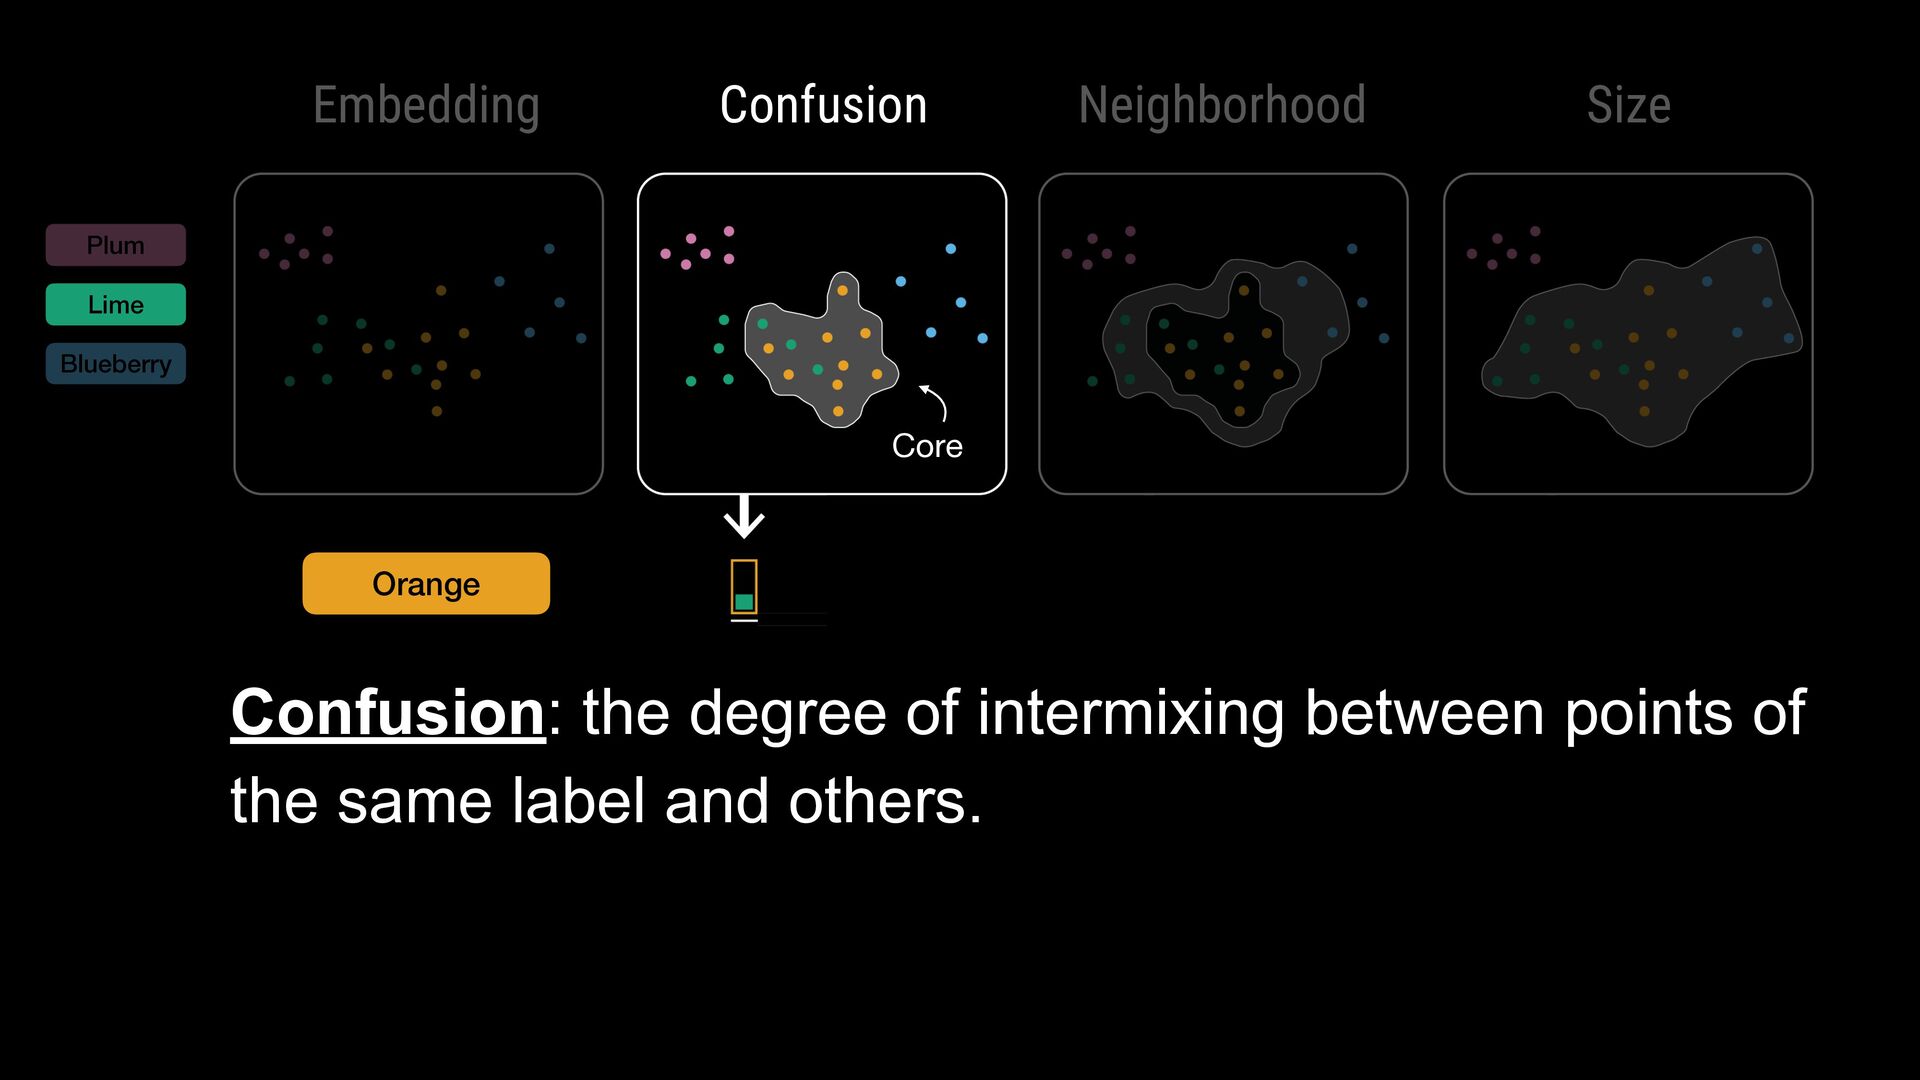
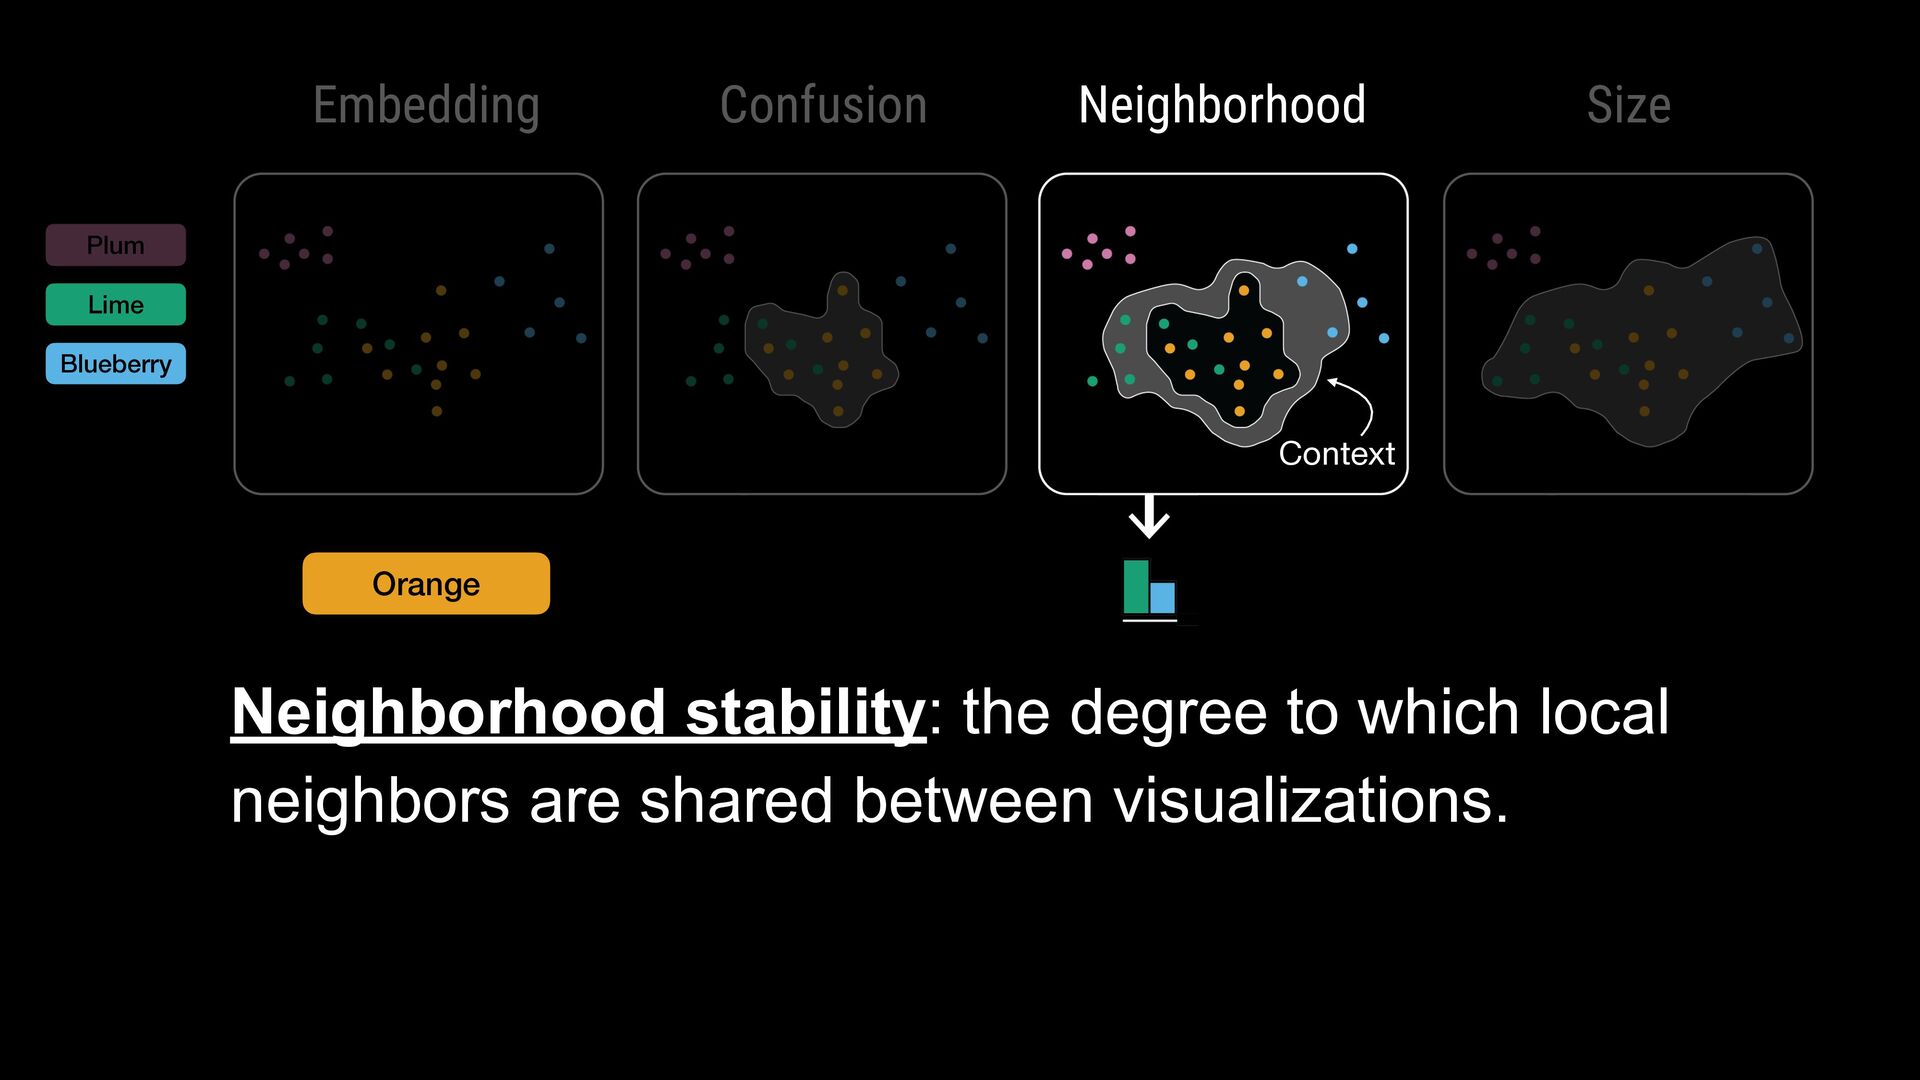
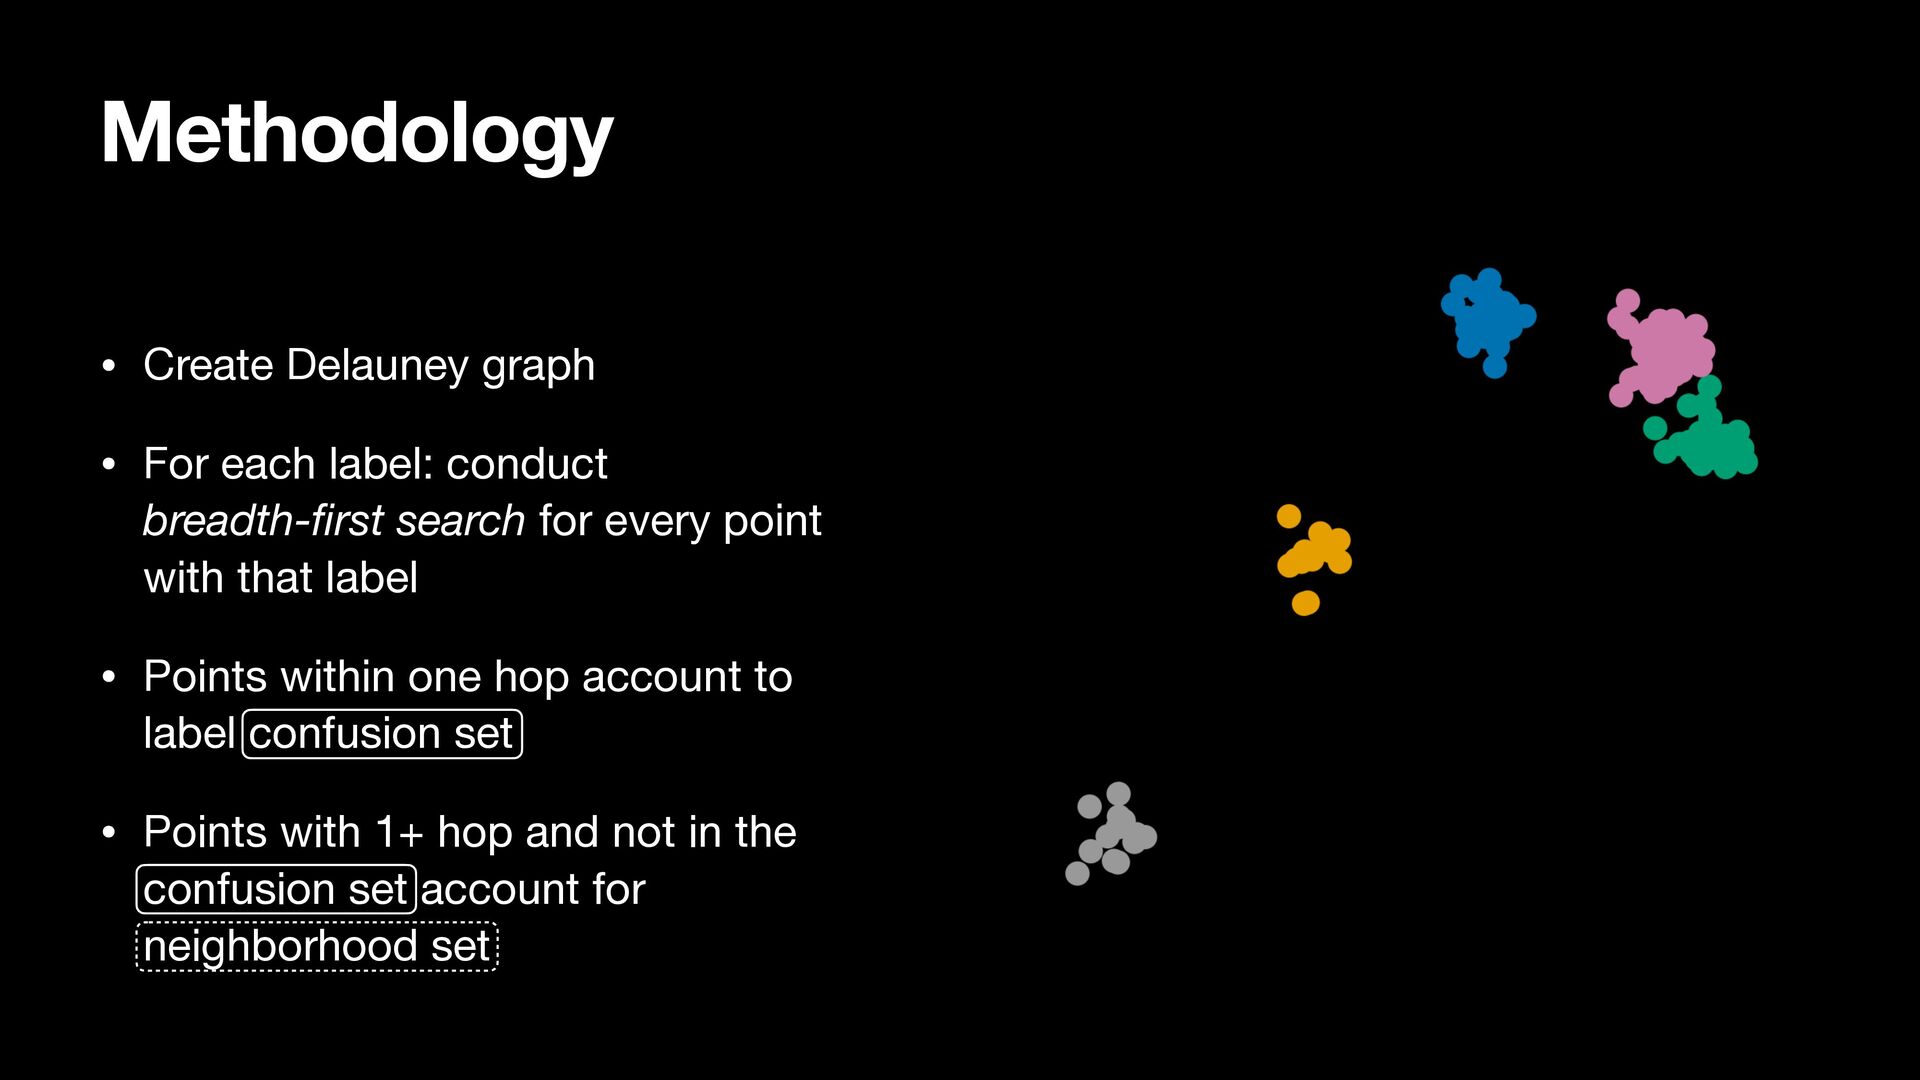
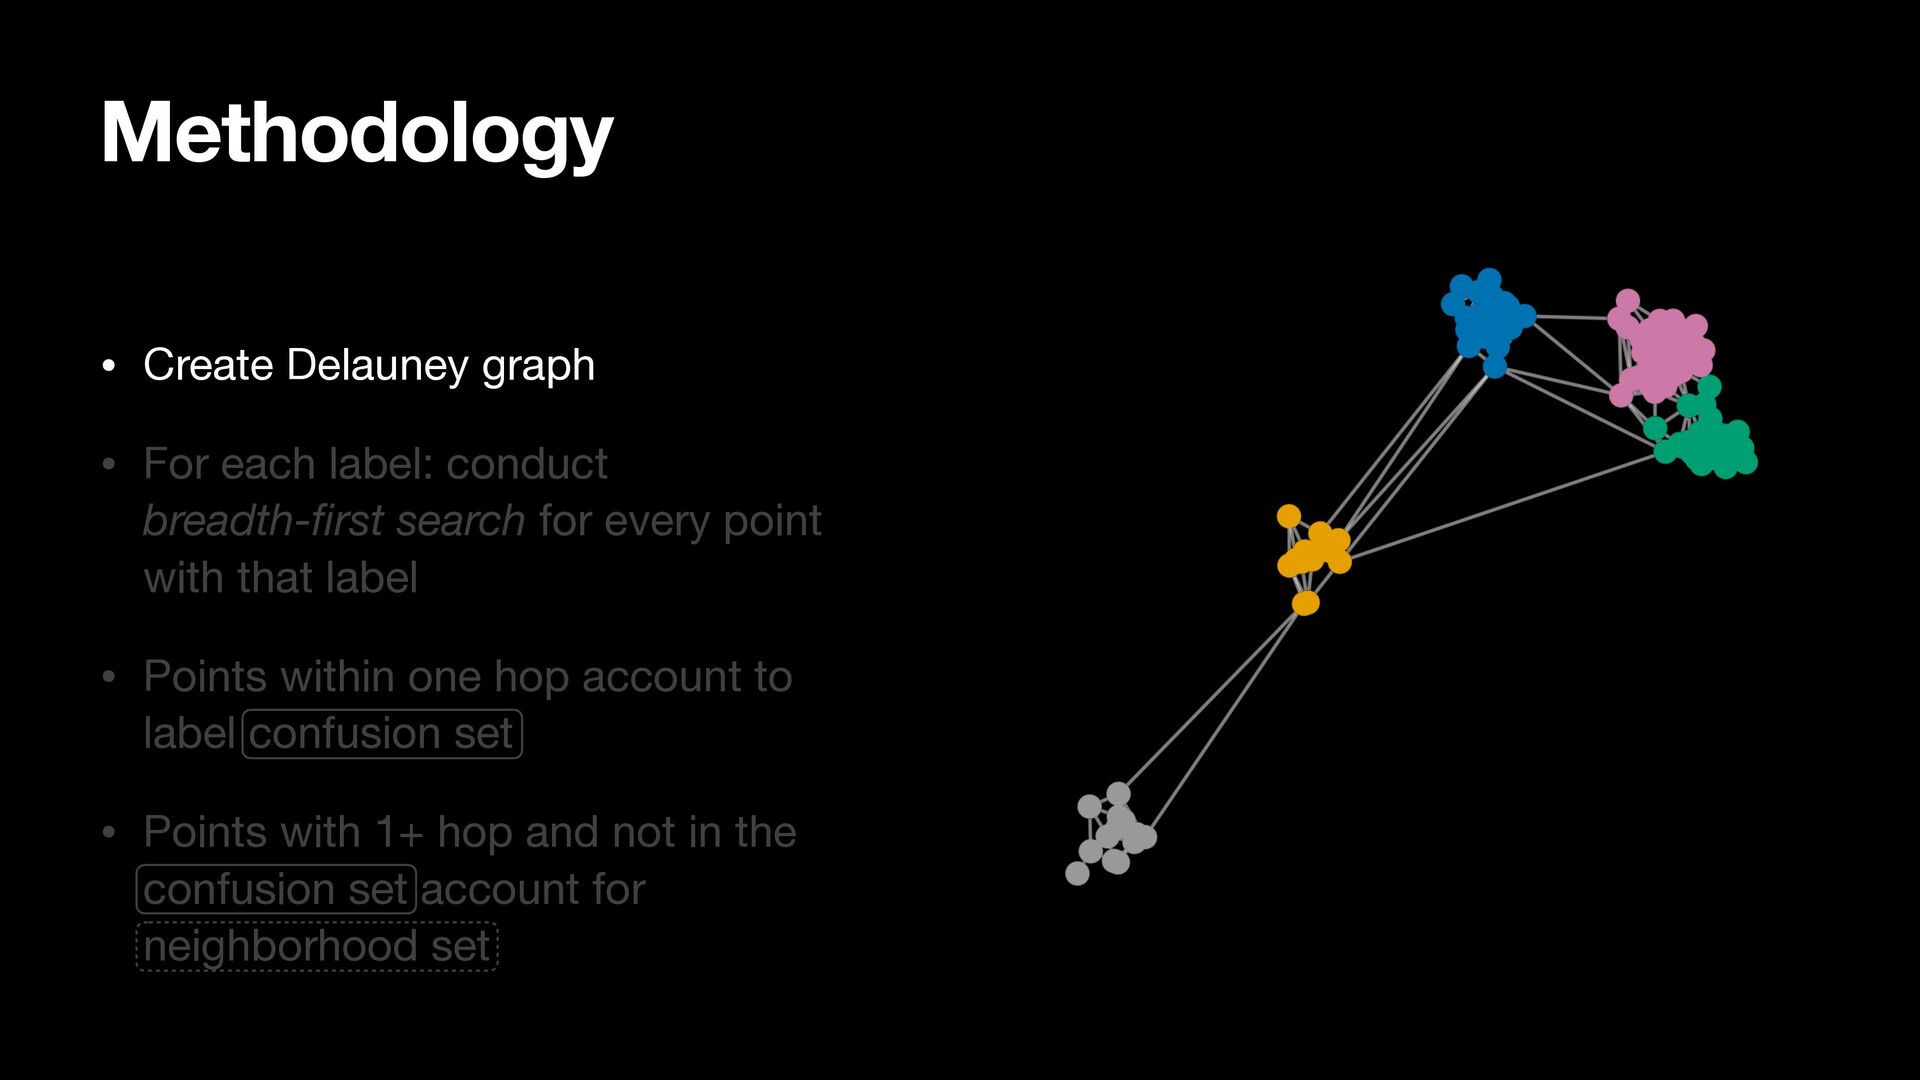
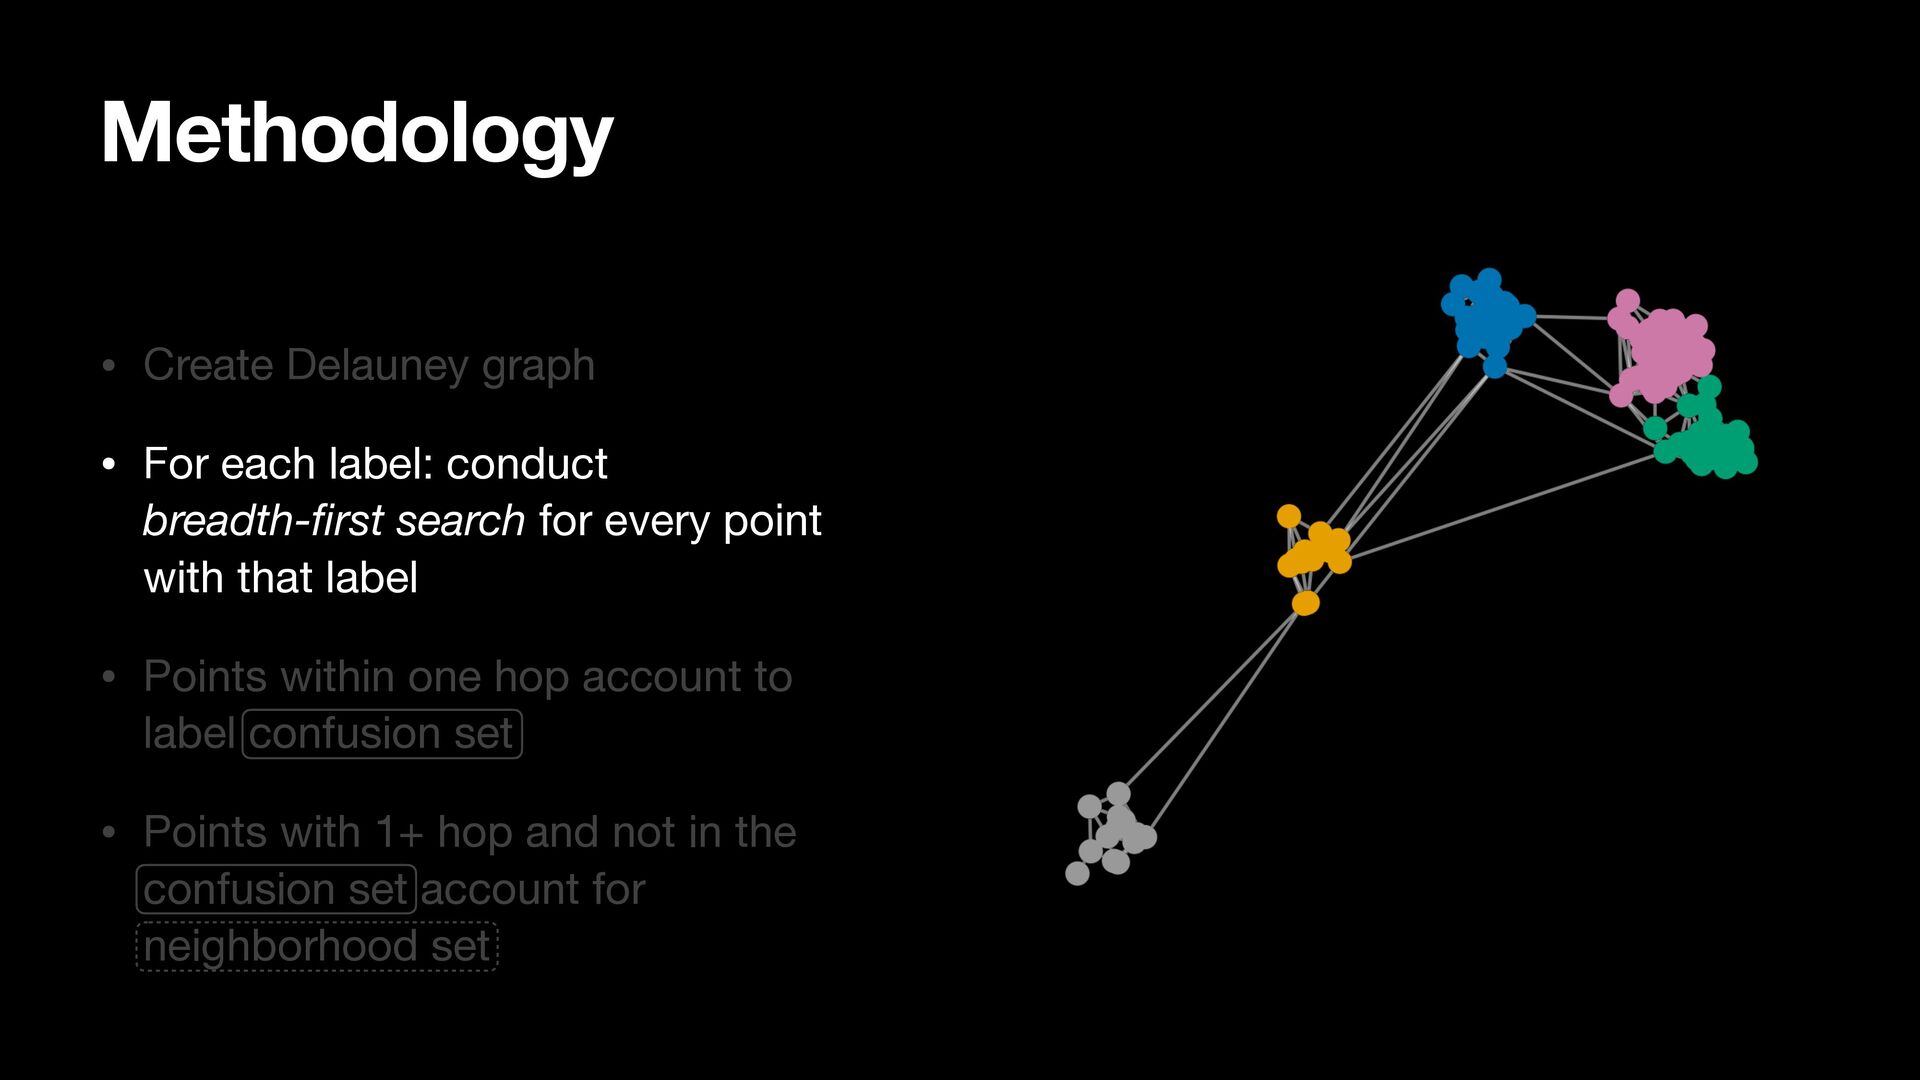
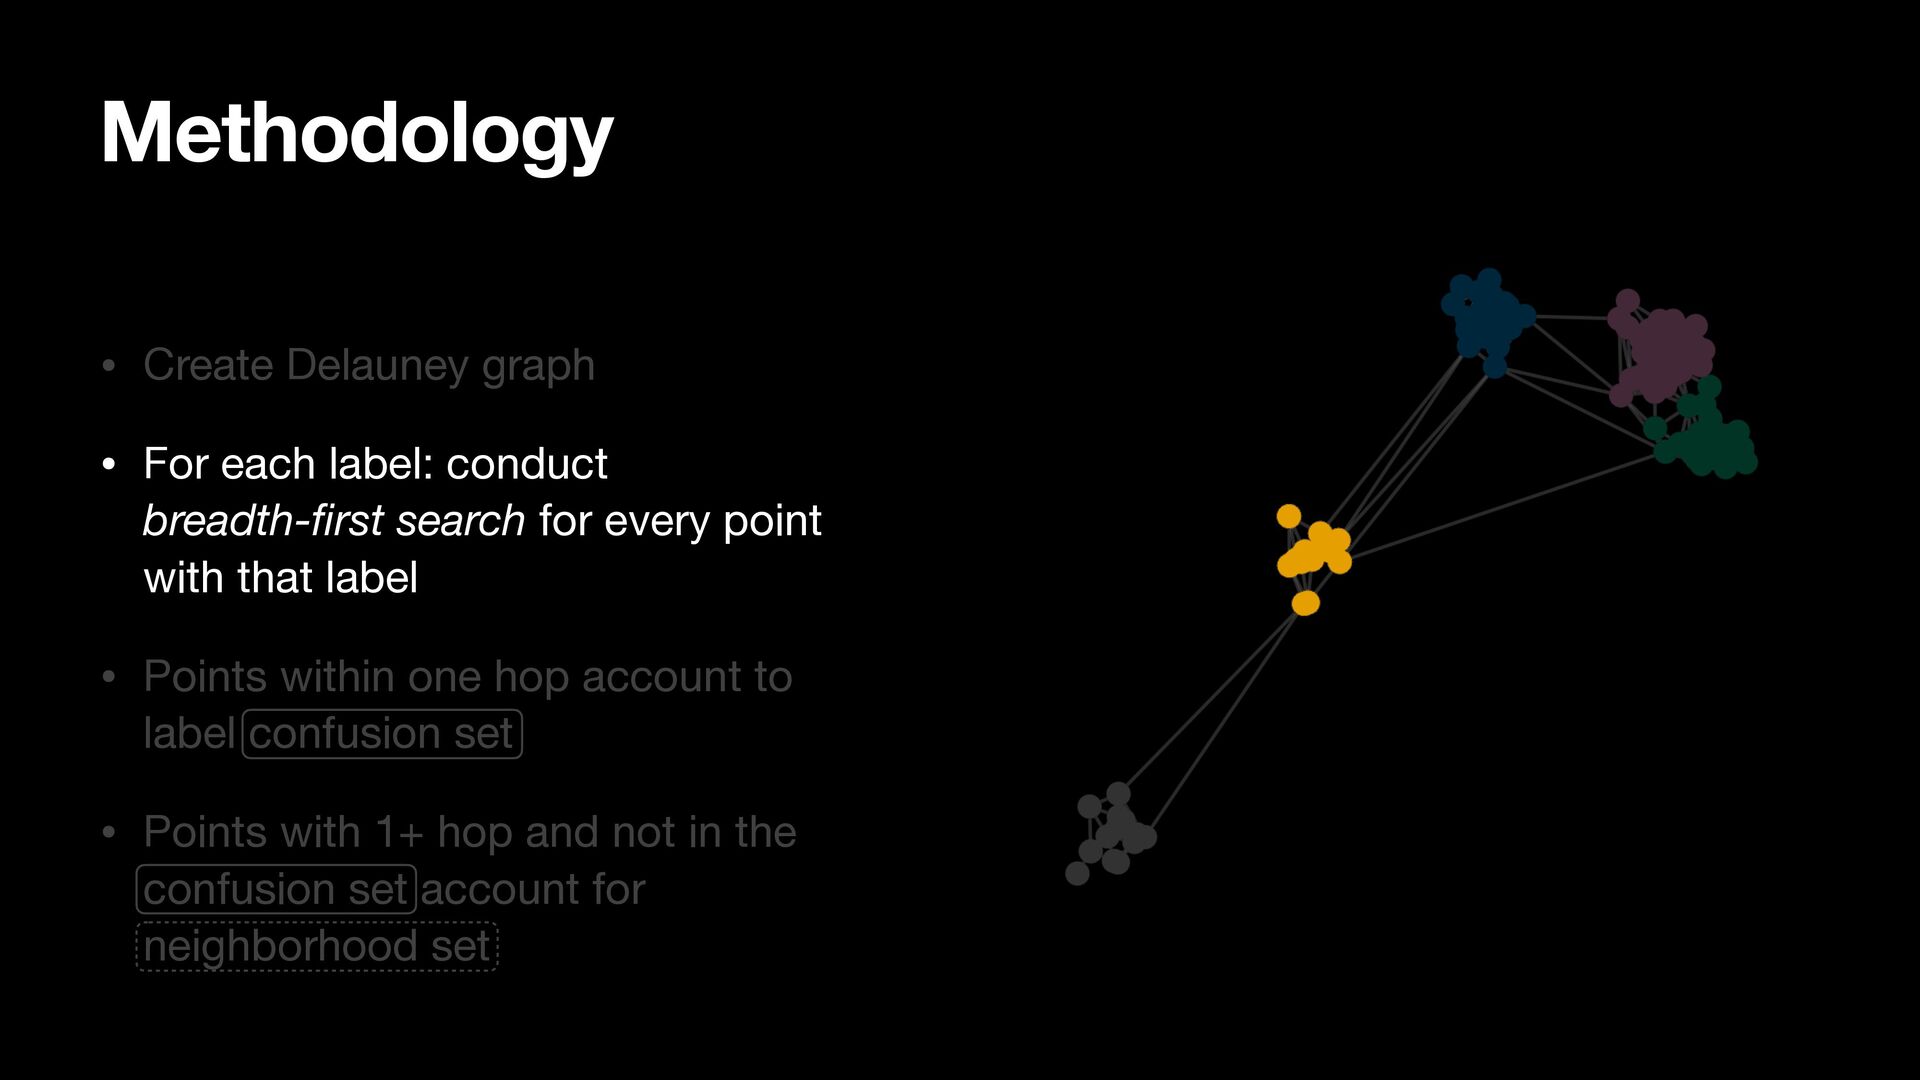
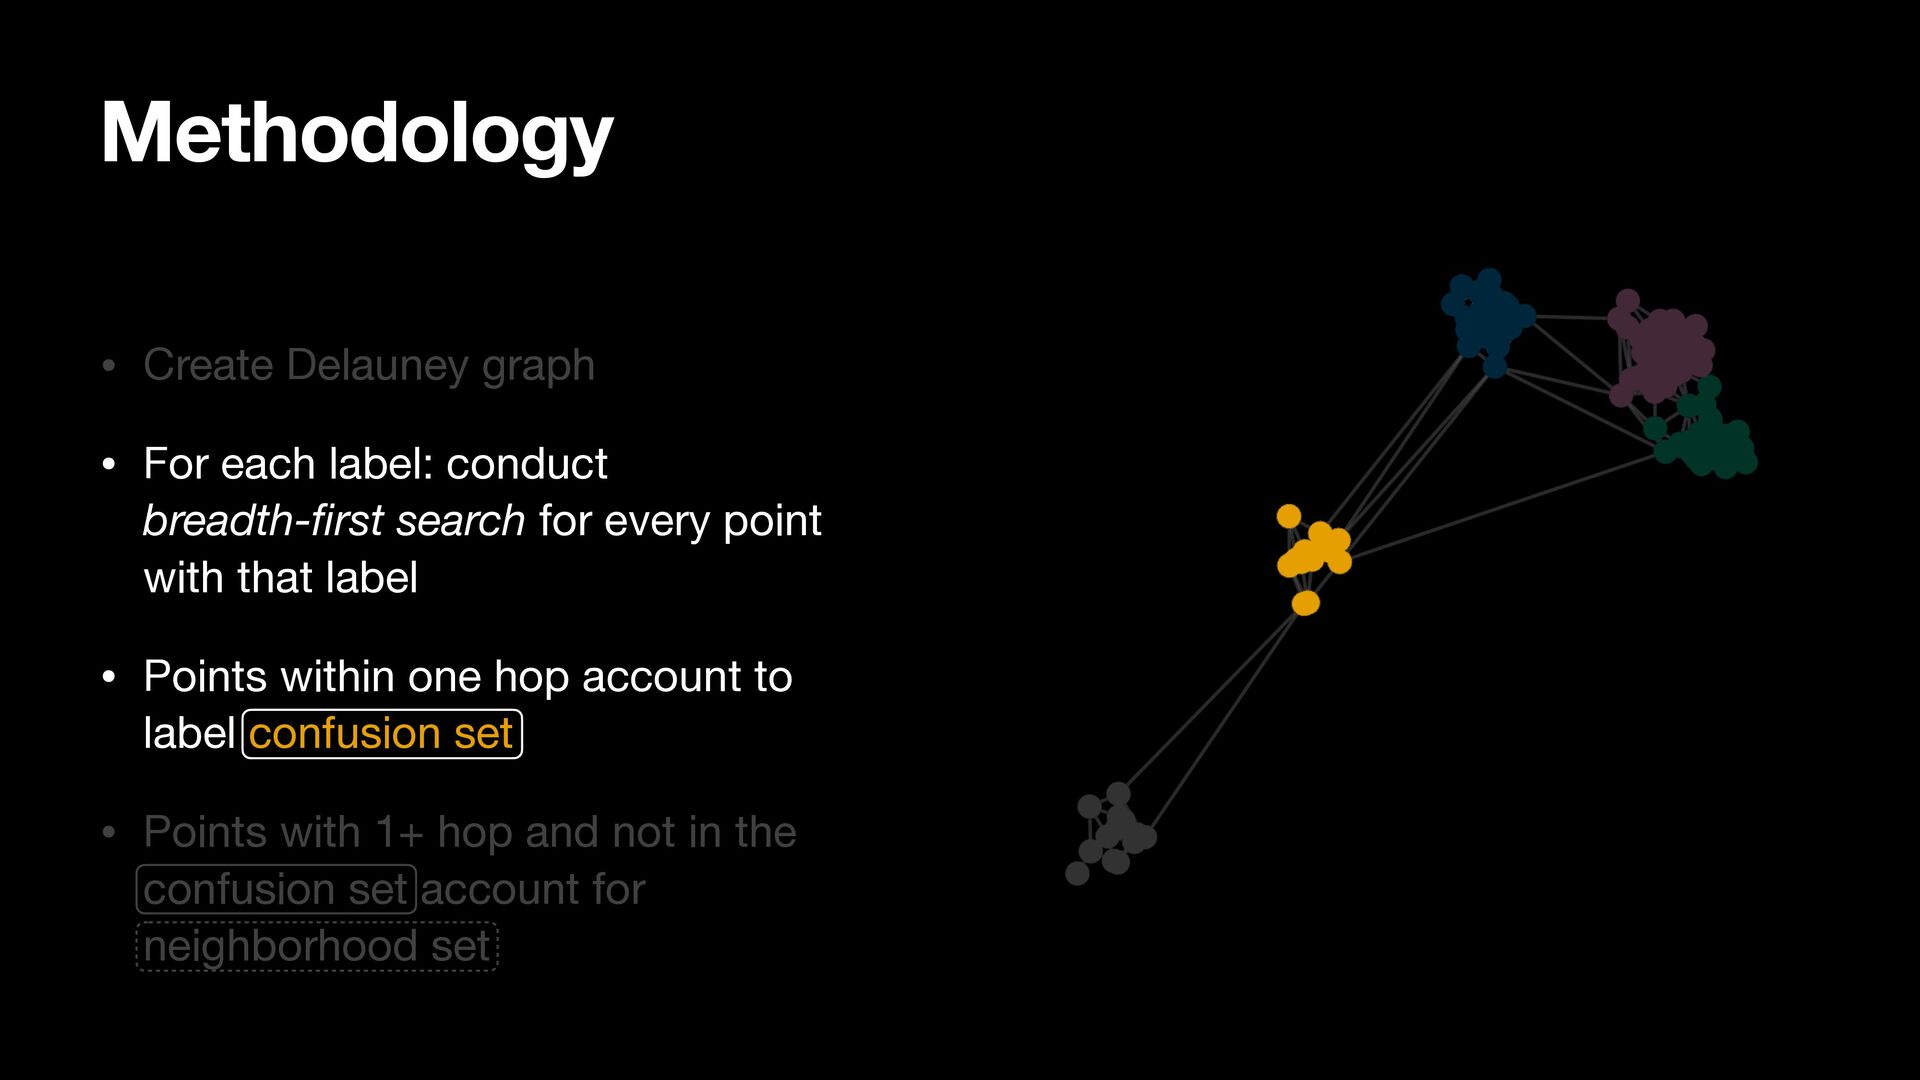
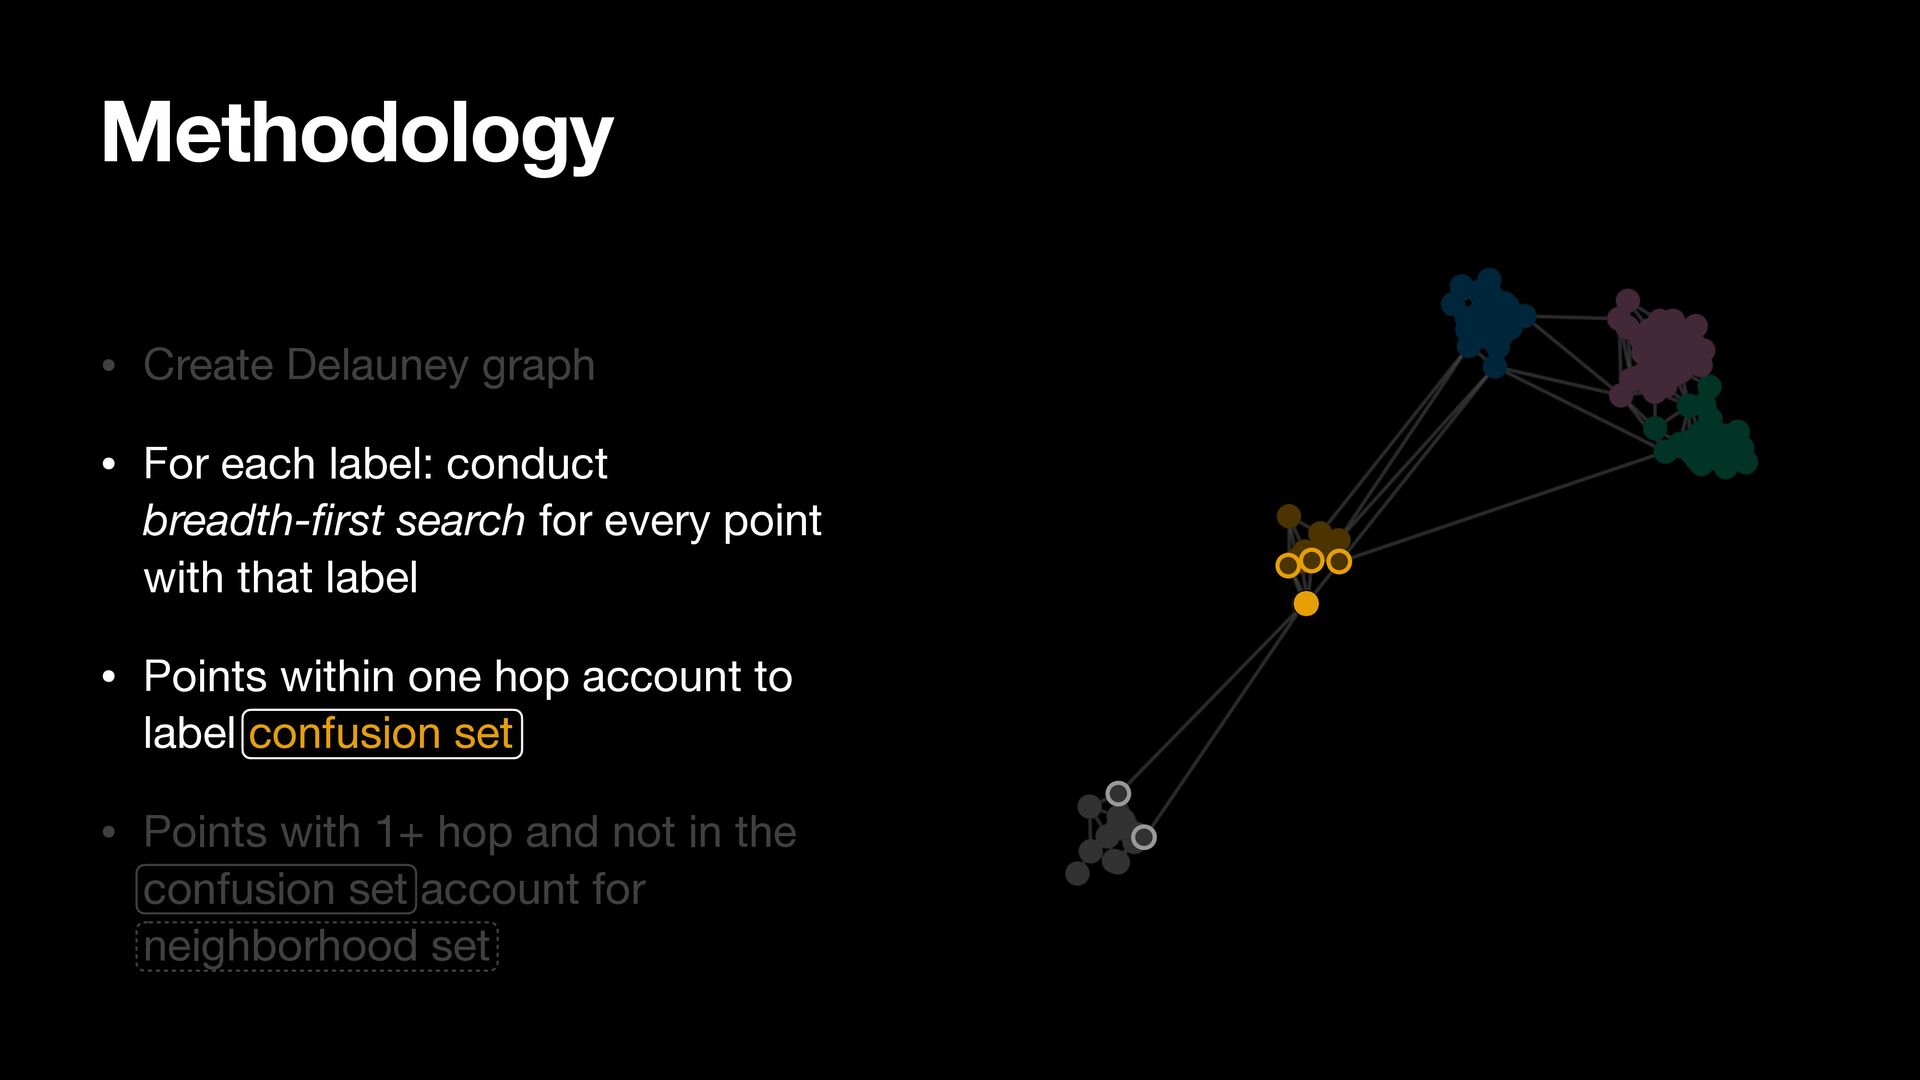
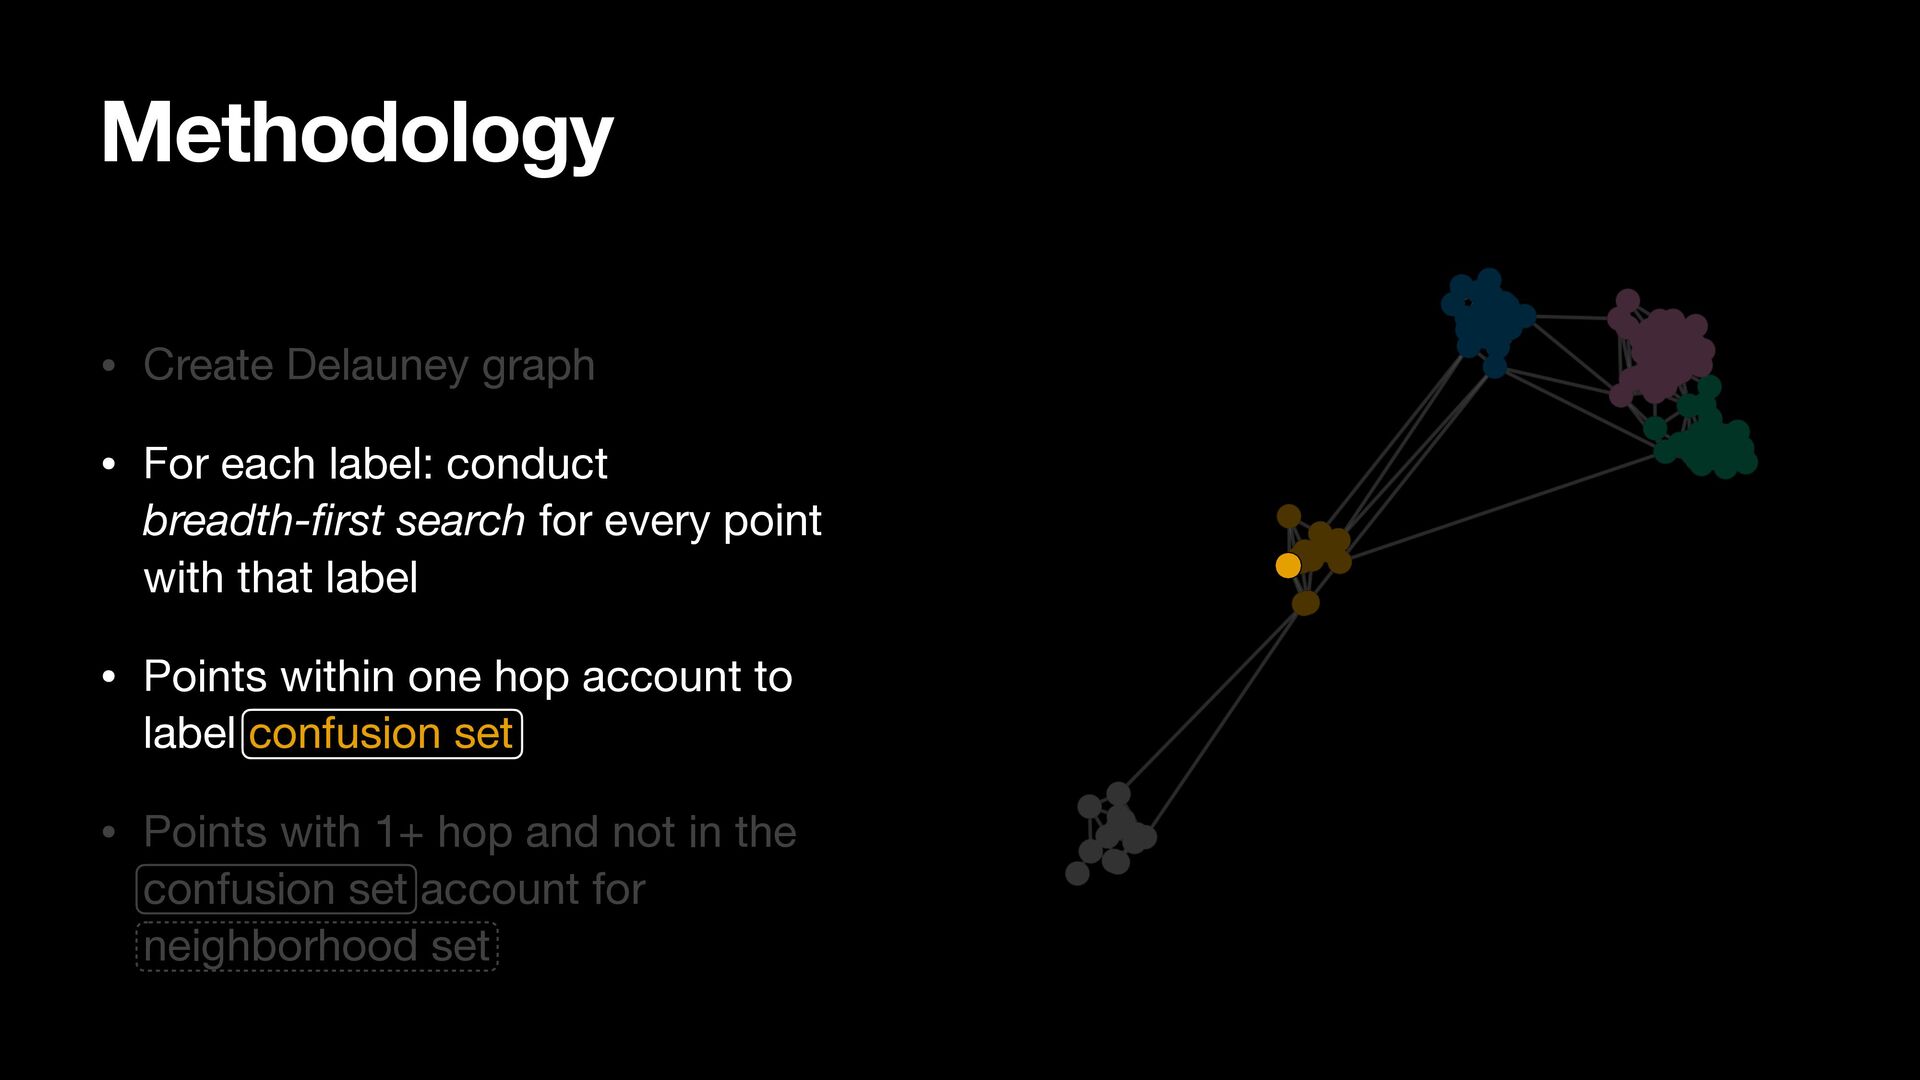
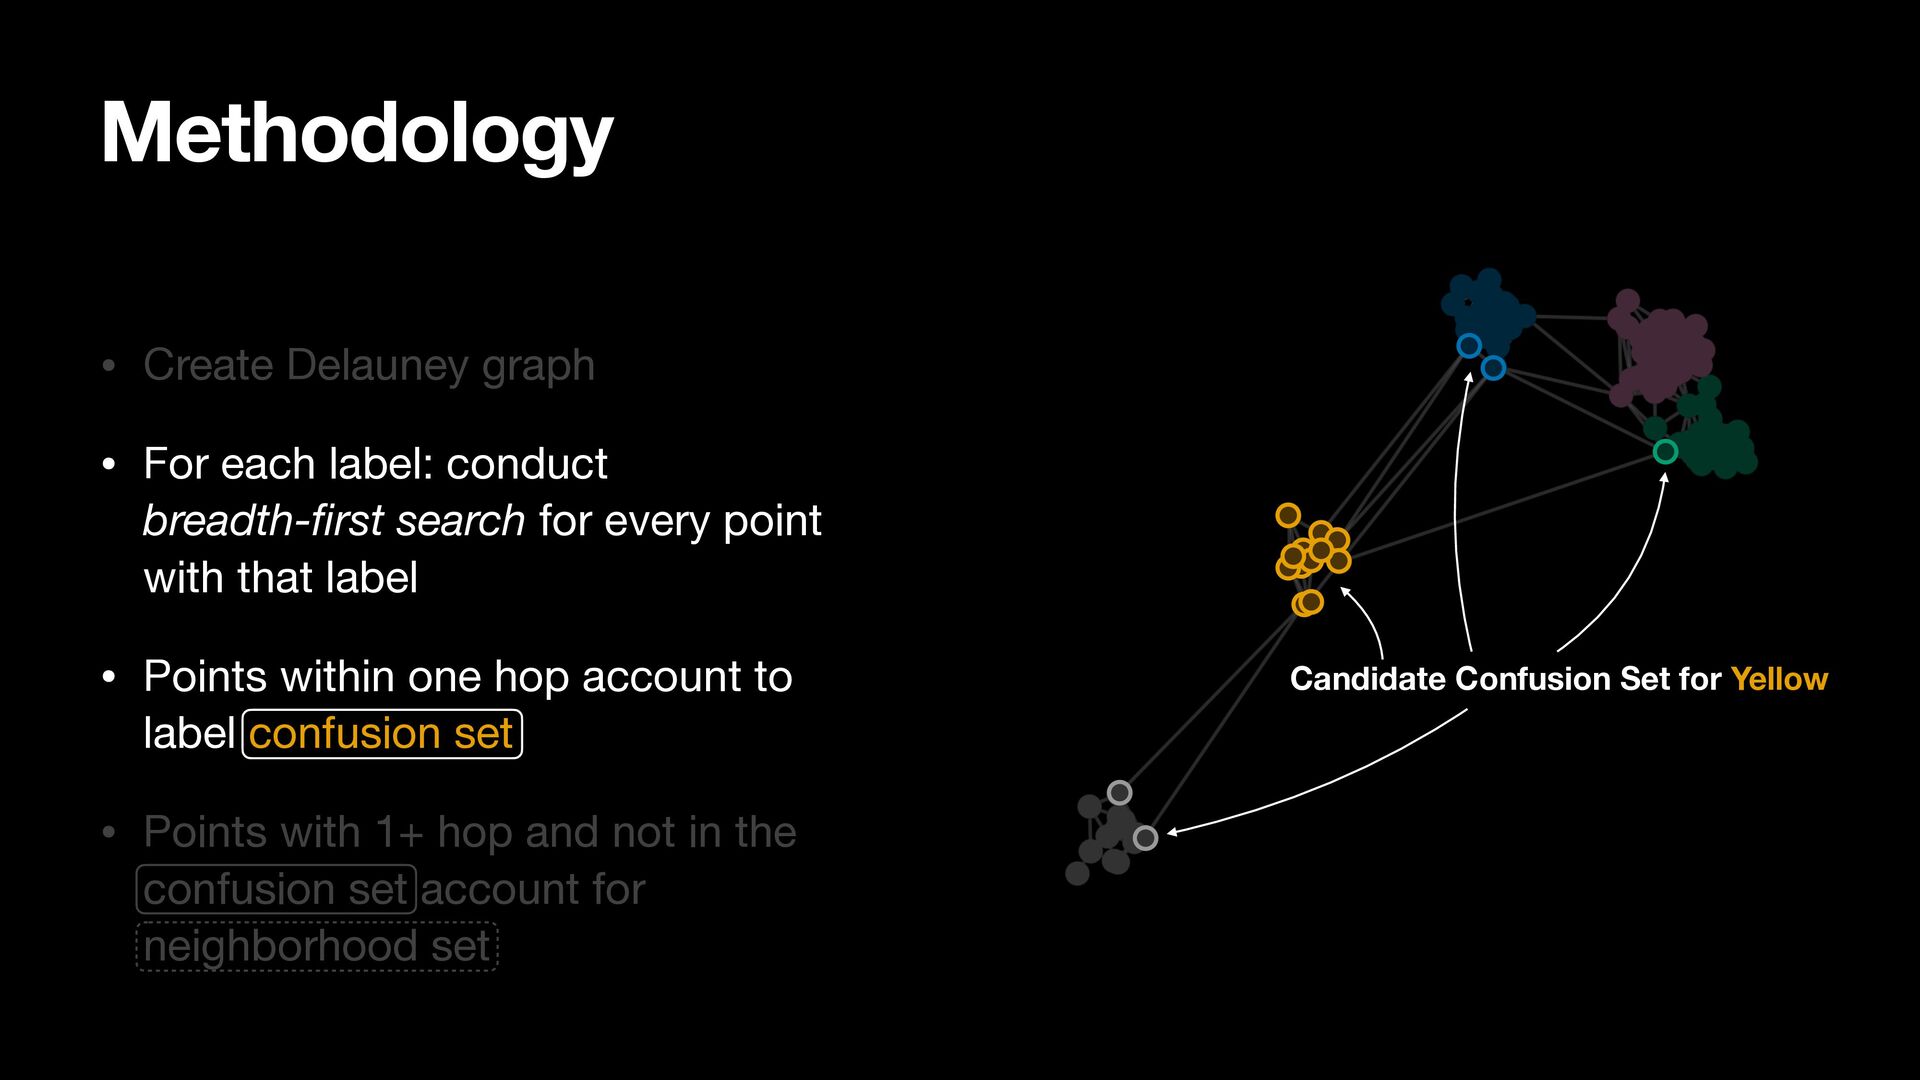
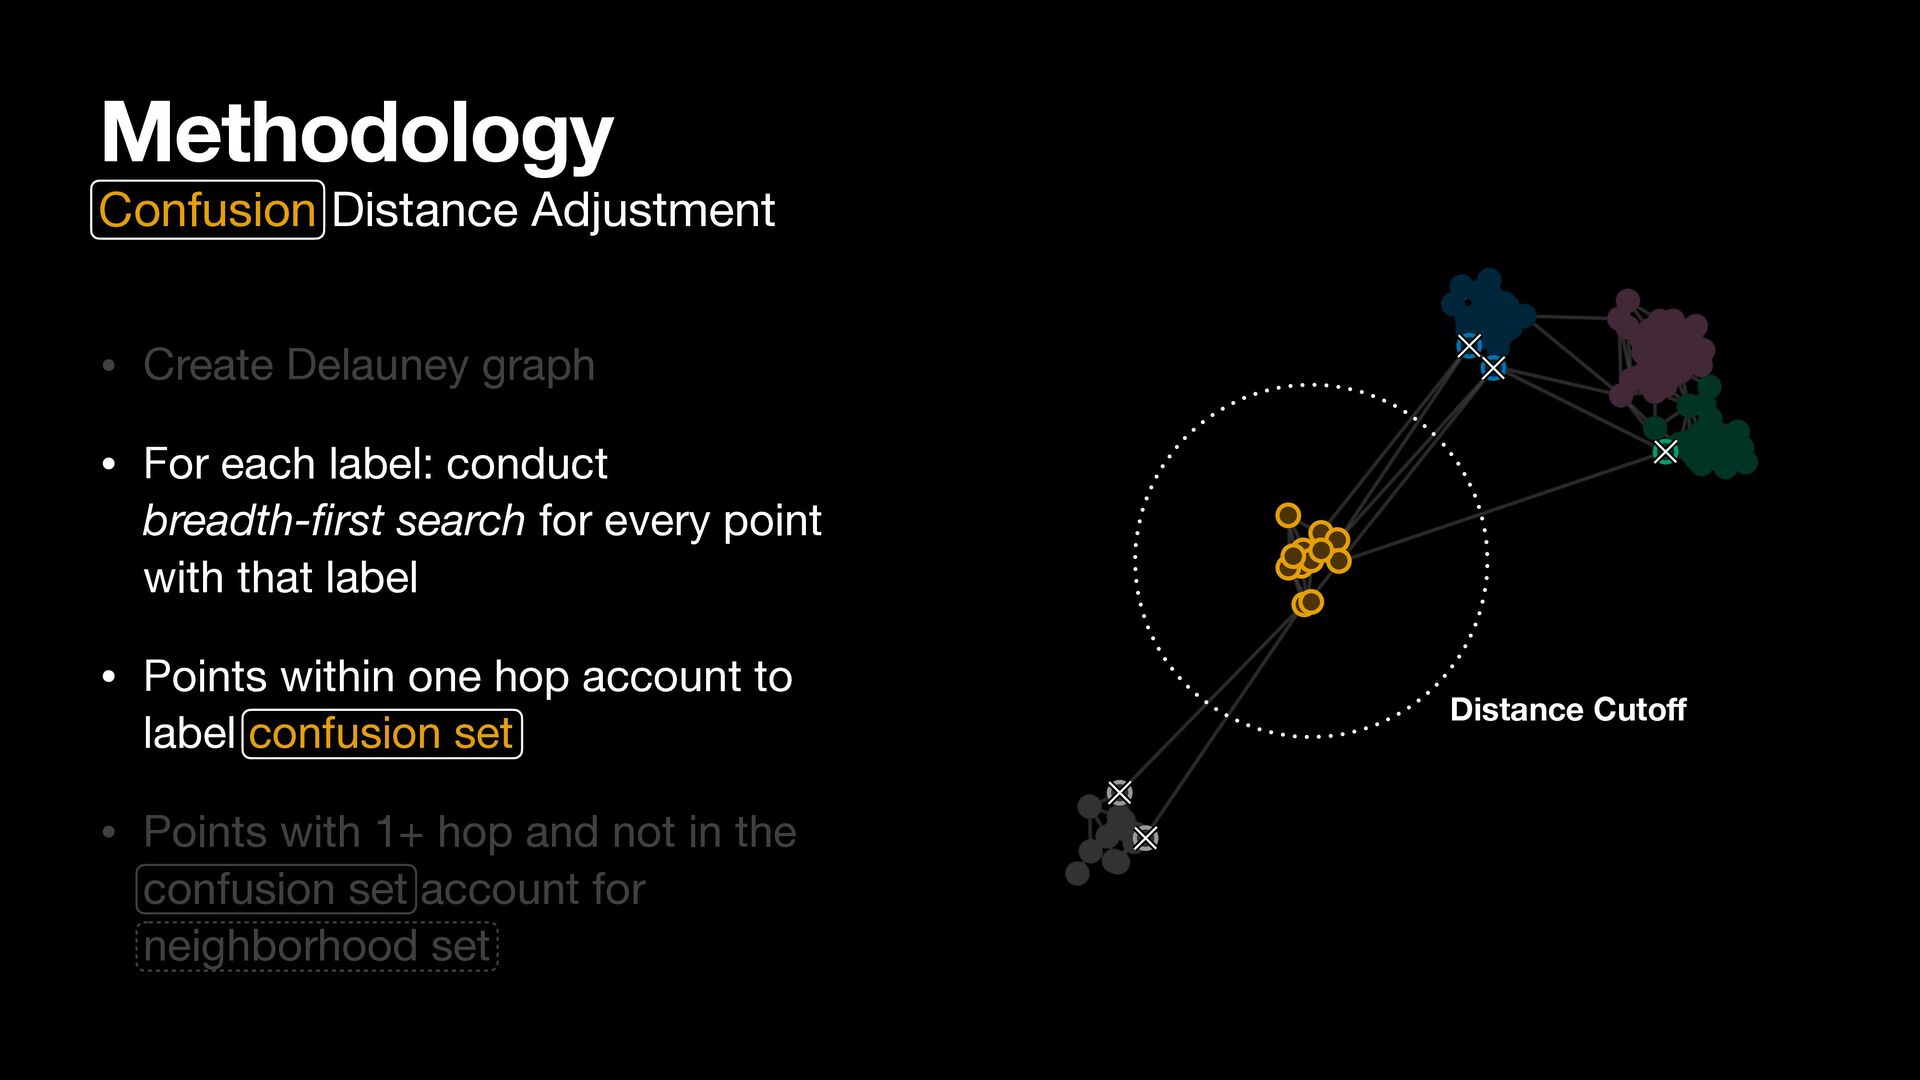
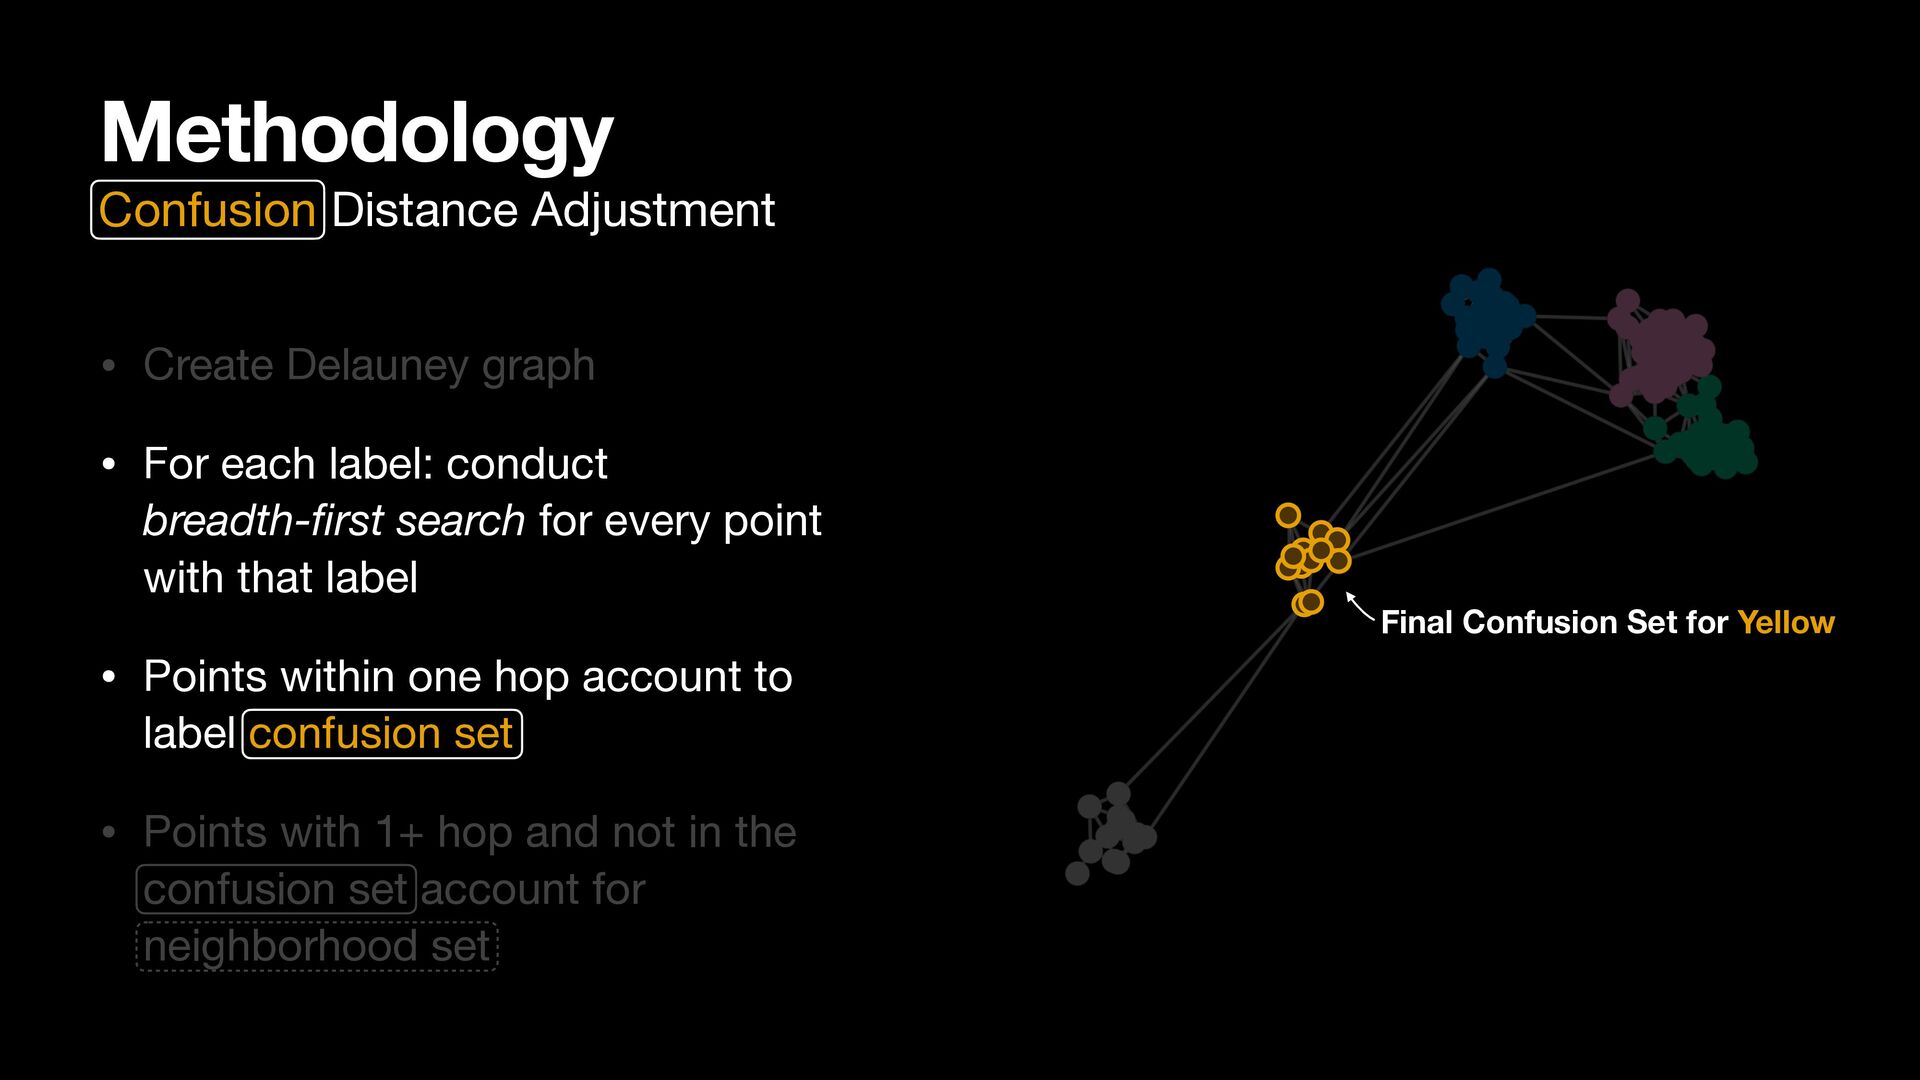
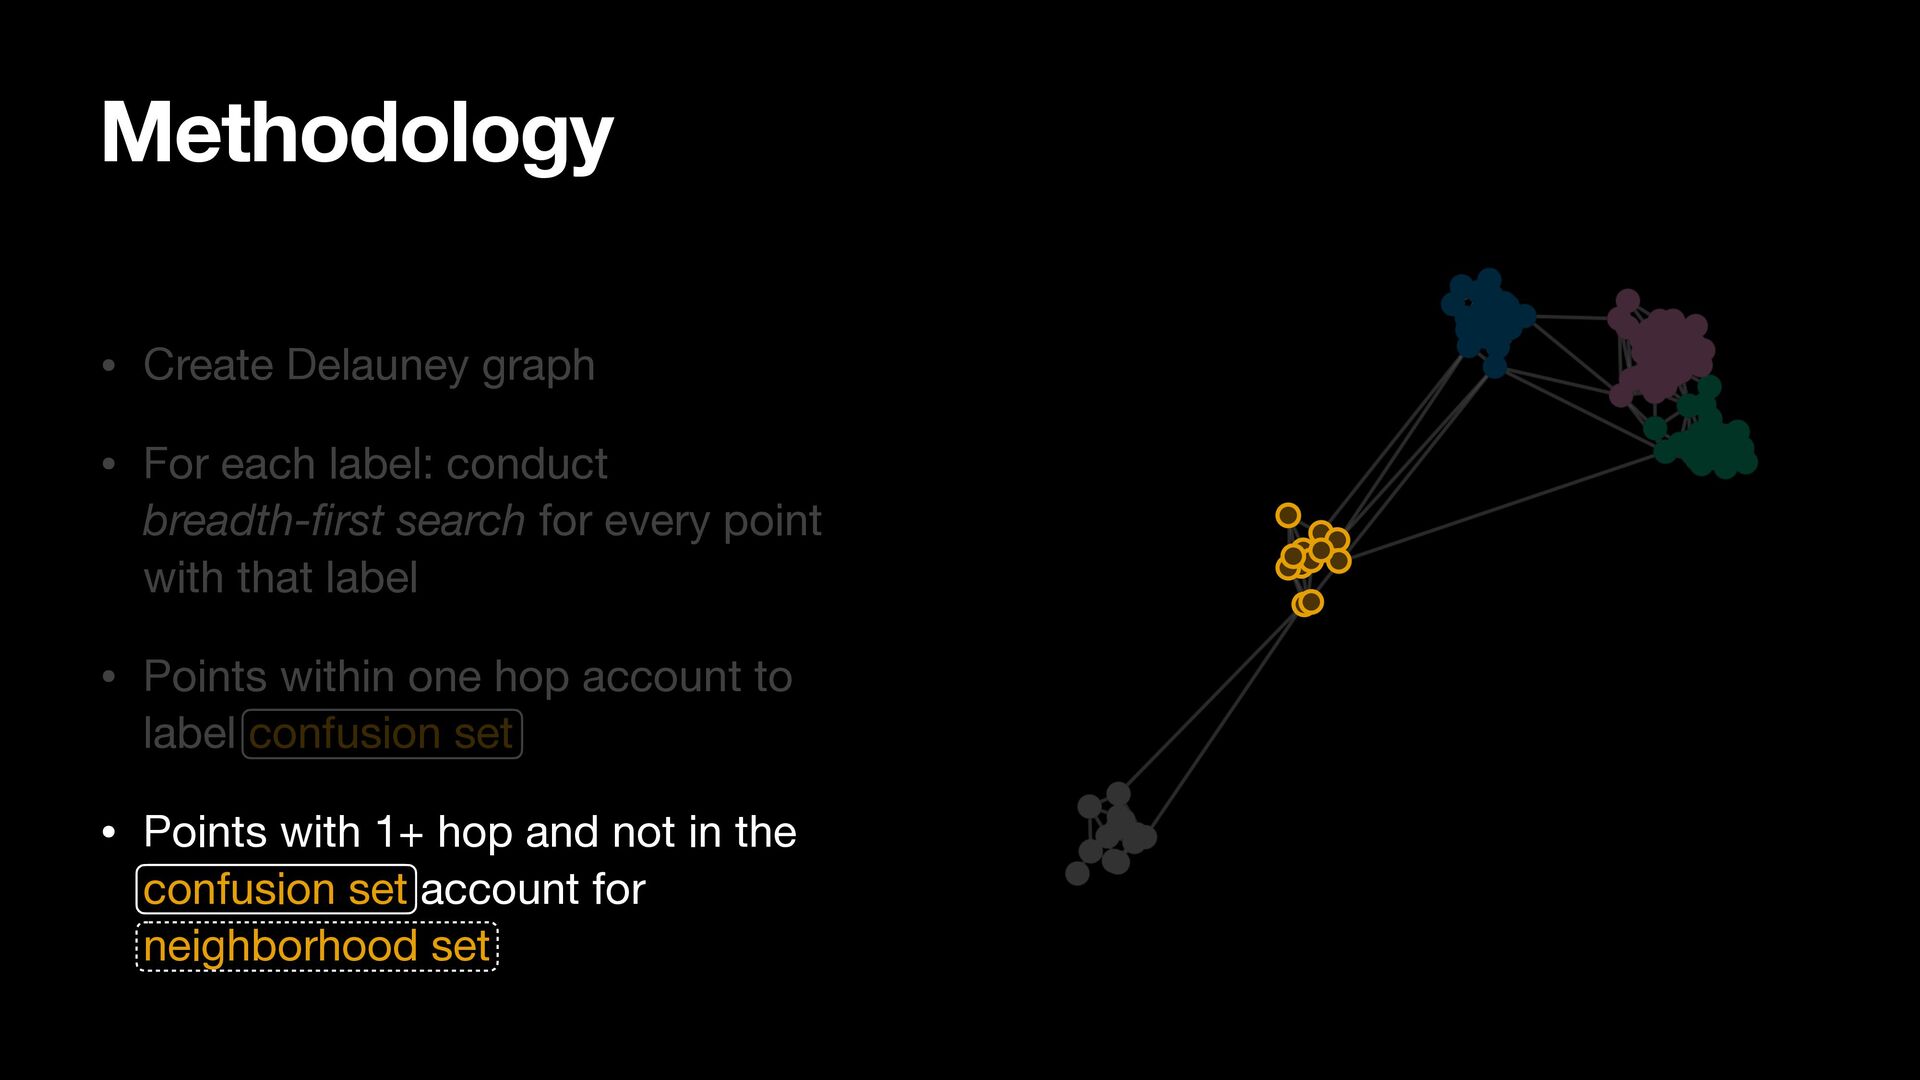
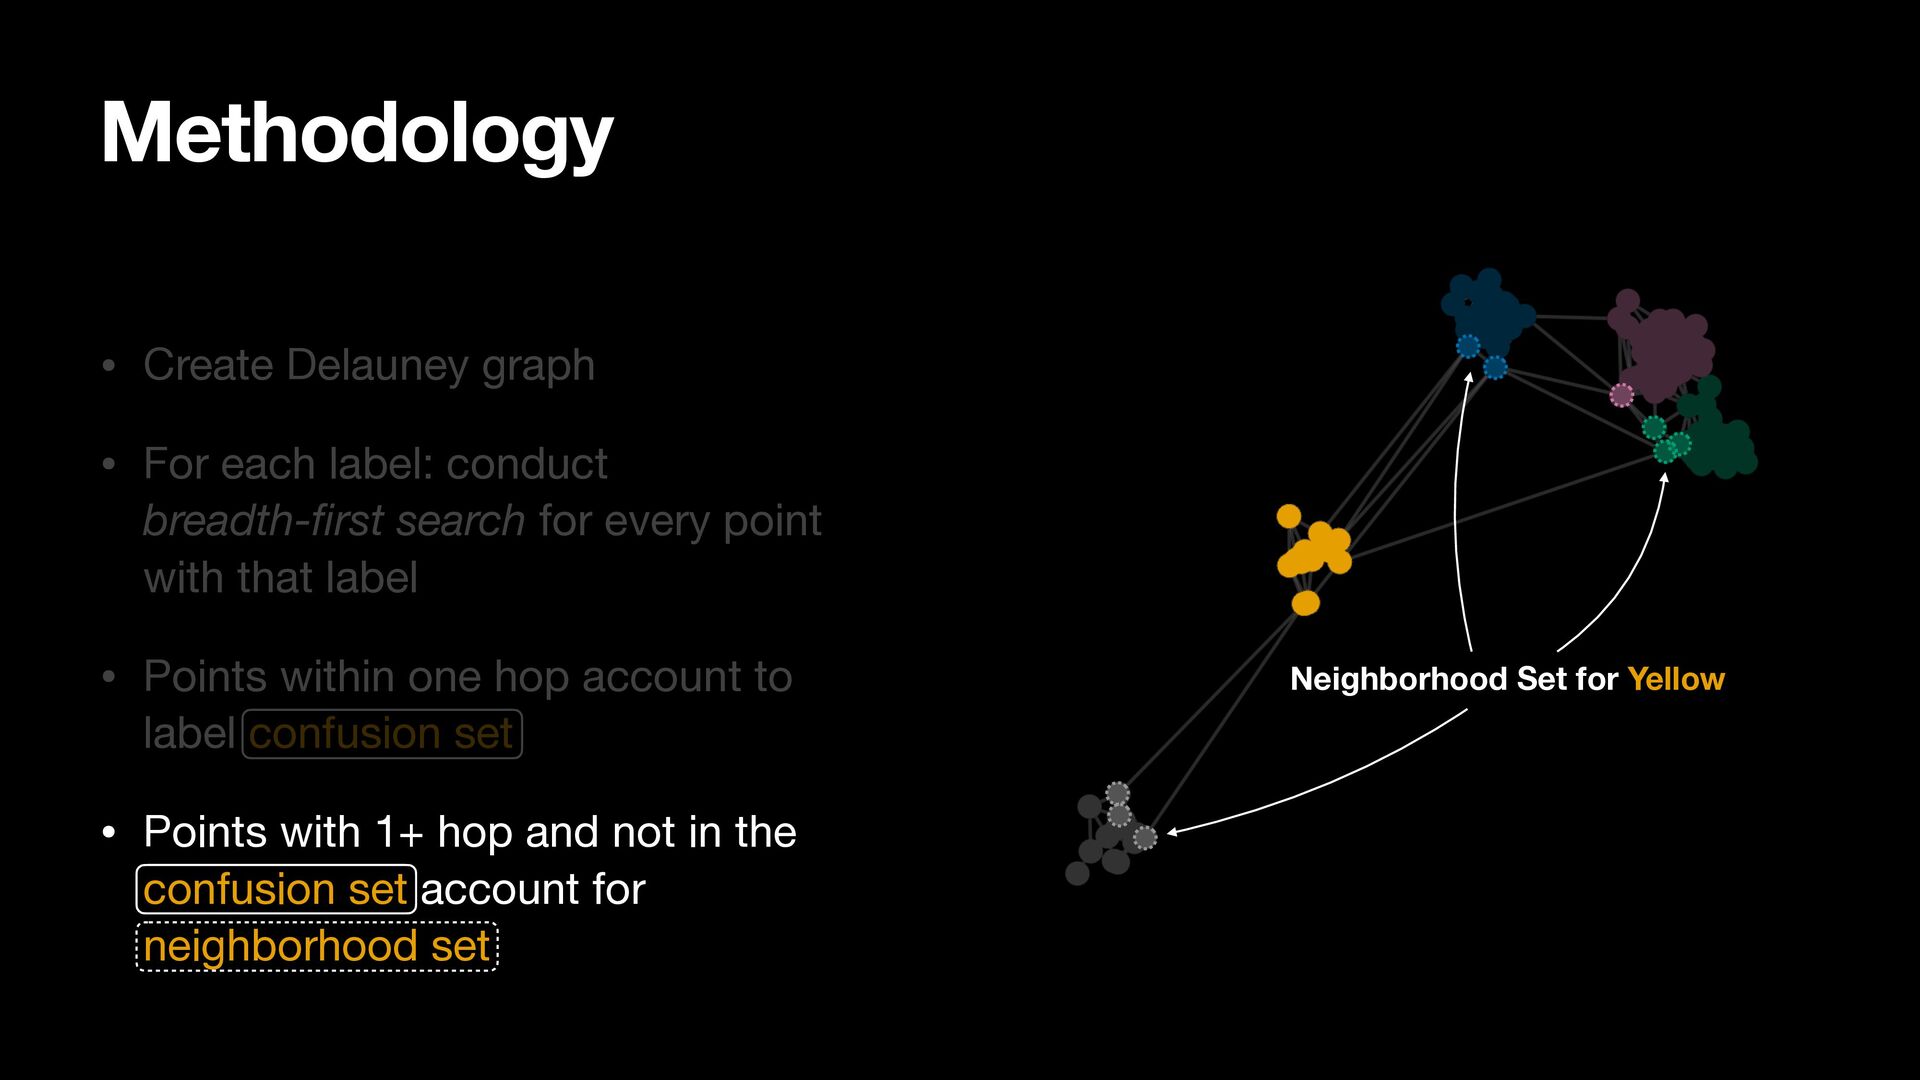
breadth-first search for every point with that label • Points within one hop account to label confusion set • Points with 1+ hop and not in the confusion set account for neighborhood set
search for every point with that label • Points within one hop account to label confusion set • Points with 1+ hop and not in the confusion set account for neighborhood set Methodology
search for every point with that label • Points within one hop account to label confusion set • Points with 1+ hop and not in the confusion set account for neighborhood set Methodology
search for every point with that label • Points within one hop account to label confusion set • Points with 1+ hop and not in the confusion set account for neighborhood set Methodology
search for every point with that label • Points within one hop account to label confusion set • Points with 1+ hop and not in the confusion set account for neighborhood set Methodology
search for every point with that label • Points within one hop account to label confusion set • Points with 1+ hop and not in the confusion set account for neighborhood set Methodology
search for every point with that label • Points within one hop account to label confusion set • Points with 1+ hop and not in the confusion set account for neighborhood set Methodology
search for every point with that label • Points within one hop account to label confusion set • Points with 1+ hop and not in the confusion set account for neighborhood set Methodology
search for every point with that label • Points within one hop account to label confusion set • Points with 1+ hop and not in the confusion set account for neighborhood set Methodology
search for every point with that label • Points within one hop account to label confusion set • Points with 1+ hop and not in the confusion set account for neighborhood set Methodology
search for every point with that label • Points within one hop account to label confusion set • Points with 1+ hop and not in the confusion set account for neighborhood set Methodology
search for every point with that label • Points within one hop account to label confusion set • Points with 1+ hop and not in the confusion set account for neighborhood set Methodology Candidate Confusion Set for Yellow
search for every point with that label • Points within one hop account to label confusion set • Points with 1+ hop and not in the confusion set account for neighborhood set Methodology Confusion Distance Adjustment Distance Cutoff
search for every point with that label • Points within one hop account to label confusion set • Points with 1+ hop and not in the confusion set account for neighborhood set Methodology Confusion Distance Adjustment Final Confusion Set for Yellow
search for every point with that label • Points within one hop account to label confusion set • Points with 1+ hop and not in the confusion set account for neighborhood set Methodology
search for every point with that label • Points within one hop account to label confusion set • Points with 1+ hop and not in the confusion set account for neighborhood set Methodology Neighborhood Set for Yellow
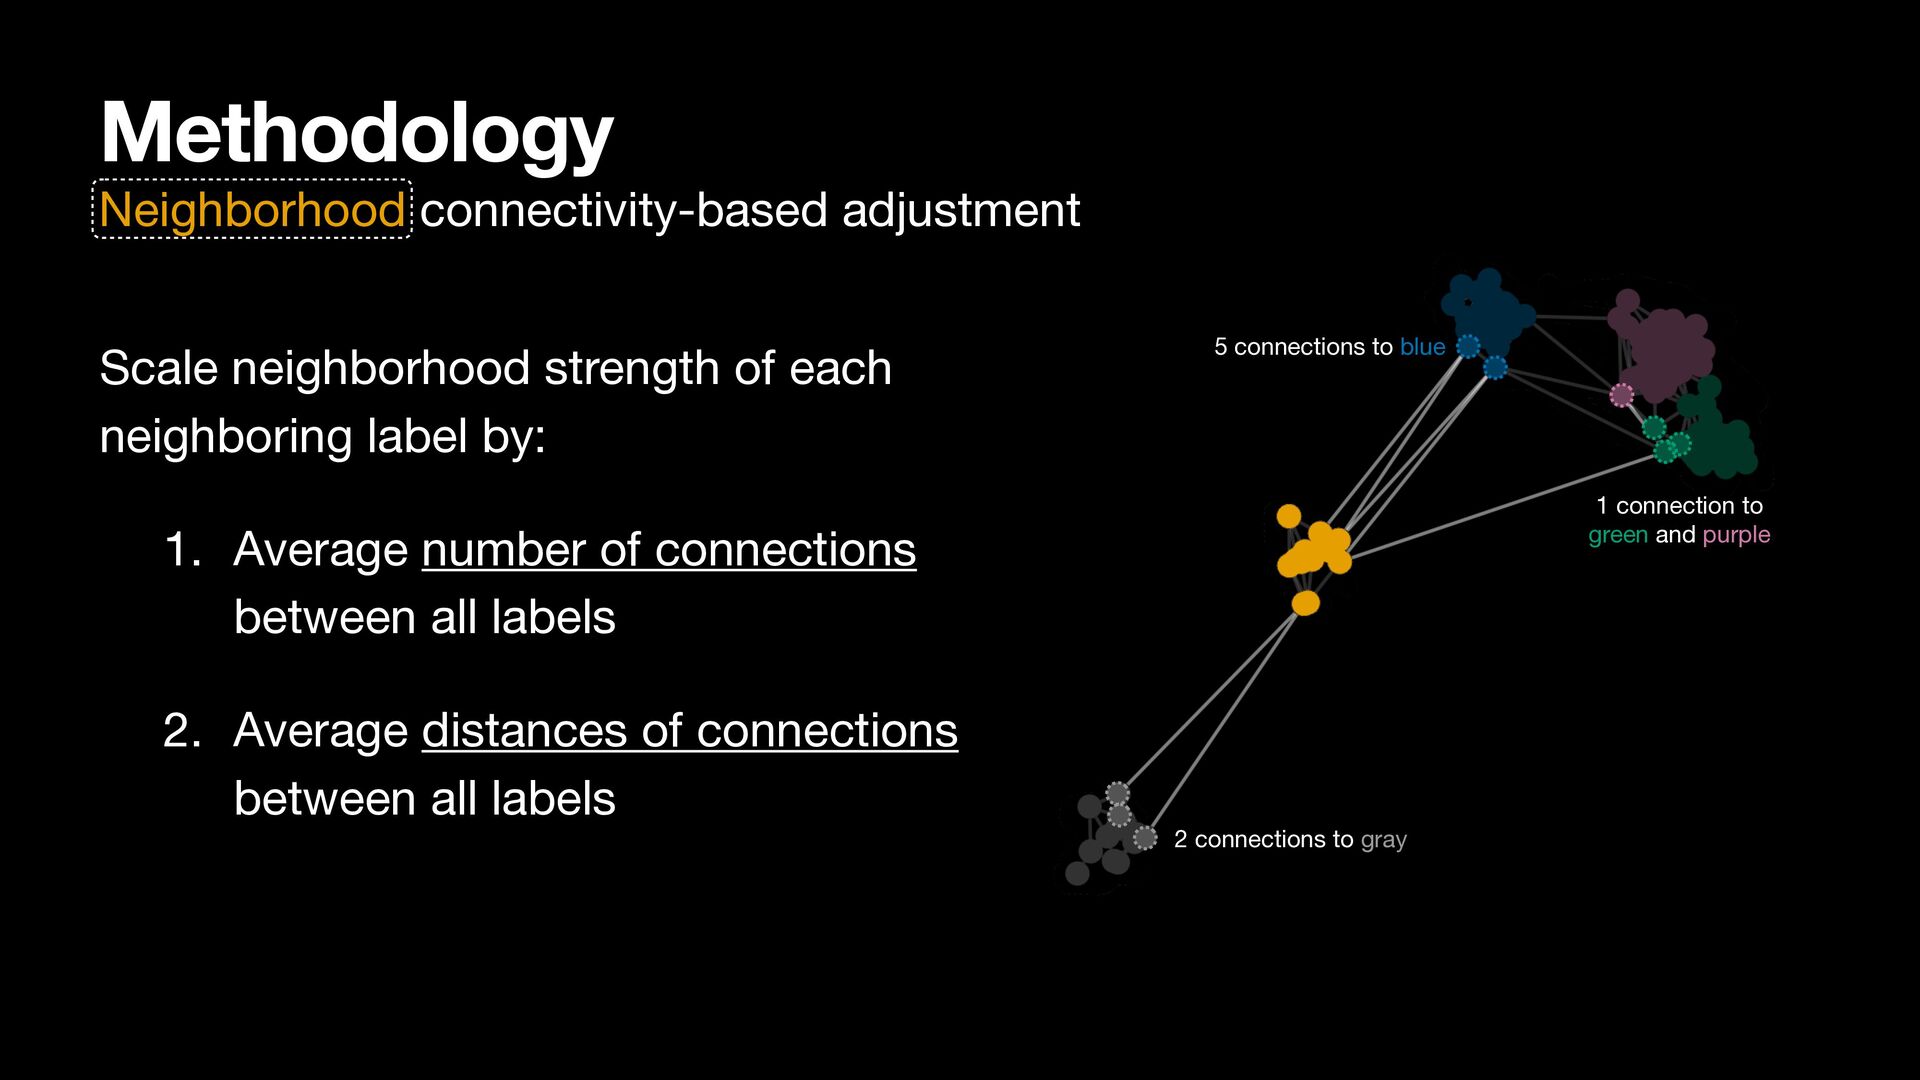
label by: 1. Average number of connections between all labels 2. Average distances of connections between all labels 5 connections to blue 2 connections to gray 1 connection to green and purple
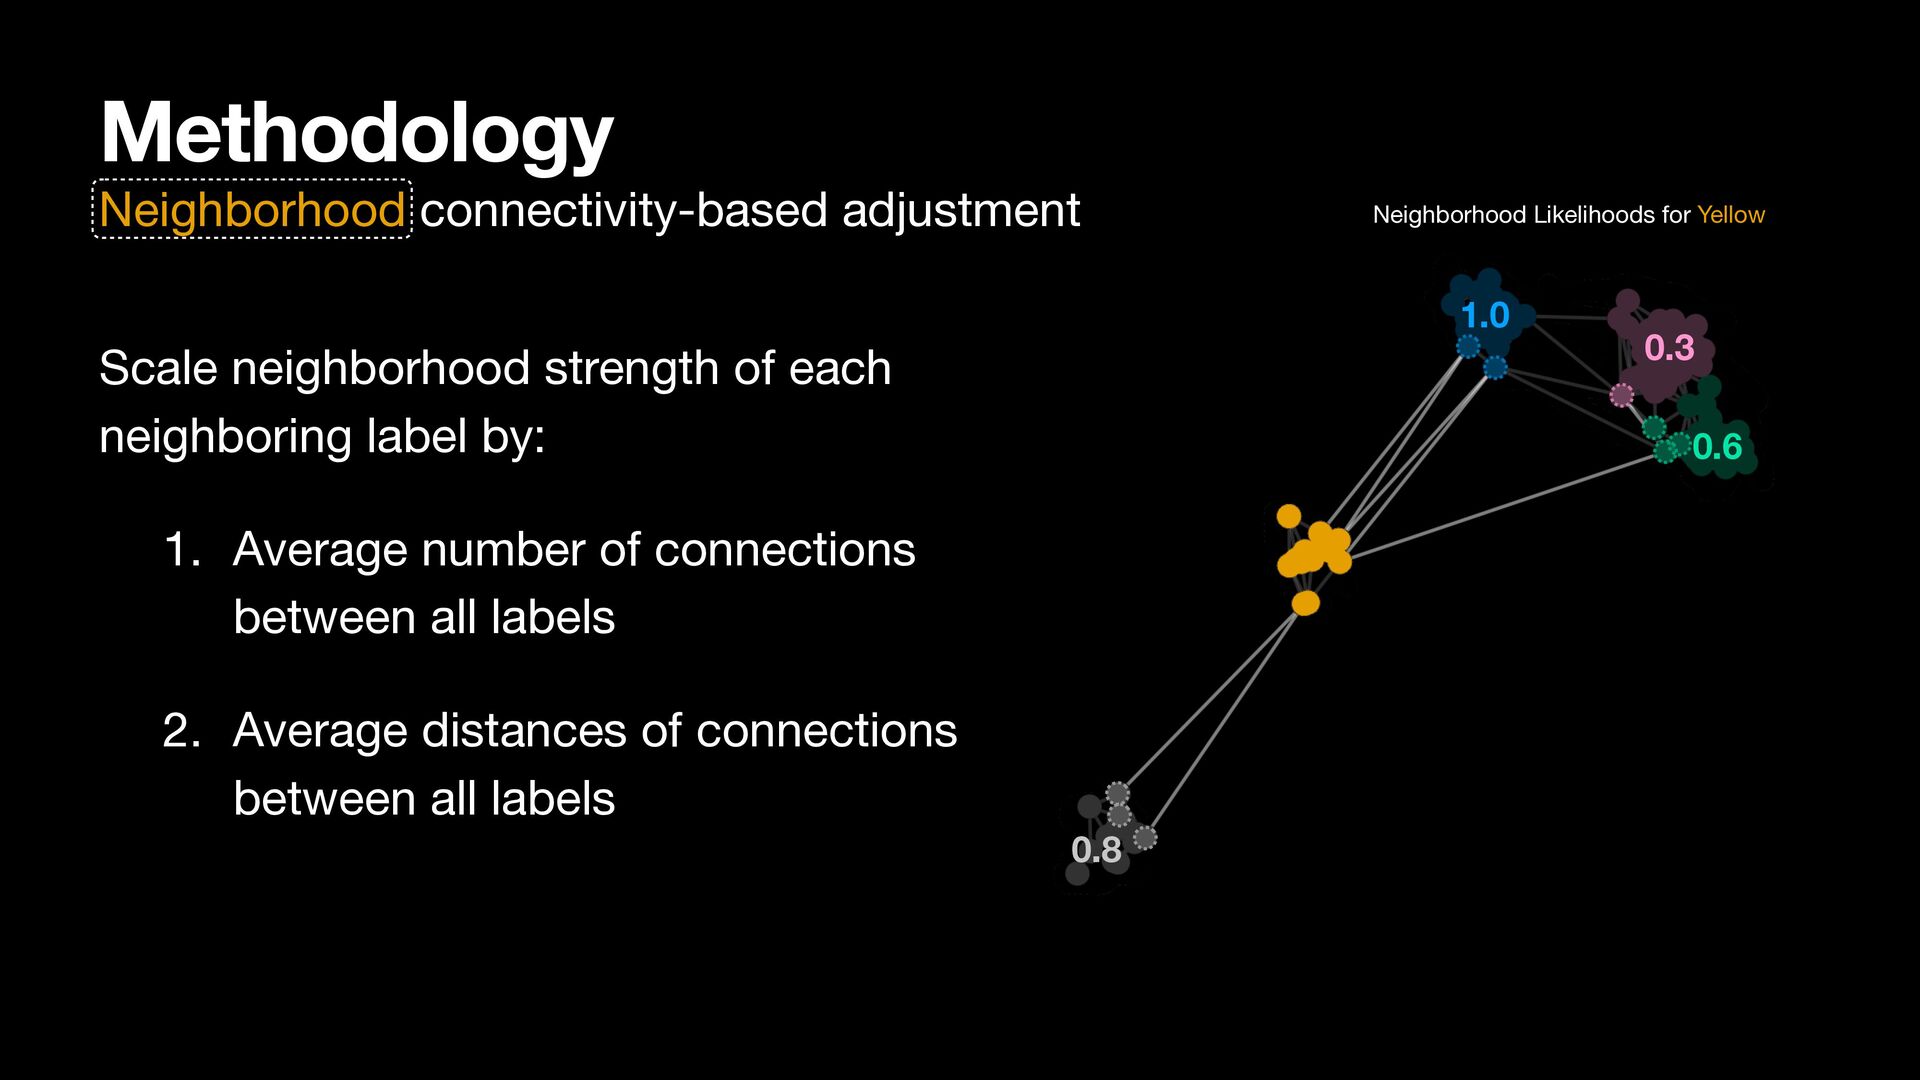
label by: 1. Average number of connections between all labels 2. Average distances of connections between all labels Neighborhood Likelihoods for Yellow 1.0 0.3 0.6 0.8
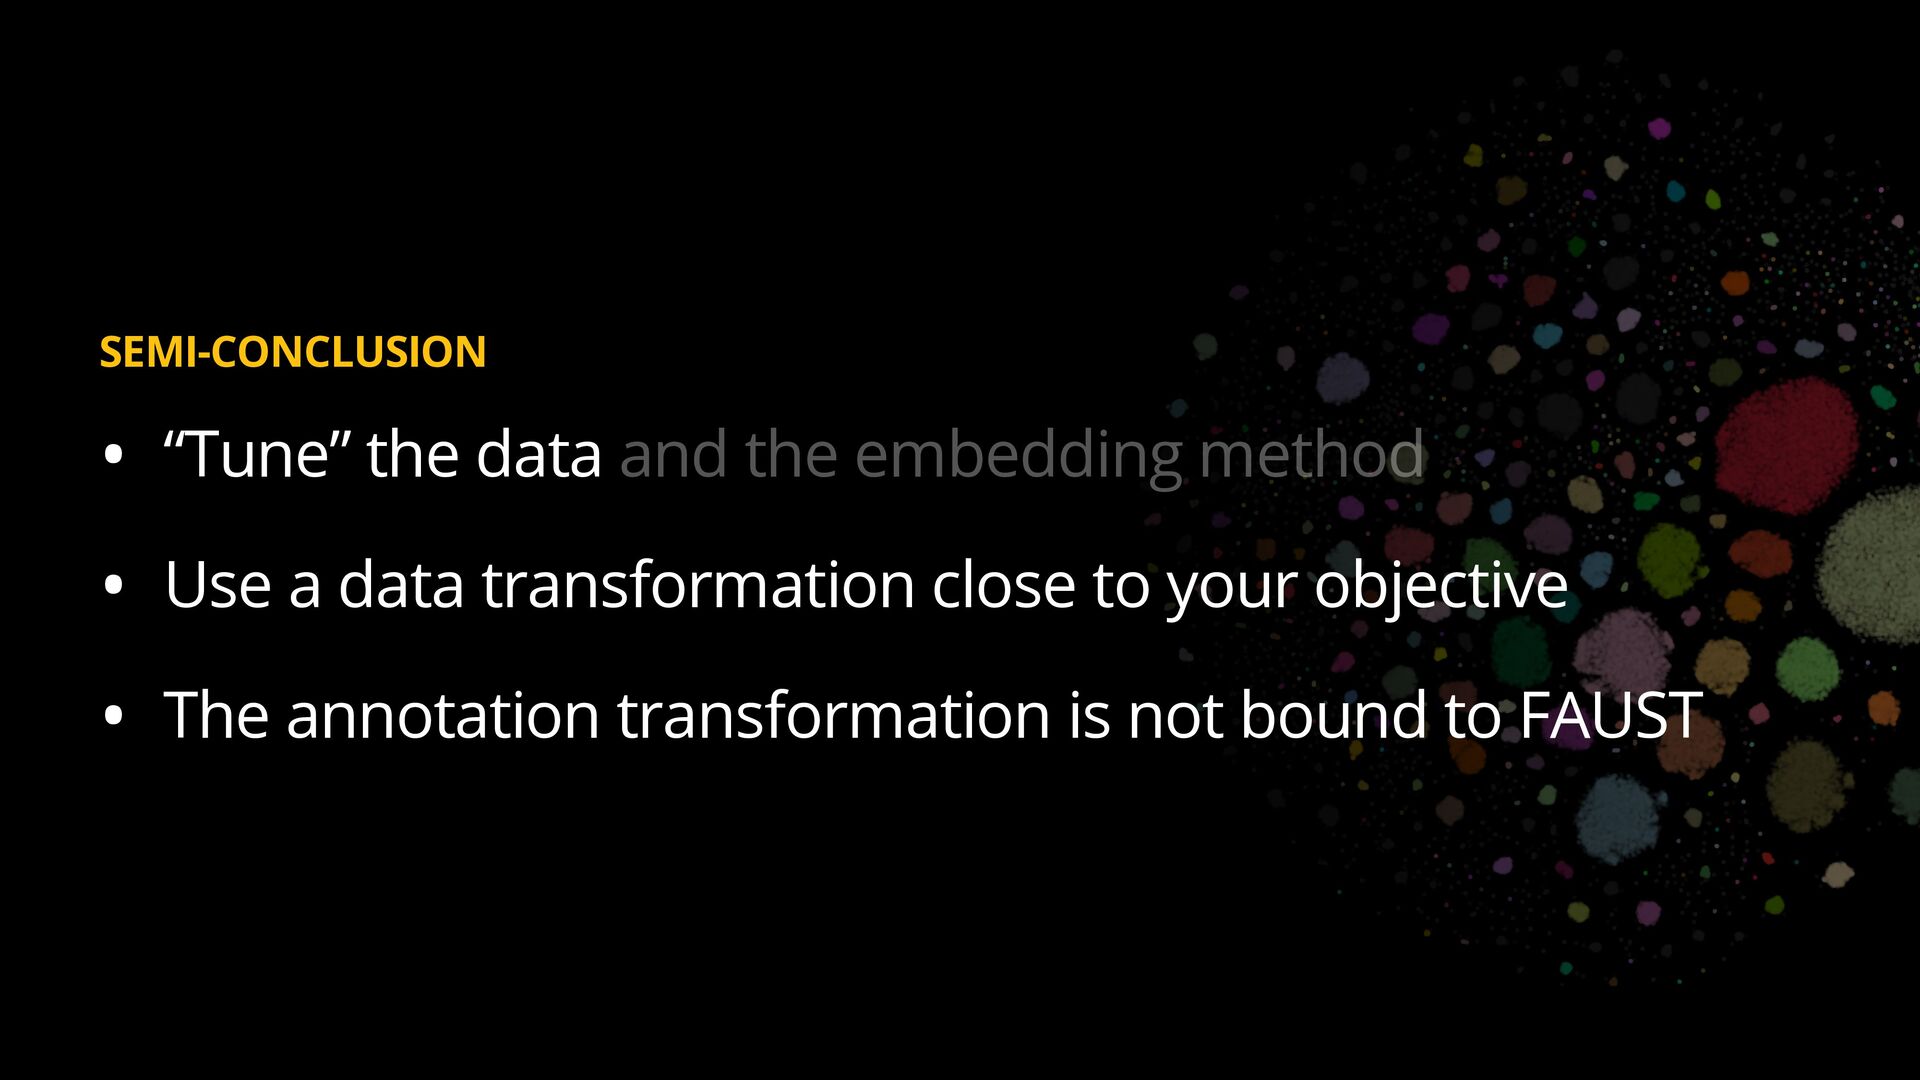
labels • Can be defined dynamically and different levels of abstraction • Addresses limitations of traditional point-based methods • Evaluation study: Guided comparisons increase confidence in findings • Note: Intended to complement embedding quality assessment methods \
plots? How to conditionally and dynamically balance feature importance? How to dynamically and continuously adjust local vs global patterns? November 13, 2024 Visual Analytics Lab at Tufts University