Upgrade to Pro — share decks privately, control downloads, hide ads and more …

Control of Power Electronics Dominated Power Sy...

Avatar for Florian Dörfler Florian Dörfler
November 14, 2025
200

Control of Power Electronics Dominated Power Systems

Avatar for Florian Dörfler

Florian Dörfler

November 14, 2025
Tweet

Transcript

  1. Control of Power Electronics Dominated Power Systems Florian Dörfler ETH

    Zürich CISE Workshop 2025: A Roadmap for (…) Power Grids
  2. thermal plant hydro power (variable speed) electronic loads AC transmission

    new loads (e.g., EVs) photovoltaics wind power high voltage DC transmission solid state transformer Tomorrow: sustainable, distributed & digital 2 <latexit sha1_base64="Kj66Ui4xb5LWB3yTPwz9RwqrQDM=">AAAD13icdVLLbtQwFHUnPEp4tbBkEzGqxAKNElQVluUhxLI8pi2aRCPHuelY9SPYzrSDZbFDLNiwgN/hO/gbnJkpIjOpJStH555777k3zitGtYnjPxu94MrVa9c3b4Q3b92+c3dr+96hlrUiMCSSSXWcYw2MChgaahgcVwowzxkc5acvm/jRFJSmUnwwswoyjk8ELSnBxlPvUjfe6seDeH6idZAsQR8tz8F4u/c7LSSpOQhDGNZ6lMSVySxWhhIGLkxrDRUmp/gERh4KzEE/Lqa00nOY2blrF+34YBGVUvkrTDRn/0+2mGs947lXcmwmejXWkF2xUW3KZ5mloqoNCLJoVNYsMjJqVhAVVAExbOYBJop62xGZYIWJ8YtqdTnDeuYttGayTUMjJdOu21H3DG2a6E+1NLBeolmFXu+ndNnBFnJVW8wLtLnz0o/mwnAnmvqxZTPiK/B/TsF770yy1z7D5h4Uzg7dBeLOCtehfM6qCc7B2LRxsBQvPmEq4IxIzrEobKoprxicu1GSWV+GGTy2/cStqBpLC8m/cpeopJLCL8xrR9mCsYm7rKRUn0HJtjq+UPsnn6w+8HVw+GSQ7A323u72918sH/8meoAeokcoQU/RPnqDDtAQEVSi7+gn+hV8DL4EX4NvC2lvY5lzH7VO8OMvJJVP1w==</latexit> } automation electronics
  3. Top arm voltage synchronous generator IBR: inverter-based resource ⊕ robust

    & stable physics: sync & inertia ⊕ robust controls, dispatchable, services ⊖ no stabilizing physics & robust control ⊕ fast & fully programmable… but how ? AC AC AC SOLAR DC DC A 3 Trade-offs with old vs new technologies
  4. IBR challenges are by now broadly recognized 4 Biblis A

    generator stabilizes the grid as a synchronous condenser Instrumentation, Controls & Electrical SPPA-E3000 Electrical Solutions makes it possible to use the generator of Biblis A as a synchronous condenser. This serves to even out grid voltage fluctuations. The Plant The Biblis power plant, which has been in a permanently non-productive state, is located in the community of Biblis in the south of Hesse, Germany and belongs to RWE Power AG. Until 2011 it comprised two pressurized water reactors in units A and B, with an output of 1200 MW (unit A) and 1300 MW ( unit B) respectively. Based on the decision of the nuclear energy moratorium, unit A was disconnected from the grid on March 18, 2011. At that time unit B was already in a scheduled revision. The Task As a result of the fluctuating infeed of renewable energy and the shutdown of nuclear power plants in southern Germany, voltage stabilization within the Amprion grid is becoming increasingly challenging. In order to stabilize the grid in the future too, the Biblis A generator was to be converted into a The Result Ŷ Improved grid stability thanks to the generation of reactive power through the conversion of the generator to a synchronous condenser Ŷ Innovative further use of a shut down power plant Ŷ Optimum planning security the generator via the generator terminal lead. It was thus possible to connect the generator from unit A to the grid as a synchronous condenser. This now regulates the reactive power from -400 up to +900 MVar, which is made available to grid operator Amprion in situations of low or high grid voltage. The resulting voltage regulation thus ensures a balanced relationship between active and reactive power. During the start-up procedure of the synchronous condenser, special functions are set in the unit protection. Measures here include deactivation of the underfrequency protection and switching to a sensitive-setting definite time overcurrent protection of the synchronous machine. Even though the customer addressed additional requirements, it was possible to keep the set timeframe of five months for the realization of the project. Reference – Electrical Solutions Biblis A generator stabilizes the grid as a synchronous condenser Instrumentation, Controls & Electrical SPPA-E3000 Electrical Solutions makes it possible to use the generator of Biblis A as a synchronous condenser. This serves to even out grid voltage fluctuations. The Plant The Biblis power plant, which has been in a the generator via the generator terminal lead. It was thus possible to connect the generator from unit A to the grid as a synchronous condenser. This now regulates the reactive power from -400 up to +900 MVar, which is made available to grid operator Amprion in situations of low or high grid voltage. The resulting voltage regulation thus ensures a Reference – Electrical Solutions 8/19/18, 14:35 Generator wird zum Motor STARTSEITE → PRESSE 24.02.2012 12:00 24.02.2012 12:00 GENERATOR WIRD ZUM MOTOR Die Spannungshaltung im deutschen Stromnetz wird durch die Einspeisung schwankender erneuerbarer Energien und die Abschaltung von Kernkra werken vor allem im Süden Deutschlands immer anspruchsvoller. Insbesondere im Herbst und Winter kann es hier zu Störungen kommen. Dies hat die Bundesnetzagentur (BNA) in ihrem Bericht zu den Auswirkungen des Kernkra ausstieges auf die Übertragungsnetze und die Versorgungssicherheit im Sommer 2011 deutlich gemacht. Der Übertragungsnetzbetreiber Amprion und RWE Power haben vor diesem Hintergrund vereinbart, den Generator von Block A im nicht-nuklearen Teil des abgeschalteten Kernkra werks Biblis für die Netzdienstleistung ¿Phasenschieberbetrieb¿ umzurüsten und so zur Stabilisierung des Netzes im Süden Deutschlands beizutragen. ¿Der Phasenschieber erleichtert es unseren Ingenieuren, die Systemsicherheit im Amprion-Netz auch in schwierigen Netzsituationen aufrecht zu erhalten¿, so Dr. Klaus Kleinekorte, Technischer Geschä sführer. ¿Die rasche Durchführung dieses ehrgeizigen Projektes war nur möglich, weil alle Beteiligten - Siemens, RWE Power und unsere Mitarbeiter ¿ in den vergangenen Monaten hervorragende Arbeit geleistet haben.¿ Die elektrische Maschine ist technisch so von RWE Power und dem Hersteller Siemens umgerüstet worden, dass der Generator jetzt im Motorbetrieb so genannte Blindleistung regeln kann, die für die USING DECOMMISSIONED NUCLEAR POWER PLANT AS SYSTEM SERVICE PROVIDERS REPORT 2017:348 NUCLEAR POWER USING DECOMMISSIONED NUCLEAR POWER PLANT AS SYSTEM SERVICE PROVIDERS REPORT 2017:348 NUCLEAR POWER • issues were not on the radar (except for few places e.g. Oz & Ireland) a decade ago → led to rather absurd situations … • mainstream since 2015: MIGRATE project & successors (OSMOSE…) • on this side of the pond culture change: industry is now very receptive for solutions & welcomes innovation & academic collaboration
  5. Exciting research bridging communities 5 systems & control power systems

    power electronics device ⟷ system | academia ⟷ industry | theory ⟷ practice
  6. Outline: a personal journey through the field 6 • introduction

    • old problems we can put aside for now • new problems that should receive attention - interoperability & grid codes - services from distributed generation - data-driven decision making • conclusions resurrect frequency domain methods <latexit sha1_base64="Kj66Ui4xb5LWB3yTPwz9RwqrQDM=">AAAD13icdVLLbtQwFHUnPEp4tbBkEzGqxAKNElQVluUhxLI8pi2aRCPHuelY9SPYzrSDZbFDLNiwgN/hO/gbnJkpIjOpJStH555777k3zitGtYnjPxu94MrVa9c3b4Q3b92+c3dr+96hlrUiMCSSSXWcYw2MChgaahgcVwowzxkc5acvm/jRFJSmUnwwswoyjk8ELSnBxlPvUjfe6seDeH6idZAsQR8tz8F4u/c7LSSpOQhDGNZ6lMSVySxWhhIGLkxrDRUmp/gERh4KzEE/Lqa00nOY2blrF+34YBGVUvkrTDRn/0+2mGs947lXcmwmejXWkF2xUW3KZ5mloqoNCLJoVNYsMjJqVhAVVAExbOYBJop62xGZYIWJ8YtqdTnDeuYttGayTUMjJdOu21H3DG2a6E+1NLBeolmFXu+ndNnBFnJVW8wLtLnz0o/mwnAnmvqxZTPiK/B/TsF770yy1z7D5h4Uzg7dBeLOCtehfM6qCc7B2LRxsBQvPmEq4IxIzrEobKoprxicu1GSWV+GGTy2/cStqBpLC8m/cpeopJLCL8xrR9mCsYm7rKRUn0HJtjq+UPsnn6w+8HVw+GSQ7A323u72918sH/8meoAeokcoQU/RPnqDDtAQEVSi7+gn+hV8DL4EX4NvC2lvY5lzH7VO8OMvJJVP1w==</latexit> }
  7. Foundations and Challenges of Low-Inertia Systems (Invited Paper) Federico Milano

    University College Dublin, Ireland email: [email protected] Florian D¨ orfler and Gabriela Hug ETH Z¨ urich, Switzerland emails: dorfl[email protected], [email protected] David J. Hill⇤ and Gregor Verbiˇ c University of Sydney, Australia ⇤ also University of Hong Kong emails: [email protected], 
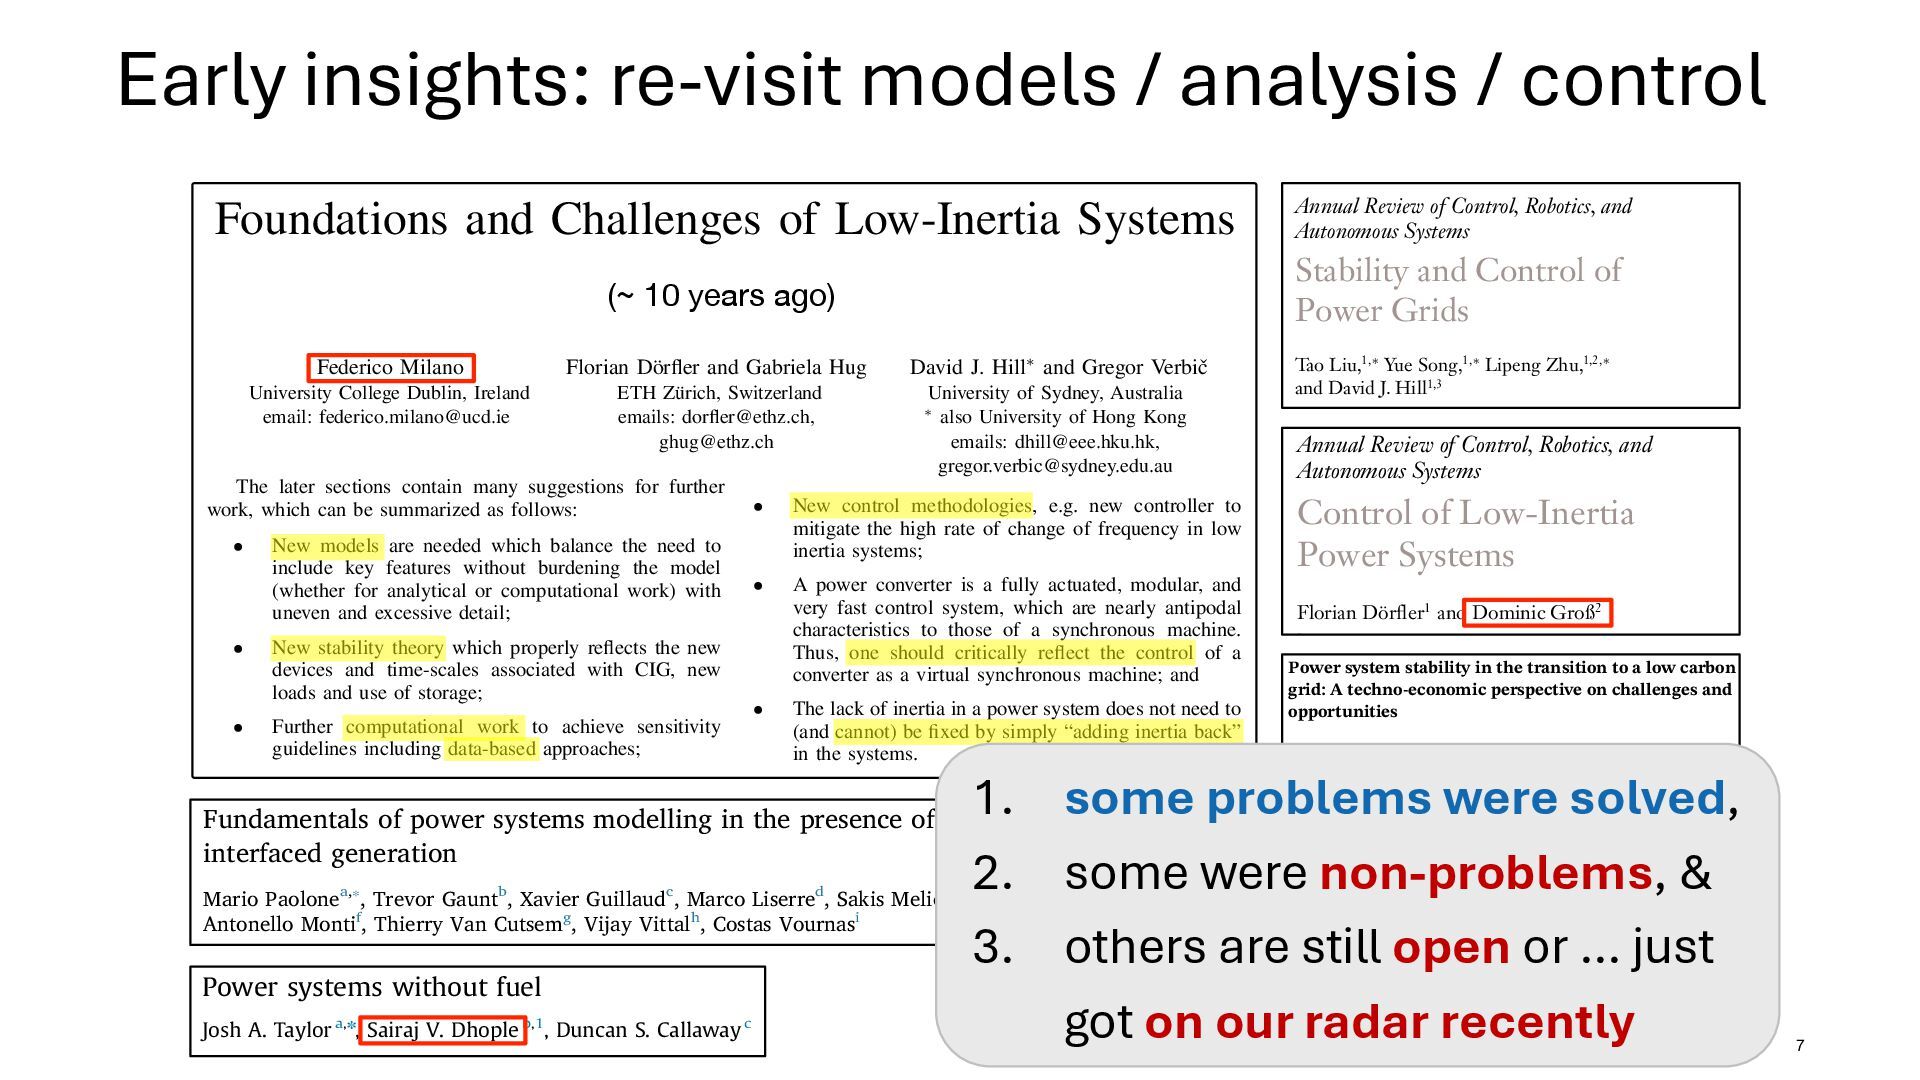
[email protected] Abstract —The electric power system is currently undergoing a period of unprecedented changes. Environmental and sustain- ability concerns lead to replacement of a significant share of conventional fossil fuel-based power plants with renewable energy resources. This transition involves the major challenge of substi- tuting synchronous machines and their well-known dynamics and controllers with power electronics-interfaced generation whose regulation and interaction with the rest of the system is yet to be fully understood. In this article, we review the challenges of such low-inertia power systems, and survey the solutions that have been put forward thus far. We strive to concisely summarize the laid- out scientific foundations as well as the practical experiences of industrial and academic demonstration projects. We touch upon the topics of power system stability, modeling, and control, and we particularly focus on the role of frequency, inertia, as well as control of power converters and from the demand-side. Keywords — Low-inertia power systems, frequency stability, rate of change of frequency (RoCoF), converter-interfaced generation (CIG), grid-forming control, MIGRATE, RE-SEVE, CSIRO. I. INTRODUCTION In an effort to render the electric power system more sustainable, increasing shares of wind and solar generation are being deployed all around the world. The goal is to replace fossil fuel and nuclear based generation by renewable resources. Hence, the total global installed capacities for wind support. This may create unexpected couplings and control approaches based on time-scale separations may become more brittle and increasingly less valid. Likewise, system control tasks predominantly provided by synchronous generators (such as voltage support and oscillation damping) have to be increas- ingly shouldered by non-synchronous devices. Large-scale low inertia power systems have been merely a theoretical concept up until just a decade ago but have now become a reality. Some countries already have solar and/or wind generation capacity able to cover more than 100% of the demand. And some power systems around the world are facing the challenges caused by low inertia. The following are relevant real-life examples. • Australia [3]: The level of combined wind and solar capacity is rapidly increasing and has reached 20% in the National Electricity Market. However, the grid is isolated with a long linear or ’stringy’ topology (over 5000 km synchronous) which leads to special difficul- ties. Furthermore, a multiple of the already existing renewable capacity has additionally been proposed. There are already concerns about inertia distribution. • Central Europe [4]: A task force comprised of Euro- pean system operators studied the frequency behavior for the European system for decreasing system inertia. The main conclusion is that in the interconnected CIG levels has impact on almost everything from planning to operations, modeling, stability and control, there has been a need to focus on some aspects. Inevitably there has also been some emphasis given to work in and connected to the authors’ own institutions in the areas of dynamics and control. Some emphasis has also been given to the relative roles of analytic, computational and practical aspects. The later sections contain many suggestions for further work, which can be summarized as follows: • New models are needed which balance the need to include key features without burdening the model (whether for analytical or computational work) with uneven and excessive detail; • New stability theory which properly reflects the new devices and time-scales associated with CIG, new loads and use of storage; • Further computational work to achieve sensitivity guidelines including data-based approaches; • New control methodologies, e.g. new controller to mitigate the high rate of change of frequency in low inertia systems; • A power converter is a fully actuated, modular, and very fast control system, which are nearly antipodal characteristics to those of a synchronous machine. Thus, one should critically reflect the control of a converter as a virtual synchronous machine; and • The lack of inertia in a power system does not need to (and cannot) be fixed by simply “adding inertia back” in the systems. This group of authors believes that these are the core scientific D. Hill is supported in Hong Kong by the Research Grants Council Theme-based Research Scheme (Project No. T23- 701/14-N). In Sydney D. Hill and G. Verbiˇ c were supported by the CSIRO University Cluster on Future Grid. The authors would like to thank their collaborators for insightful discussions and constructive feedback on an early draft of this survey. Particular thanks goes to the members of the MIGRATE consortium for many inputs and discussions, and to Uros Markovic at ETHZ; Dr ´ Alvaro Ortega in UCD; and Wenting Yi in HKU for contributing some content to a few sections of the paper. REFERENCES [1] “Global wind statistics 2017,” Global Wind Energy Council, Tech. Rep., 2018. [2] International Energy Agency (IEA), “2016 snapshot of global photo- voltaic markets,” 2017. [3] AEMO, “Update Report - Black System Event in South Australia on 28 September 2016,” Tech. Rep., 2016. [4] RG-CE System Protection & Dynamics Sub Group, “Frequency stabil- ity evaluation criteria for the synchronous zone of continental europe,” ENTSO-E, Tech. Rep., 2016. [5] Svenska Kraftn¨ at, Statnett, Fingrid and Energinet.dk, “Challenges and Opportunities for the Nordic Power System,” Tech. Rep., 2016. [6] ERCOT Concept Paper, “Future Ancillary Services in ERCOT,” Tech. Rep., 2013. [7] EirGrid and SONI, All-island Generation Capacity Statement 2017- 2026, 2017, [Online]. Available: http://www.eirgridgroup.com. [8] EirGrid and Soni, “DS3: System Services Review TSO Recommen- dations,” EirGrid, Tech. Rep., 2012. [9] M.-S. Debry, G. Denis, T. Prevost, F. Xavier, and A. Menze, “Maximiz- ing the penetration of inverter-based generation on large transmission CIG levels has impact on almost everything from planning to operations, modeling, stability and control, there has been a need to focus on some aspects. Inevitably there has also been some emphasis given to work in and connected to the authors’ own institutions in the areas of dynamics and control. Some emphasis has also been given to the relative roles of analytic, computational and practical aspects. The later sections contain many suggestions for further work, which can be summarized as follows: • New models are needed which balance the need to include key features without burdening the model (whether for analytical or computational work) with uneven and excessive detail; • New stability theory which properly reflects the new devices and time-scales associated with CIG, new loads and use of storage; • Further computational work to achieve sensitivity guidelines including data-based approaches; • New control methodologies, e.g. new controller to mitigate the high rate of change of frequency in low inertia systems; • A power converter is a fully actuated, modular, and very fast control system, which are nearly antipodal characteristics to those of a synchronous machine. Thus, one should critically reflect the control of a converter as a virtual synchronous machine; and • The lack of inertia in a power system does not need to (and cannot) be fixed by simply “adding inertia back” in the systems. This group of authors believes that these are the core scientific challenges to be addressed in low-inertia systems. There are also many important points to be made concerning issues that we only superficially touched upon such as the effects of low- inertia grids on conventional generation, voltage stability and reactive power support by converters, the economic aspects of inertia and conventional generation dispatch, as well as the role of FACTS devices, HVDC, and synchronous condensers. Ultimately, the techniques above will serve to define proper network codes and, hopefully, to increase the instantaneous penetration and the capacity credit of CIGs. Finally the authors generally advocate a more scientific approach to technical and bigger questions where analytical D. Hill is supported in Hong Kong by the Research Grants Council Theme-based Research Scheme (Project No. T23- 701/14-N). In Sydney D. Hill and G. Verbiˇ c were supported by the CSIRO University Cluster on Future Grid. The authors would like to thank their collaborators for insightful discussions and constructive feedback on an early draft of this survey. Particular thanks goes to the members of the MIGRATE consortium for many inputs and discussions, and to Uros Markovic at ETHZ; Dr ´ Alvaro Ortega in UCD; and Wenting Yi in HKU for contributing some content to a few sections of the paper. REFERENCES [1] “Global wind statistics 2017,” Global Wind Energy Council, Tech. Rep., 2018. [2] International Energy Agency (IEA), “2016 snapshot of global photo- voltaic markets,” 2017. [3] AEMO, “Update Report - Black System Event in South Australia on 28 September 2016,” Tech. Rep., 2016. [4] RG-CE System Protection & Dynamics Sub Group, “Frequency stabil- ity evaluation criteria for the synchronous zone of continental europe,” ENTSO-E, Tech. Rep., 2016. [5] Svenska Kraftn¨ at, Statnett, Fingrid and Energinet.dk, “Challenges and Opportunities for the Nordic Power System,” Tech. Rep., 2016. [6] ERCOT Concept Paper, “Future Ancillary Services in ERCOT,” Tech. Rep., 2013. [7] EirGrid and SONI, All-island Generation Capacity Statement 2017- 2026, 2017, [Online]. Available: http://www.eirgridgroup.com. [8] EirGrid and Soni, “DS3: System Services Review TSO Recommen- dations,” EirGrid, Tech. Rep., 2012. [9] M.-S. Debry, G. Denis, T. Prevost, F. Xavier, and A. Menze, “Maximiz- ing the penetration of inverter-based generation on large transmission systems: the migrate project,” in 6th Solar Integration Workshop, 2017. [10] RESERVE, 2016, [Online]. Available: https://www.re-serve.eu. [11] CSIRO, “Change and Choice-The Future Grid Forum’s analysis of Australia’s potential electrical pathways to 2050: Final Report,” Tech. Rep. December, 2013. [12] P. Tielens and D. Van Hertem, “The relevance of inertia in power systems,” Renewable and Sustainable Energy Reviews, vol. 55, pp. 999–1009, 2016. [13] W. Winter, K. Elkington, G. Bareux, and J. Kostevc, “Pushing the limits: Europe’s new grid: Innovative tools to combat transmission bottlenecks and reduced inertia,” IEEE Power and Energy Magazine, vol. 13, no. 1, pp. 60–74, 2015. [14] B. Kroposki, B. Johnson, Y. Zhang, V. Gevorgian, P. Denholm, B.-M. Hodge, and B. Hannegan, “Achieving a 100% renewable grid: Oper- CIG levels has impact on almost everything from planning to operations, modeling, stability and control, there has been a need to focus on some aspects. Inevitably there has also been some emphasis given to work in and connected to the authors’ own institutions in the areas of dynamics and control. Some emphasis has also been given to the relative roles of analytic, computational and practical aspects. The later sections contain many suggestions for further work, which can be summarized as follows: • New models are needed which balance the need to include key features without burdening the model (whether for analytical or computational work) with uneven and excessive detail; • New stability theory which properly reflects the new devices and time-scales associated with CIG, new loads and use of storage; • Further computational work to achieve sensitivity guidelines including data-based approaches; • New control methodologies, e.g. new controller to mitigate the high rate of change of frequency in low inertia systems; • A power converter is a fully actuated, modular, and very fast control system, which are nearly antipodal characteristics to those of a synchronous machine. Thus, one should critically reflect the control of a converter as a virtual synchronous machine; and • The lack of inertia in a power system does not need to (and cannot) be fixed by simply “adding inertia back” in the systems. This group of authors believes that these are the core scientific D. Hill is supported in Hong Kong by the Research Grants Council Theme-based Research Scheme (Project No. T23- 701/14-N). In Sydney D. Hill and G. Verbiˇ c were supported by the CSIRO University Cluster on Future Grid. The authors would like to thank their collaborators for insightful discussions and constructive feedback on an early draft of this survey. Particular thanks goes to the members of the MIGRATE consortium for many inputs and discussions, and to Uros Markovic at ETHZ; Dr ´ Alvaro Ortega in UCD; and Wenting Yi in HKU for contributing some content to a few sections of the paper. REFERENCES [1] “Global wind statistics 2017,” Global Wind Energy Council, Tech. Rep., 2018. [2] International Energy Agency (IEA), “2016 snapshot of global photo- voltaic markets,” 2017. [3] AEMO, “Update Report - Black System Event in South Australia on 28 September 2016,” Tech. Rep., 2016. [4] RG-CE System Protection & Dynamics Sub Group, “Frequency stabil- ity evaluation criteria for the synchronous zone of continental europe,” ENTSO-E, Tech. Rep., 2016. [5] Svenska Kraftn¨ at, Statnett, Fingrid and Energinet.dk, “Challenges and Opportunities for the Nordic Power System,” Tech. Rep., 2016. [6] ERCOT Concept Paper, “Future Ancillary Services in ERCOT,” Tech. Rep., 2013. [7] EirGrid and SONI, All-island Generation Capacity Statement 2017- 2026, 2017, [Online]. Available: http://www.eirgridgroup.com. [8] EirGrid and Soni, “DS3: System Services Review TSO Recommen- dations,” EirGrid, Tech. Rep., 2012. [9] M.-S. Debry, G. Denis, T. Prevost, F. Xavier, and A. Menze, “Maximiz- ing the penetration of inverter-based generation on large transmission Annual Review of Control, Robotics, and Autonomous Systems Stability and Control of Power Grids Tao Liu,1,∗ Yue Song,1,∗ Lipeng Zhu,1,2,∗ and David J. Hill1,3 1Department of Electrical and Electronic Engineering, University of Hong Kong, Hong Kong, China; email: [email protected], [email protected], [email protected] 2College of Electrical and Information Engineering, Hunan University, Changsha, China; email: [email protected] 3School of Electrical Engineering and Telecommunications, University of New South Wales, Kensington, New South Wales, Australia Annu. Rev. Control Robot. Auton. Syst. 2022. 5:689–716 First published as a Review in Advance on November 4, 2021 The Annual Review of Control, Robotics, and Autonomous Systems is online at control.annualreviews.org https://doi.org/10.1146/annurev-control-042820- 011148 Copyright © 2022 by Annual Reviews. All rights reserved ∗These authors contributed equally to this article Keywords power grids, stability, network systems, distributed control, machine learning, deep learning Abstract Power grids are critical infrastructure in modern society, and there are well- established theories for the stability and control of traditional power grids under a centralized paradigm. Driven by environmental and sustainability concerns, power grids are undergoing an unprecedented transition, with much more exibility as well as uncertainty brought by the growing pen- etration of renewable energy and power electronic devices. A new paradigm for stability and control is under development that uses graph-based, data- based, and distributed analysis tools. This article surveys classic and novel results on the stability and control of power grids to provide a perspective on this both old and new subject. Annu. Rev. Control Robot. Auton. Syst. 2022.5:689-716. Downloaded from www.annualreviews.org Access provided by ETH- Zurich on 01/06/23. For personal use only. 2130 IEEE JOURNAL OF EMERGING AND SELECTED TOPICS IN POWER ELECTRONICS, VOL. 7, NO. 4, DECEMBER 2019 On the Inertia of Future More-Electronics Power Systems Jingyang Fang , Student Member, IEEE, Hongchang Li , Member, IEEE, Yi Tang , Senior Member, IEEE, and Frede Blaabjerg , Fellow, IEEE Abstract—Inertia plays a vital role in maintaining the fre- quency stability of power systems. However, the increase of power electronics-based renewable generation can dramatically reduce the inertia levels of modern power systems. This issue has already challenged the control and stability of small-scale power systems. It will soon be faced by larger power systems as the trend of large-scale renewable integration continues. In view Contents lists available at ScienceDirect Electric Power Systems Research journal homepage: www.elsevier.com/locate/epsr Fundamentals of power systems modelling in the presence of converter- interfaced generation Mario Paolonea,⁎, Trevor Gauntb, Xavier Guillaudc, Marco Liserred, Sakis Meliopoulose, Antonello Montif, Thierry Van Cutsemg, Vijay Vittalh, Costas Vournasi a ÉcolePolytehcniqueFédérale de Lausanne, Distributed Electrical Systems Laboratory, Lausanne, Switzerland b University of Cape Town, Department of Electrical Engineering, Cape Town, South Africa c Univ. Lille, Arts et Metiers Institute of Technology, Centrale Lille, Yncrea Hauts-de-France, ULR 2697 - L2EP, F-59000, Lille, France d University of Kiel, Chair of Power Electronics, Kiel, Germany e Georgia Institute of Technology, School of Electrical and Computer Engineering, Atlanta, GA, United States f RWTH Aachen University, Institute for Automation of Complex Power Systems, Aachen, Germany g University of Liège, Fund for Scientific Research (FNRS), Liège, Belgium h Electric Power Systems Research 189 (2020) 106811 T O V E R V I E W Power system stability in the transition to a low carbon grid: A techno-economic perspective on challenges and opportunities Lasantha Meegahapola1 | Pierluigi Mancarella2,3 | Damian Flynn4 | Rodrigo Moreno5,6,7 1RMIT University, Melbourne, Australia 2The University of Melbourne, Melbourne, Australia 3The University of Manchester, Manchester, UK 4University College Dublin, Dublin, Ireland 5The University of Chile, Santiago, Chile 6Instituto Sistemas Complejos de Ingeniería, Santiago, Chile 7Imperial College London, London, UK Correspondence Lasantha Meegahapola, RMIT University, Melbourne, Australia. Email: lasantha.meegahapola@rmit. edu.au Edited by: Peter Lund, Co-Editor-in- Chief Abstract Increasing power system stability challenges are being witnessed worldwide, while transitioning toward low-carbon grids with a high-share of power elec- tronic converter (PEC)-interfaced renewable energy sources (RESs) and distrib- uted energy resources (DERs). Concurrently, new technologies and operational strategies are being implemented or proposed to tackle these chal- lenges. Since electricity grids are deregulated in many jurisdictions, such tech- nologies need to be integrated within a market framework, which is often a challenge in itself due to inevitable regulatory delays in updating grid codes and market rules. It is also highly desirable to ensure that an economically fea- sible optimal technology mix is integrated in the power system, without impos- ing additional burdens on electricity consumers. This article provides a comprehensive overview of emerging power system stability challenges posed by PEC-interfaced RES and DER, particularly related to low inertia and low system strength conditions, while also introducing new technologies that can help tackle these challenges and discussing the need for suitable techno- economic considerations to integrate them into system and market operation. As a key point, the importance of recognizing the complexity of system ser- vices to guarantee stability in low-carbon grids is emphasized, along with the Received: 1 September 2020 Revised: 1 February 2021 Accepted: 8 March 2021 DOI: 10.1002/wene.399 2041840x, 2021, 5, Downloaded from https://wires.onlinelibrary.wiley.com/doi/10.1002/wene.399 by Eth Zürich Eth-Bibliothek, Wiley Online Library on [06/01/2023]. See the Terms and Conditions (https://onlinelibrary.wiley.com/terms-and-conditions) on W (~ 10 years ago) AS06CH01_Dor er ARjats.cls September 14, 2022 15:9 Annual Review of Control, Robotics, and Autonomous Systems Control of Low-Inertia Power Systems Florian Dör er1 and Dominic Groß2 1Automatic Control Laboratory, ETH Zurich, Zurich, Switzerland; email: dor [email protected] 2Department of Electrical and Computer Engineering, University of Wisconsin–Madison, Madison, Wisconsin, USA; email: [email protected] Annu. Rev. Control Robot. Auton. Syst. 2023. 6:1.1–1.31 The Annual Review of Control, Robotics, and Autonomous Systems is online at control.annualreviews.org https://doi.org/10.1146/annurev-control-052622- 032657 Copyright © 2023 by the author(s). Keywords power systems control, power electronics control, low-inertia systems, grid-forming control, dynamic virtual power plant Abstract Electric power systems are undergoing an unprecedented transition from fossil fuel–based power plants to low-inertia systems that rely predominantly nnu. Rev. Control Robot. Auton. Syst. 2023.6. Downloaded from www.annualreviews.org Access provided by ETH- Zurich on 01/06/23. For personal use only. Power systems without fuel Josh A. Taylor a,n, Sairaj V. Dhople b,1, Duncan S. Callaway c a Electrical and Computer Engineering, University of Toronto, Toronto, Canada ON M5S 3G4 b Contents lists available at ScienceDirect journal homepage: www.elsevier.com/locate/rser Renewable and Sustainable Energy Reviews Renewable and Sustainable Energy Reviews 57 (2016) 1322–1336 Early insights: re-visit models / analysis / control 7 I stopped collecting surveys five years ago… 1. some problems were solved, 2. some were non-problems, & 3. others are still open or … just got on our radar recently
  8. control of grid-connected IBRs 8 - grid-following: inject power at

    the grid frequency & voltage (open: subsync oscillations) - how to provide services with batteries behind the inverter (open: if there is no battery…) - grid-forming control: be yourself the pacemaker (open: ensuring current limits) control Problems that got attention & are mostly resolved
  9. IMHO: misguided directions 🧐 9 • virtual inertia as a

    stability metric to be monitored, commodity to be procured, … • address stability challenges by market products & patch issues with new products • hardware solutions (batteries & flywheels) for basic automation/control problems → targeting symptoms not causes → proliferation of services/patches → stability is not a commodity → brute force & not economic very short sighted 🧐 <latexit sha1_base64="Kj66Ui4xb5LWB3yTPwz9RwqrQDM=">AAAD13icdVLLbtQwFHUnPEp4tbBkEzGqxAKNElQVluUhxLI8pi2aRCPHuelY9SPYzrSDZbFDLNiwgN/hO/gbnJkpIjOpJStH555777k3zitGtYnjPxu94MrVa9c3b4Q3b92+c3dr+96hlrUiMCSSSXWcYw2MChgaahgcVwowzxkc5acvm/jRFJSmUnwwswoyjk8ELSnBxlPvUjfe6seDeH6idZAsQR8tz8F4u/c7LSSpOQhDGNZ6lMSVySxWhhIGLkxrDRUmp/gERh4KzEE/Lqa00nOY2blrF+34YBGVUvkrTDRn/0+2mGs947lXcmwmejXWkF2xUW3KZ5mloqoNCLJoVNYsMjJqVhAVVAExbOYBJop62xGZYIWJ8YtqdTnDeuYttGayTUMjJdOu21H3DG2a6E+1NLBeolmFXu+ndNnBFnJVW8wLtLnz0o/mwnAnmvqxZTPiK/B/TsF770yy1z7D5h4Uzg7dBeLOCtehfM6qCc7B2LRxsBQvPmEq4IxIzrEobKoprxicu1GSWV+GGTy2/cStqBpLC8m/cpeopJLCL8xrR9mCsYm7rKRUn0HJtjq+UPsnn6w+8HVw+GSQ7A323u72918sH/8meoAeokcoQU/RPnqDDtAQEVSi7+gn+hV8DL4EX4NvC2lvY5lzH7VO8OMvJJVP1w==</latexit> }
  10. Outline: a personal journey through the field 11 • introduction

    • old problems we can put aside for now • new problems that should receive attention - interoperability & grid codes - services from distributed generation - data-driven decision making • conclusions
  11. My current research program 12 Apply data-driven / learning methods

    to identify & control grid-connected IBRs Interface specifications / grid codes for modular stability certificates & service provision Pooling & decentralized coordination of distributed renewable sources for services ancillary services models vs data interoperability organized & analog wild west & digital
  12. Interoperability & grid codes 13 fact: every vendor implement its

    favorite version how an IBR interfaces with the grid → available grid codes are lagging behind • formulated for grid-following IBRs • open-loop step response formulations • … have zero implications on stability Example: FCR capability curve (EU 2016/631) for active power injection after frequency drop From grid codes to feasible transfer functions translate piece-wise linear time-domain grid code curves into parametric transfer functions !p(s) !q(s) = T fp des (s, ωfp) 0 0 T vq des (s, ωvq) = Tdes(s,ω) !f(s) !v(s) →↑ parameters ω need to satisfy grid code requirements & device-level constraints superposition of di!erent ancillary services T fp des (s, ωfp) = Tfcr des (s, ωfcr) FCR + T!r des (s, ω!r) FFR + ... | !p| t tfcr a | !pfcr| tfcr i admissible response laziest possible response Example: FCR Capability Curve (EU 2016/631) • active power capability curve after frequency drop • parameterized by time constants ωfcr := [tfcr i , tfcr a • grid code requirements on FCR capacity | !pfcr| 0 ↓ tfcr i ↓ tfcr i,max & tfcr i ↓ tfcr a ↓ tfcr a,max • device-level ramping rate constraint | !pfcr| ↓ tfcr a → tfcr i · r p max Goal: optimize response over ω & grid perception → → → → next generation grid codes should be • specifying closed-loop behaviors • apply to grid-following & grid-forming IBRs • modular certificates for stability & services • non-invasive “constraints that deconstrain” resurrect frequency domain methods <latexit sha1_base64="Kj66Ui4xb5LWB3yTPwz9RwqrQDM=">AAAD13icdVLLbtQwFHUnPEp4tbBkEzGqxAKNElQVluUhxLI8pi2aRCPHuelY9SPYzrSDZbFDLNiwgN/hO/gbnJkpIjOpJStH555777k3zitGtYnjPxu94MrVa9c3b4Q3b92+c3dr+96hlrUiMCSSSXWcYw2MChgaahgcVwowzxkc5acvm/jRFJSmUnwwswoyjk8ELSnBxlPvUjfe6seDeH6idZAsQR8tz8F4u/c7LSSpOQhDGNZ6lMSVySxWhhIGLkxrDRUmp/gERh4KzEE/Lqa00nOY2blrF+34YBGVUvkrTDRn/0+2mGs947lXcmwmejXWkF2xUW3KZ5mloqoNCLJoVNYsMjJqVhAVVAExbOYBJop62xGZYIWJ8YtqdTnDeuYttGayTUMjJdOu21H3DG2a6E+1NLBeolmFXu+ndNnBFnJVW8wLtLnz0o/mwnAnmvqxZTPiK/B/TsF770yy1z7D5h4Uzg7dBeLOCtehfM6qCc7B2LRxsBQvPmEq4IxIzrEobKoprxicu1GSWV+GGTy2/cStqBpLC8m/cpeopJLCL8xrR9mCsYm7rKRUn0HJtjq+UPsnn6w+8HVw+GSQ7A323u72918sH/8meoAeokcoQU/RPnqDDtAQEVSi7+gn+hV8DL4EX4NvC2lvY5lzH7VO8OMvJJVP1w==</latexit> }
  13. Grid codes for stability 14 for stability there is an

    obvious & proven method that guides the way: passivity - converters & grids per se not passive - bigger guns: passivity with MIMO multipliers, IQC, SRG, DW shell, … - frequency/voltage performance specs map to space of control parameters → !pd !qd !ω !|v| !ωd !|v|d device dynamics network dynamics * * * … * * * * * * … * * * * *
  14. Grid codes for services 15 translate old step response grid

    codes to reference behavior in frequency domain a systematic way to provide dynamic er-based generation systems, which en- d device-level requirements are reliably slate the piece-wise linear time-domain reactive power provision into a desired ix in the frequency domain, which de- avior to be realized by the converter. d control structure of power converters ng active and reactive power reference her include a reference model as given n, and thus enables a simple matching od is versatile to match any piece-wise curve, and thus also allows for more ns in the future, e.g., to address grid- that, our results might even inspire a a way that there will be an immediate tion of future grid codes specified in the pecifications rid-code specifications for dynamic fre- in grid-following converters (i.e., re- lly defined by means of a prescribed aracteristic [1–3]. Different schematic ecifications are depicted in Fig. 1 and Fig. 1. Examples of piece-wise linear time-domain capability curves to provide dynamic ancillary services in different grid codes (simplified). Example 2 — Voltage control Likewise, as illustrated in Fig. 1(b), the European network code defines the dynamic activation of a certain reactive power capacity in response to a voltage step change, where the normalized reactive power capacity levels ⌋𝜔𝜕n 90 ⌋ of 90% and ⌋𝜔𝜕n 100 ⌋ of 100% have to be achieved in accordance with the times 𝜗vq 90 and 𝜗vq 100 , respectively. The normalized reactive power capacity levels are conventionally given by the allocated reactive power droop gain 𝜛 q > 0 during a unit voltage step change ⌋𝜔𝛻⌋ = 1 p.u. as ⌋𝜔𝜕n 100 ⌋ ω= 1 𝜛 q ⌋𝜔𝛻⌋ = 1 𝜛 q and ⌋𝜔𝜕n 90 ⌋ = 0.9 ⋛ ⌋𝜔𝜕n 100 ⌋, while the time parameters 𝜗vq 90 and 𝜗vq 100 have to satisfy the following grid-code In this section, we present a general procedure on how to translate a piece-wise linear step-response capability curve which is specified in the time domain into a rational parametric transfer function in the frequency domain. Our approach is based on the assumption that the time-domain curve reflects a stable step-response behavior 𝜛(𝜚) under a unit step input 𝜍(𝜚) = 𝜍 step = 1. Moreover, each curve kink is assumed to be characterized by a time-capacity parameter pair (𝜚𝜑 , 𝜛𝜑), 𝜑 ω N, where the normalized capacity 𝜛𝜑 = 𝛻𝜑 𝜍 step = 𝛻𝜑 is scaled by the unit step input via some gain 𝛻𝜑 ω R (cf. the droop gains introduced in Section 2). For ease of translation, we consider a unit-step response (𝜍 step = 1). A general representation of a normalized piece-wise linear time-domain response curve with a similar shape as the one in Fig. 1(d) is illustrated in Fig. 2(a). The procedure to obtain a rational transfer function representation of such a piece-wise linear time-domain response curve, consists of four steps: In a first step, we decompose the overall piece-wise linear time-domain response curve 𝜛(𝜚) in Fig. 2(a) into linear curve segments 𝜛𝜑𝜕(𝜚), 𝜑, 𝜕 ω N as indicated in Fig. 2(b). Each unit step response curve segment 𝜛𝜑𝜕(𝜚) is characterized by two time-capacity parameter pairs (𝜚𝜑 , 𝜛𝜑) and (𝜚𝜕 , 𝜛𝜕), where 𝜕 > 𝜑 and thus 𝜚𝜕 > 𝜚𝜑 , such that the curve segment can be described in the time domain as 𝜛𝜑𝜕(𝜚) = ⌋ ⌈ ⌉ ⌈ { 𝜛𝜕 ε𝜛𝜑 𝜚𝜕 ε𝜚𝜑 𝜚 + 𝜛𝜑 𝜚𝜑 ∱ 𝜚 ∱ 𝜚𝜕 0 else, (7) where we define ℵ = 𝜛𝜕 ε𝜛𝜑 𝜚𝜕 ε𝜚𝜑 as the slope of the curve segment. Obviously, depending on the capacities 𝜛𝜑 and 𝜛𝜕 , the curve segment is either increasing for 𝜛𝜕 > 𝜛𝜑 (i.e., ℵ > 0), decreasing for 𝜛𝜕 < 𝜛𝜑 (i.e., ℵ < 0), or flat for 𝜛𝜕 = 𝜛𝜑 (i.e., ℵ = 0). Fig. 2. Normalized unit step response time grid-code specification with linear curve segm Fig. 3. Unit step response of the rational transf for different orders ⊲ of the Padé-approximatio which approximates (9) as a rational ⊳ uy 𝜑𝜕 (ℶ)ϑ } 𝜛𝜑+ ℵ ℶ ⦃ ⦄ 1ε 𝜚𝜑 2⊲ ℶ ⟨⊲ ⦄ 1+ 𝜚𝜑 2⊲ ℶ ⟨⊲ ε } 𝜛𝜕 + ℵ ℶ ⦃ ⦄ 1ε ⦄ 1+ Alternatively, one might also resort approximations or other rational serie Finally, in a fourth step, the overal normalized piece-wise linear time-dom curve in Fig. 2(a) can be established a functions of the linear curve segme ⟩ ⊳ uy 𝜑𝜕 (ℶ). Notice that the obtained tran FCR+FFR responses from EU grid codes response by reference models of different order - readily implementable in IBR controls - amenable to analysis & optimal design grid-forming codes: what is it anyways? worth mentioning that the FI of PLL-GFM demonstrates that PLL-based converters can also exhibit voltage source behavior, making it debatable whether PLL is used as a criterion to distinguish GFM and GFL. In addition, the voltage dynamics of VOC also cause its FI > 1 at low frequencies. inition, including VOC, VSG, droop control (Droop), vol forming control (VFC) [10], reactive power control base PLL (PLL-PQ), AC voltage control based on PLL (PLL and current vector GFM control based on PLL (PLL-G [4], respectively. The results of FIs are shown in Fig.1. It is evident that all FIs of the so-called GFM conve (Droop, VSG, PLL-GFM, VOC, VFM) are equal to 1 at frequencies as specified due to synchronization, but dem strate characteristic roll-off behavior and are less than 1 i high-frequency range, indicating that they exhibit GFM voltage source behavior on (sub)transient time scales, w is aligned with the description in the NERC report [5]. worth mentioning that the FI of PLL-GFM demonstrates PLL-based converters can also exhibit voltage source beha making it debatable whether PLL is used as a criterio distinguish GFM and GFL. In addition, the voltage dyna of VOC also cause its FI > 1 at low frequencies. PLL (PLL-PQ), AC voltage cont and current vector GFM control [4], respectively. The results of F It is evident that all FIs of th (Droop, VSG, PLL-GFM, VOC, frequencies as specified due to strate characteristic roll-off behav high-frequency range, indicating voltage source behavior on (sub is aligned with the description i worth mentioning that the FI of PLL-based converters can also ex making it debatable whether PL distinguish GFM and GFL. In ad of VOC also cause its FI > 1 a Fig. 1. Forming Index of different contr and current vector GF [4], respectively. The It is evident that al (Droop, VSG, PLL-G frequencies as specifi strate characteristic ro high-frequency range, voltage source behavi is aligned with the de worth mentioning that PLL-based converters making it debatable w distinguish GFM and of VOC also cause its Fig. 1. Forming Index of d behaves as an ideal voltage source at this fre We use different control methods for valid inition, including VOC, VSG, droop control forming control (VFC) [10], reactive power PLL (PLL-PQ), AC voltage control based o and current vector GFM control based on P [4], respectively. The results of FIs are sho It is evident that all FIs of the so-called (Droop, VSG, PLL-GFM, VOC, VFM) are frequencies as specified due to synchroniza strate characteristic roll-off behavior and are high-frequency range, indicating that they e voltage source behavior on (sub)transient tim is aligned with the description in the NERC worth mentioning that the FI of PLL-GFM PLL-based converters can also exhibit voltage making it debatable whether PLL is used distinguish GFM and GFL. In addition, the of VOC also cause its FI > 1 at low freque - forming index (FI): sensitivity of IBR frequency/voltage to disturbances - system strength: sensitivity of grid bus voltages to disturbances ≈ SCR fact: system strength = monotone function of FI grid-forming grid-following if it’s the answer, what’s the question?
  15. Ancillary services & DVPP 16 fact: distributed renewable sources cannot

    provide fast ancillary services due to limited capabilities: response time / power / energy idea: coordinate heterogeneous assets in a Dynamic Virtual Power Plant (DVPP) to provide dynamic ancillary services DER 1 DER ! ⋮ ≈ desired aggregate behavior DVPP broadcast input signal aggregate output signal requires pooling of assets & characterizing their capabilities by dynamic participation factors Power Plants (DVPP) mble of DERs to collectively provide dynamic ancillary services OBJECTIVE: provide dynamic ancillary services specified as a desired aggregate I/O behavior ≈ 4/23 on: Dynamic Virtual Power Plants (DVPP) dinate a heterogeneous ensemble of DERs to collectively provide dynamic ancillary services OBJECTIVE: provide dynamic ancillary services specified as a desired aggregate I/O behavior ≈ =
  16. One possible DVPP design pipeline 17 grid code for DVVP

    specs I/O map specifying desired aggregate DVPP behavior disaggregation: filtering by participation factors tracking with local matching control control control control - + - + - + . 1. Examples of piece-wise linear time-domain capability curves to provide dynamic cillary services in different grid codes (simplified). ample 2 — Voltage control Likewise, as illustrated in Fig. 1(b), the European network code fines the dynamic activation of a certain reactive power capacity in sponse to a voltage step change, where the normalized reactive power pacity levels  qn 90  of 90% and  qn 100  of 100% have to be achieved accordance with the times tvq 90 and tvq 100 , respectively. The normalized active power capacity levels are conventionally given by the allocated active power droop gain D q > 0 during a unit voltage step change v = 1 p.u. as  qn 100  := 1 D q  v = 1 D q and  qn 90  = 0.9  qn 100 , while c Power Systems Research 234 (2024) 110760 active power reactive power time time required capacity peak power 100% 90% European grid-code specifications for fast active (resp., reactive) power response after steps in frequency (resp., voltage) translation into linear time-invariant input/ output behaviors frequency amplitude frequency amplitude frequency amplitude filtering by dynamic participation factors <latexit sha1_base64="64bpFZyHtYcm9o6yZijdcVGw8Uk=">AAAEJXicdVLLbhMxFHUbHiW8UliysYgqIYGiGVQFNkjlIcQKFUHaSpkh8njuNFY99tT25IHl7+EH2PMF7BASbFjAh+BJ0opJUkujOT733KdvUnCmTRD83NhsXLp85erWteb1Gzdv3W5t3znQslQUelRyqY4SooEzAT3DDIejQgHJEw6HycnLyn44AqWZFB/MtIA4J8eCZYwS46lB622UKUJtZGBiLKGGjQAXcgzKuQWZKTgtQdCpc/gZnsv1x138EEepNNr5S/f8Mmi1g04wO3gVhAvQRouzP9je/Oo9aZmDMJQTrfthUJjYEmUY5eCaUamhIPSEHEPfQ0Fy0I/SESv0DMZ2NgOHd7wxxZlU/hMGz9j/nS3JtZ7miVfmxAz1sq0i19n6pcmexpaJojR+CvNEWcmxkbgaKE6ZAmr41ANCFfNlYzokfkrGj72WZUz01JdQ68lWCY2UXLv1Fa3voU5TfVpKA6shqlHo1XxKZ2vY2QPW2HQWoM5NqgVwzeYOHvm2ZdXiK/Avp+C9r0zy197DJh6kzvbcGcqdFW6N8jkvhiQBY6OqgoV4/mtGAsZU5jkRqY00ywsOE9cPY+vDcEMGth26JVVV0lxyHu4ClVRS+IF5bT+eMzZ0F4WU6hMoWVcHZ2q/8uHygq+Cg8edsNvpvttt771YLP8WuofuowcoRE/QHnqD9lEPUfQF/UJ/0N/G58a3xvfGj7l0c2PhcxfVTuP3PzfmcE8=</latexit> active power frequency = s4 + . . . s6 + . . . <latexit sha1_base64="nvPL48t6t5JL3ckEdK4jy4Y8Xgg=">AAAEJXicdVLLbtQwFHVneJThNYUlG4tRJSTQKKmqwgapPIRYoSKYttIkjBznpmPViYPtzAPL38MPsOcL2CEk2LCAD8FJphWZmVqKcnzuuU/fKOdMac/7udFqX7p85ermtc71Gzdv3e5u3TlUopAUBlRwIY8jooCzDAaaaQ7HuQSSRhyOotMXpf1oAlIxkb3X8xzClJxkLGGUaEeNum+CRBJqAg0zbZwj1WwCOBdTkNYu6IngmpyAtfgpruXqww5+iINYaGXdZff8Mur2vL5XHbwK/AXoocU5GG21vjpPWqSQacqJUkPfy3VoiNSMcrCdoFCQE3rqChg6mJEU1KN4wnJVwdBUM7B42xljnAjpvkzjiv3f2ZBUqXkaOWVK9Fgt20pynW1Y6ORJaFiWFxoyWidKCo61wOVAccwkUM3nDhAqmSsb0zFxU9Ju7I0sU6LmroRGT6ZMqIXgyq6vaH0PTZqqj4XQsBqiHIVazSdVsoatHrDBxlWAJjcrF8B2Ott44toWZYsvwb2chHeuMsFfOQ8TORBbM7BnKLUms2uUz3g+JhFoE5QVLMT1rxNkMKUiTUkWm0CxNOcws0M/NC6MW8iR6fl2SVWWVEvOw12gElJkbmBOOwxrxvj2opBCfgIpmmrvTO1W3l9e8FVwuNP39/p7b3d7+88Xy7+J7qH76AHy0WO0j16jAzRAFH1Bv9Af9Lf9uf2t/b39o5a2NhY+d1HjtH//AwndcEI=</latexit> reactive power voltage = s2 + . . . s4 + . . . <latexit sha1_base64="Kj66Ui4xb5LWB3yTPwz9RwqrQDM=">AAAD13icdVLLbtQwFHUnPEp4tbBkEzGqxAKNElQVluUhxLI8pi2aRCPHuelY9SPYzrSDZbFDLNiwgN/hO/gbnJkpIjOpJStH555777k3zitGtYnjPxu94MrVa9c3b4Q3b92+c3dr+96hlrUiMCSSSXWcYw2MChgaahgcVwowzxkc5acvm/jRFJSmUnwwswoyjk8ELSnBxlPvUjfe6seDeH6idZAsQR8tz8F4u/c7LSSpOQhDGNZ6lMSVySxWhhIGLkxrDRUmp/gERh4KzEE/Lqa00nOY2blrF+34YBGVUvkrTDRn/0+2mGs947lXcmwmejXWkF2xUW3KZ5mloqoNCLJoVNYsMjJqVhAVVAExbOYBJop62xGZYIWJ8YtqdTnDeuYttGayTUMjJdOu21H3DG2a6E+1NLBeolmFXu+ndNnBFnJVW8wLtLnz0o/mwnAnmvqxZTPiK/B/TsF770yy1z7D5h4Uzg7dBeLOCtehfM6qCc7B2LRxsBQvPmEq4IxIzrEobKoprxicu1GSWV+GGTy2/cStqBpLC8m/cpeopJLCL8xrR9mCsYm7rKRUn0HJtjq+UPsnn6w+8HVw+GSQ7A323u72918sH/8meoAeokcoQU/RPnqDDtAQEVSi7+gn+hV8DL4EX4NvC2lvY5lzH7VO8OMvJJVP1w==</latexit> } assignment as implementable power references to IBR controls control control control - + - + - + . 1. Examples of piece-wise linear time-domain capability curves to provide dynamic cillary services in different grid codes (simplified). ample 2 — Voltage control Likewise, as illustrated in Fig. 1(b), the European network code fines the dynamic activation of a certain reactive power capacity in sponse to a voltage step change, where the normalized reactive power pacity levels  qn 90  of 90% and  qn 100  of 100% have to be achieved accordance with the times tvq 90 and tvq 100 , respectively. The normalized active power capacity levels are conventionally given by the allocated active power droop gain D q > 0 during a unit voltage step change v = 1 p.u. as  qn 100  := 1 D q  v = 1 D q and  qn 90  = 0.9  qn 100 , while c Power Systems Research 234 (2024) 110760 active power reactive power time time required capacity peak power 100% 90% European grid-code specifications for fast active (resp., reactive) power response after steps in frequency (resp., voltage) translation into linear time-invariant input/ output behaviors frequency amplitude frequency amplitude frequency amplitude filtering by dynamic participation factors <latexit sha1_base64="64bpFZyHtYcm9o6yZijdcVGw8Uk=">AAAEJXicdVLLbhMxFHUbHiW8UliysYgqIYGiGVQFNkjlIcQKFUHaSpkh8njuNFY99tT25IHl7+EH2PMF7BASbFjAh+BJ0opJUkujOT733KdvUnCmTRD83NhsXLp85erWteb1Gzdv3W5t3znQslQUelRyqY4SooEzAT3DDIejQgHJEw6HycnLyn44AqWZFB/MtIA4J8eCZYwS46lB622UKUJtZGBiLKGGjQAXcgzKuQWZKTgtQdCpc/gZnsv1x138EEepNNr5S/f8Mmi1g04wO3gVhAvQRouzP9je/Oo9aZmDMJQTrfthUJjYEmUY5eCaUamhIPSEHEPfQ0Fy0I/SESv0DMZ2NgOHd7wxxZlU/hMGz9j/nS3JtZ7miVfmxAz1sq0i19n6pcmexpaJojR+CvNEWcmxkbgaKE6ZAmr41ANCFfNlYzokfkrGj72WZUz01JdQ68lWCY2UXLv1Fa3voU5TfVpKA6shqlHo1XxKZ2vY2QPW2HQWoM5NqgVwzeYOHvm2ZdXiK/Avp+C9r0zy197DJh6kzvbcGcqdFW6N8jkvhiQBY6OqgoV4/mtGAsZU5jkRqY00ywsOE9cPY+vDcEMGth26JVVV0lxyHu4ClVRS+IF5bT+eMzZ0F4WU6hMoWVcHZ2q/8uHygq+Cg8edsNvpvttt771YLP8WuofuowcoRE/QHnqD9lEPUfQF/UJ/0N/G58a3xvfGj7l0c2PhcxfVTuP3PzfmcE8=</latexit> active power frequency = s4 + . . . s6 + . . . <latexit sha1_base64="nvPL48t6t5JL3ckEdK4jy4Y8Xgg=">AAAEJXicdVLLbtQwFHVneJThNYUlG4tRJSTQKKmqwgapPIRYoSKYttIkjBznpmPViYPtzAPL38MPsOcL2CEk2LCAD8FJphWZmVqKcnzuuU/fKOdMac/7udFqX7p85ermtc71Gzdv3e5u3TlUopAUBlRwIY8jooCzDAaaaQ7HuQSSRhyOotMXpf1oAlIxkb3X8xzClJxkLGGUaEeNum+CRBJqAg0zbZwj1WwCOBdTkNYu6IngmpyAtfgpruXqww5+iINYaGXdZff8Mur2vL5XHbwK/AXoocU5GG21vjpPWqSQacqJUkPfy3VoiNSMcrCdoFCQE3rqChg6mJEU1KN4wnJVwdBUM7B42xljnAjpvkzjiv3f2ZBUqXkaOWVK9Fgt20pynW1Y6ORJaFiWFxoyWidKCo61wOVAccwkUM3nDhAqmSsb0zFxU9Ju7I0sU6LmroRGT6ZMqIXgyq6vaH0PTZqqj4XQsBqiHIVazSdVsoatHrDBxlWAJjcrF8B2Ott44toWZYsvwb2chHeuMsFfOQ8TORBbM7BnKLUms2uUz3g+JhFoE5QVLMT1rxNkMKUiTUkWm0CxNOcws0M/NC6MW8iR6fl2SVWWVEvOw12gElJkbmBOOwxrxvj2opBCfgIpmmrvTO1W3l9e8FVwuNP39/p7b3d7+88Xy7+J7qH76AHy0WO0j16jAzRAFH1Bv9Af9Lf9uf2t/b39o5a2NhY+d1HjtH//AwndcEI=</latexit> reactive power voltage = s2 + . . . s4 + . . . <latexit sha1_base64="Kj66Ui4xb5LWB3yTPwz9RwqrQDM=">AAAD13icdVLLbtQwFHUnPEp4tbBkEzGqxAKNElQVluUhxLI8pi2aRCPHuelY9SPYzrSDZbFDLNiwgN/hO/gbnJkpIjOpJStH555777k3zitGtYnjPxu94MrVa9c3b4Q3b92+c3dr+96hlrUiMCSSSXWcYw2MChgaahgcVwowzxkc5acvm/jRFJSmUnwwswoyjk8ELSnBxlPvUjfe6seDeH6idZAsQR8tz8F4u/c7LSSpOQhDGNZ6lMSVySxWhhIGLkxrDRUmp/gERh4KzEE/Lqa00nOY2blrF+34YBGVUvkrTDRn/0+2mGs947lXcmwmejXWkF2xUW3KZ5mloqoNCLJoVNYsMjJqVhAVVAExbOYBJop62xGZYIWJ8YtqdTnDeuYttGayTUMjJdOu21H3DG2a6E+1NLBeolmFXu+ndNnBFnJVW8wLtLnz0o/mwnAnmvqxZTPiK/B/TsF770yy1z7D5h4Uzg7dBeLOCtehfM6qCc7B2LRxsBQvPmEq4IxIzrEobKoprxicu1GSWV+GGTy2/cStqBpLC8m/cpeopJLCL8xrR9mCsYm7rKRUn0HJtjq+UPsnn6w+8HVw+GSQ7A323u72918sH/8meoAeokcoQU/RPnqDDtAQEVSi7+gn+hV8DL4EX4NvC2lvY5lzH7VO8OMvJJVP1w==</latexit> } assignment as implementable power references to IBR controls
  17. DVPP demo implementation 18 SG resisitve load unit grid acquisition

    module MC220 CPU FC 1 ASM SG PLC FC 2 FC 3 main power supply ASM PCC pconv p pconv s p pconv w fref grid pv statcom wind 49.8 50 50.2 0.45 0.5 0.55 0.26 0.28 0.3 0.32 0.34 -0.05 0 0.05 0 5 10 15 20 25 30 0.18 0.2 0.22 wind desired desired desired statcom pv sum desired with DVPP without DVPP p | Copenhagen, Denmark | 26–28 September 2023 for sign i → lds: (5) that con- wer the egy, VPP ocal t to con- tion Table 1 List of notation for the DVPP control concept in [2]. Description Symbol Wind generation system index w PV generation system index p STATCOM system index s DVPP unit index i → {w, p, s} i Measured bus frequency deviation at the PCC !fpcc Local active power deviation output of unit i !pi Local closed-loop transfer function of unit i Ti (s) Desired DVPP transfer function for f-p control Tdes(s) Desired droop coefficient D Time constant for desired droop control ω DPF of unit i mi (s) (Possibly time-varying) dc gain of unit i µi Time constant for the roll-off frequency of unit i ωi 10-2 10-1 100 101 102 103 0.2 0.4 0.6 0.8 1 Fig. 3 Magnitude Bode plots of the selected DPFs for the wind, the PV and the STATCOM during nominal capacity conditions. wind pv statcom sum many variations: forming, adaptive, … proposed in new European grid code (3/5/2024)
  18. Data-driven methods 19 fact: detailed power system dynamics models exist

    only in academic textbooks models & data are proprietary & siloed ever more so with distributed generation “we cannot reproduce these oscillations in our simulator… let alone mitigate them” + → vdc Lf,1 PWM VSC abc DQ uref c,abc wideband excitation signal injection Cf ωpll abc DQ ic,abc PLL ic,D ic,Q ωpll DQ-current vc,abc control iref c,D uref c,Q uref c,D iref c,Q impedance identification Zg(s) iabc three-phase grid PCC Lf,2 measurement noise vabc abc dq vdq idq ωg Fig. 3: One-line diagram of three-phase grid-connected power converter system used for wideband excitation and grid impedance identification. The proposed approach can be also applied to other type of converter controls. Zg(s) converter dynamics excitation grid !idq !vdq impedance Fig. 4: Small-signal block diagram of grid impedance identification problem. (VSC) with IGBT switches, and connected to the power grid at the PCC via an LCL filter. In the control scheme of the re th at co th no th ex im di es ex to en a be of sy be an fle th pr Se let the data speak for system ID, fault diagnosis, control design & adaptation, & stability monitoring → impedance / admittance models for grid / devices Zg(s) three-phase grid R1 C2 R2 L2 C2 R3 L3 C3 PCC infinite bus Fig. 3. One-line diagram of the three-phase grid used in the simulation. 10 1 10 3 →20 0 Frequency [kHz] Magnitude [dB] |Zdd (jω)| = |Zqq(jω)| 10 1 10 3 →40 →20 0 |Zdq (jω)| = |Zqd (jω)| Fig. 4. Magnitude frequency response of the true equivalent impedance Zg(s)
  19. Benefits of having good impedance models 20 benefits: monitor strength

    indicators (e.g., SCR or inertia), identify resonances, detect faults, build DLLs, design & adapt controls Case study II • oscillatory grid with weakly-damped inter-area modes • sequentially apply P&O strategy for both units • initial situation: cheap ancillary services by both units 1 6 2 SG 1 SG 2 5 reserve unit 1 G1 (s) 12 G2 (s) 11 3 9 8 SG 4 10 SG 3 4 13 reserve unit 2 0 10 20 30 40 50 -0.5 -0.4 -0.3 -0.2 -0.1 0 0.1 0 10 20 30 40 50 -0.015 -0.01 -0.005 0 0.005 0.01 0.015 0.02 0.025 cheap 1 & cheap 2 optimal 1 & cheap 2 optimal 1 & optimal 2 cheap 1 & cheap 2 optimal 1 & cheap 2 optimal 1 & optimal 2 significant improvement of the closed-loop system behavior after first & second P&O cycle during a load increase at bus 7 -100 -50 0 -50 0 10 0 10 2 100 200 300 10 0 10 2 400 500 600 -40 -20 0 20 -20 -10 0 10 0 10 2 0 200 400 10 0 10 2 300 350 400 reference identified G1 (s) inter-area mode Case study II • oscillatory grid with weakly-damped inter-area modes • sequentially apply P&O strategy for both units • initial situation: cheap ancillary services by both units 1 6 2 SG 1 SG 2 5 reserve unit 1 G1 (s) 12 G 9 8 10 13 0 10 20 30 40 50 -0.5 -0.4 -0.3 -0.2 -0.1 0 0.1 0 10 20 30 40 50 -0.015 -0.01 -0.005 0 0.005 0.01 0.015 0.02 0.025 cheap 1 & cheap 2 optimal 1 & cheap 2 optimal 1 & optimal 2 cheap 1 & cheap 2 optimal 1 & cheap 2 optimal 1 & optimal 2 -100 -50 0 -50 0 10 0 10 2 100 200 300 10 0 400 500 600 -20 0 20 0 G1 (s) inter-area mode naïve perceive & optimize pipeline: - identify locally perceived grid model - local model-based control design
  20. Challenges in practice In theory, theory & practice are the

    same. In practice, … ID of impedances is tough! - closed-loop ID & multi-agent issues - ambient signals are non-informative - active excitation: only weak & short - nonlinear, time-varying, & noise - small windows, slow sampling, … → non-trivial SysID & signal processing real grid operation data --- ETFE --- PEM both are poor fits <latexit sha1_base64="Kj66Ui4xb5LWB3yTPwz9RwqrQDM=">AAAD13icdVLLbtQwFHUnPEp4tbBkEzGqxAKNElQVluUhxLI8pi2aRCPHuelY9SPYzrSDZbFDLNiwgN/hO/gbnJkpIjOpJStH555777k3zitGtYnjPxu94MrVa9c3b4Q3b92+c3dr+96hlrUiMCSSSXWcYw2MChgaahgcVwowzxkc5acvm/jRFJSmUnwwswoyjk8ELSnBxlPvUjfe6seDeH6idZAsQR8tz8F4u/c7LSSpOQhDGNZ6lMSVySxWhhIGLkxrDRUmp/gERh4KzEE/Lqa00nOY2blrF+34YBGVUvkrTDRn/0+2mGs947lXcmwmejXWkF2xUW3KZ5mloqoNCLJoVNYsMjJqVhAVVAExbOYBJop62xGZYIWJ8YtqdTnDeuYttGayTUMjJdOu21H3DG2a6E+1NLBeolmFXu+ndNnBFnJVW8wLtLnz0o/mwnAnmvqxZTPiK/B/TsF770yy1z7D5h4Uzg7dBeLOCtehfM6qCc7B2LRxsBQvPmEq4IxIzrEobKoprxicu1GSWV+GGTy2/cStqBpLC8m/cpeopJLCL8xrR9mCsYm7rKRUn0HJtjq+UPsnn6w+8HVw+GSQ7A323u72918sH/8meoAeokcoQU/RPnqDDtAQEVSi7+gn+hV8DL4EX4NvC2lvY5lzH7VO8OMvJJVP1w==</latexit> } Promise of AI: if we want to design controls, then learning of the control policy should be easier than learning the model 🧐 21
  21. Direct data-driven control design 22 MPC: Model-based Predictive Control min!,#

    ∑$%& ' cost 𝑢$ , 𝑦$ subject to model: 𝑦$(& = 𝐴 𝑦! 𝑢! 𝑦!"# 𝑢!"# ⋮ 𝑢$ , 𝑦$ constrained DeePC: Data-EnablEd Predictive Control min!,#,) ∑$%& ' cost 𝑢$ , 𝑦$ subject to 𝑦! 𝑢! 𝑦!"# 𝑢!"# ⋮ = data matrix ⋅ 𝑔 𝑢$ , 𝑦$ constrained low-rank data matrix spans the subspace: e.g., pre-recorded trajectories or sample covariance + ℎ(𝑔) regularizer to avoid overfitting, account for noise, nonlinearity, & distributional uncertainty Behavioral system theory: the set of trajectories {𝑢$ , 𝑦$ } of a linear system is a low-dim. subspace <latexit sha1_base64="Jw5d2rubdUlKsIWzpa9OkR9UmwA=">AAAD2HicdVLLbtNAFJ3GPEp4tbBkYxFVYoEiG1WFZXkIsSwqaStiKxqPr5NR5mFmxmnDaCR2iAUbFvA5fAd/wzhxEU7SkUY+Ovfce8+9nqxkVJso+rPVCa5dv3Fz+1b39p279+7v7D440bJSBAZEMqnOMqyBUQEDQw2Ds1IB5hmD02z6uo6fzkBpKsUHMy8h5XgsaEEJNp46no+mo51e1I8WJ1wHcQN6qDlHo93O7ySXpOIgDGFY62EclSa1WBlKGLhuUmkoMZniMQw9FJiDfprPaKkXMLUL2y7c88E8LKTyV5hwwf6fbDHXes4zr+TYTPRqrCY3xYaVKV6kloqyMiDIslFRsdDIsN5BmFMFxLC5B5go6m2HZIIVJsZvqtXlHOu5t9CaydYNjZRMu82ONs/Qpon+VEkD6yXqVej1fkoXG9hcrmrzRYE2d1H40Vy3uxfO/NiyHvEN+D+n4Ng7k+ytz7CZB7mzA3eJuLPCbVC+ZOUEZ2BsUjtoxMtPNxFwTiTnWOQ20ZSXDC7cME6tL8MMHtle7FZUtaWl5F+5K1RSSeEX5rXDdMnY2F1VUqrPoGRbHV2q/ZOPVx/4Ojh51o8P+gfv93uHr5rHv40eocfoCYrRc3SI3qEjNEAEjdF39BP9Cj4GX4KvwbeltLPV5DxErRP8+Au5oVBL</latexit> yk <latexit sha1_base64="MAgSjp8DIGkwE1aqsSWvX+IzEZU=">AAAD2HicdVLLbtNAFJ3GPEp4tbBkYxFVYoEiG1WFZXkIsSwqaStiKxqPr5NR5mFmxmnDaCR2iAUbFvA5fAd/wzhJEU7ckUY+Ovfce8+9nqxkVJso+rPVCa5dv3Fz+1b39p279+7v7D440bJSBAZEMqnOMqyBUQEDQw2Ds1IB5hmD02z6uo6fzkBpKsUHMy8h5XgsaEEJNp46rkbT0U4v6keLE26CeAV6aHWORrud30kuScVBGMKw1sM4Kk1qsTKUMHDdpNJQYjLFYxh6KDAH/TSf0VIvYGoXtl2454N5WEjlrzDhgv0/2WKu9ZxnXsmxmej1WE22xYaVKV6kloqyMiDIslFRsdDIsN5BmFMFxLC5B5go6m2HZIIVJsZvqtHlHOu5t9CYydYNjZRMu3ZH7TM0aaI/VdLAZol6FXqzn9JFC5vLdW2+KNDkLgo/mut298KZH1vWI74B/+cUHHtnkr31GTbzIHd24C4Rd1a4FuVLVk5wBsYmtYOVePnpJgLOieQci9wmmvKSwYUbxqn1ZZjBI9uL3ZqqtrSU/Ct3hUoqKfzCvHaYLhkbu6tKSvUZlGyqo0u1f/Lx+gPfBCfP+vFB/+D9fu/w1erxb6NH6DF6gmL0HB2id+gIDRBBY/Qd/US/go/Bl+Br8G0p7Wytch6ixgl+/AWr0VBH</latexit> uk <latexit sha1_base64="L3KifoDHpeE+JgqNPROK8JIVWz8=">AAAD7XicdVLLbtNAFJ3WPEp4pSCxYTMiqoRUFNkIFTZI5SHEsgjSVkosazy+bkYZz5iZcVozzGewQyzYsIB/4Dv4G8ZJinCSXmnko3PPffqmJWfahOGfjc3g0uUrV7euda7fuHnrdnf7zqGWlaIwoJJLdZwSDZwJGBhmOByXCkiRcjhKJ68a/9EUlGZSfDB1CXFBTgTLGSXGU0n3Xp3YyW7k8HNMcJ1M8C5Oq2SSdHthP5wZXgXRAvTQwg6S7c3fo0zSqgBhKCdaD6OwNLElyjDKwXVGlYaS0Ak5gaGHghSgH2VTVuoZjO1sFod3vDPDuVT+CYNn7P/BlhRa10XqlQUxY73sa8h1vmFl8mexZaKsDAg6L5RXHBuJm8XgjCmghtceEKqYbxvTMVGEGr++VpVTomvfQmsm2xQ0UnLt1ne0foY2TfXHShpYTdGsQq/WUzpfw2ZyWZvNErS5s9yP5jqdHTz1Y8tmxNfg/5yC974zyd/4CJt6kDk7cOeocFa4NcoXvByTFIwdNR0sxPNPZyTglMqiICKzI82KksOZG0ax9Wm4IYntRW5J1bQ0l/xLd4FKKin8wrx2GM8ZG7mLUkr1CZRsq8NztT/5aPnAV8Hh4360199796S3/3Jx/FvoPnqAHqIIPUX76C06QANE0Wf0Hf1EvwIZfAm+Bt/m0s2NRcxd1LLgx1//oVbb</latexit> yk+1 = ayk + buk
  22. Case study: wind turbine / farm 23 SG 1 SG

    2 SG 3 1 2 3 4 5 6 7 9 8 IEEE nine-bus system wind farm 1 2 3 4 5 6 7 8 9 10 !"#" $%&&'$#(%) *(#+%,#-"!!(#(%)"&-$%)#.%& %/$(&&"#(%) %0/'.1'! h(g) = ∥g∥2 2 h(g) = ∥g∥1 h(g) = Proj ud yd g 2 2 2''34-"$#(1"#'! no control variations of DeePC no control variations of DeePC model-based control 23
  23. Implementation on a 100kW grid-connected IBR 24 works in theory

    & practice → in RnD pipeline of a few vendors by now 80% of operation range
  24. Conclusions Summary: old & new challenges in power electronics dominated

    power systems - interoperability & grid codes - services from distributed generation - data-driven decision making Some pressing challenges going forward - multi-agent learning & data-driven control - certifiable closed-loop grid codes - push the TRL scale & close loops in practice voltage source behavior on (sub)transient time scales, which is aligned with the description in the NERC report [5]. It i worth mentioning that the FI of PLL-GFM demonstrates tha PLL-based converters can also exhibit voltage source behavior making it debatable whether PLL is used as a criterion to distinguish GFM and GFL. In addition, the voltage dynamic of VOC also cause its FI > 1 at low frequencies. Case study II • oscillatory grid with weakly-damped inter-area modes • sequentially apply P&O strategy for both units • initial situation: cheap ancillary services by both units 1 6 2 SG 1 SG 2 5 reserve unit 1 G1 (s) 12 G2 (s) 11 3 9 8 SG 4 10 SG 3 4 13 reserve unit 2 0 10 20 30 40 50 -0.5 -0.4 -0.3 -0.2 -0.1 0 0.1 0 10 20 30 40 50 -0.015 -0.01 -0.005 0 0.005 0.01 0.015 0.02 0.025 cheap 1 & cheap 2 optimal 1 & cheap 2 optimal 1 & optimal 2 cheap 1 & cheap 2 optimal 1 & cheap 2 optimal 1 & optimal 2 significant improvement of the closed-loop system behavior after first & second P&O cycle during a load increase at bus 7 -100 -50 0 -50 0 10 0 10 2 100 200 300 10 0 10 2 400 500 600 -40 -20 0 20 -20 -10 0 10 0 10 2 0 200 400 10 0 10 2 300 350 400 reference identified G1 (s) inter-area mode 22/23 25