Presentation from GDG DevFest Ukraine 2018 - the biggest community-driven Google tech conference in the CEE.
Learn more at: https://devfest.gdg.org.ua
__
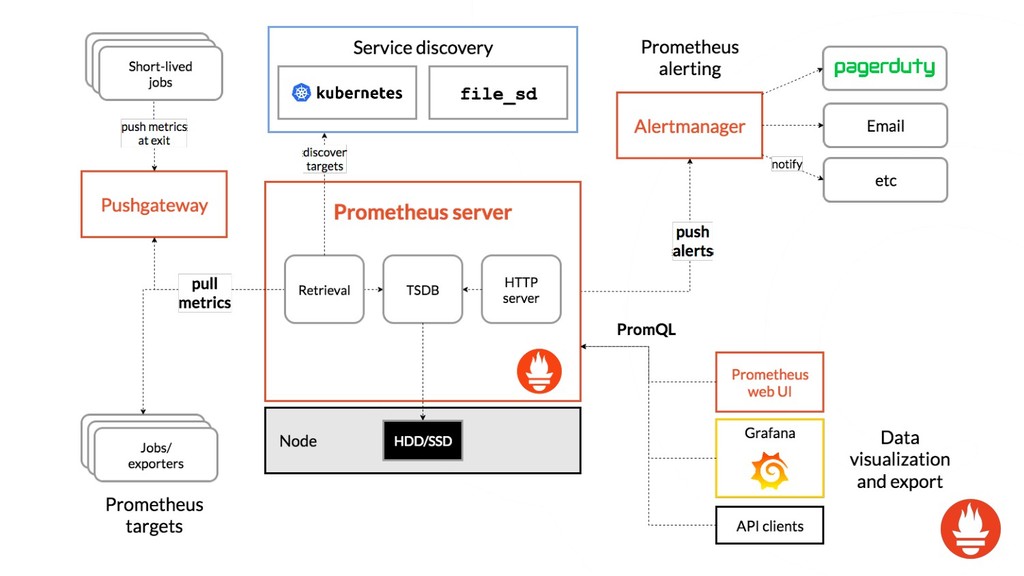
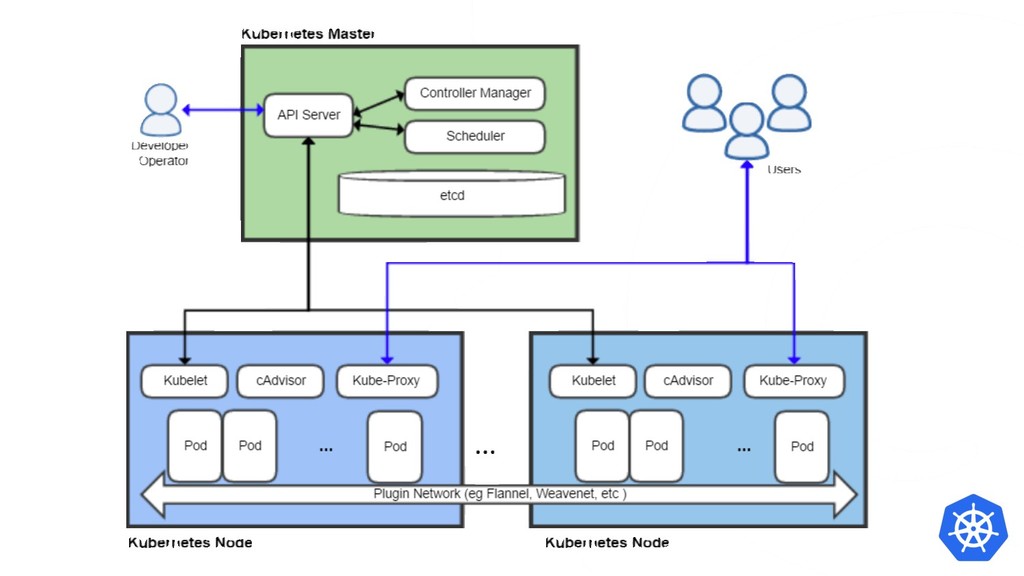
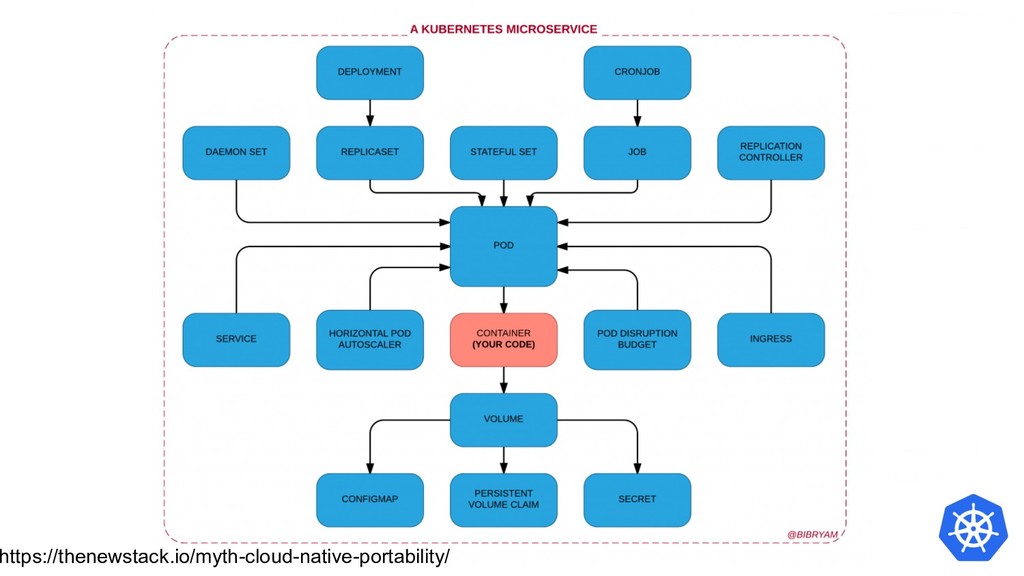
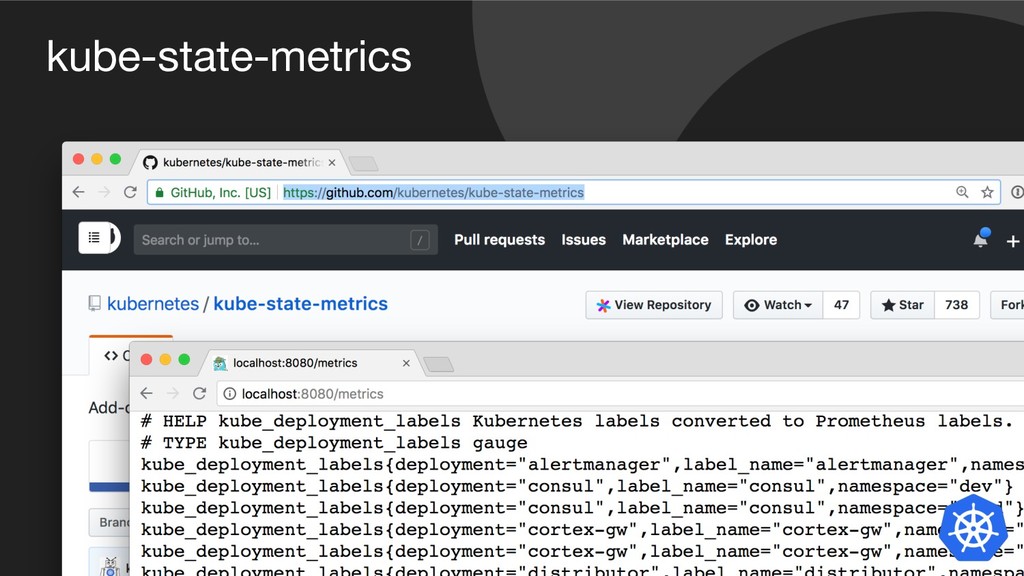
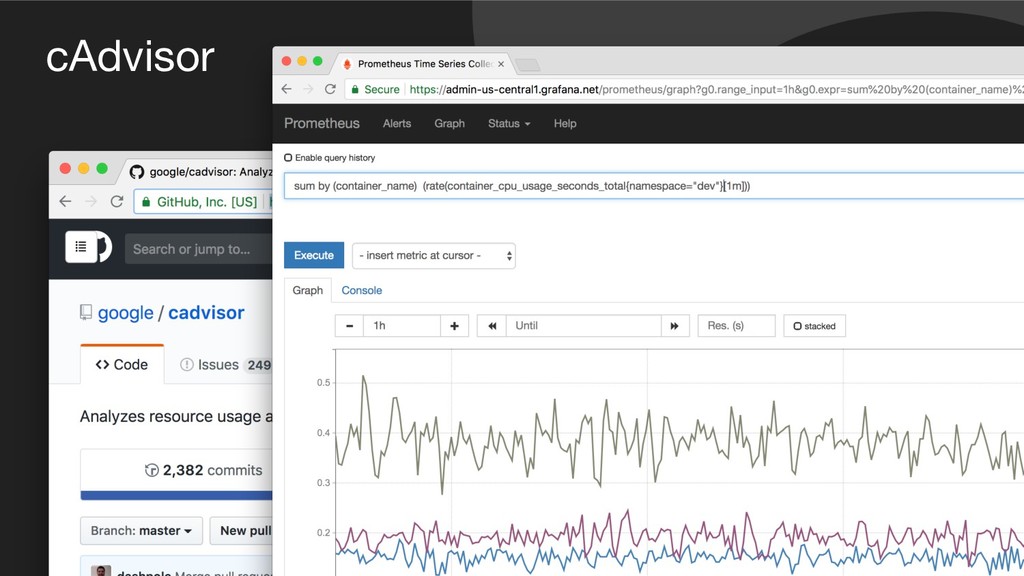
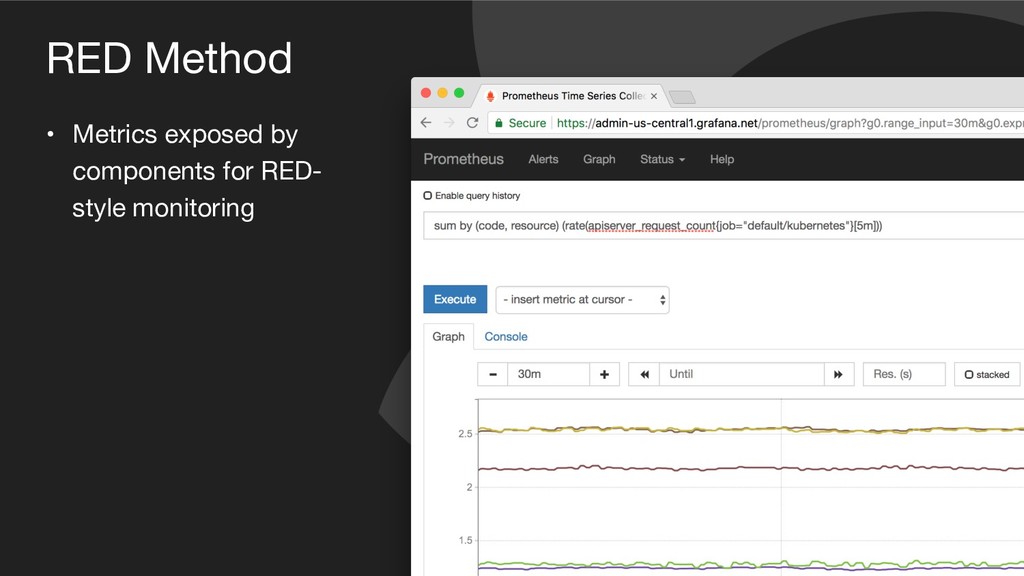
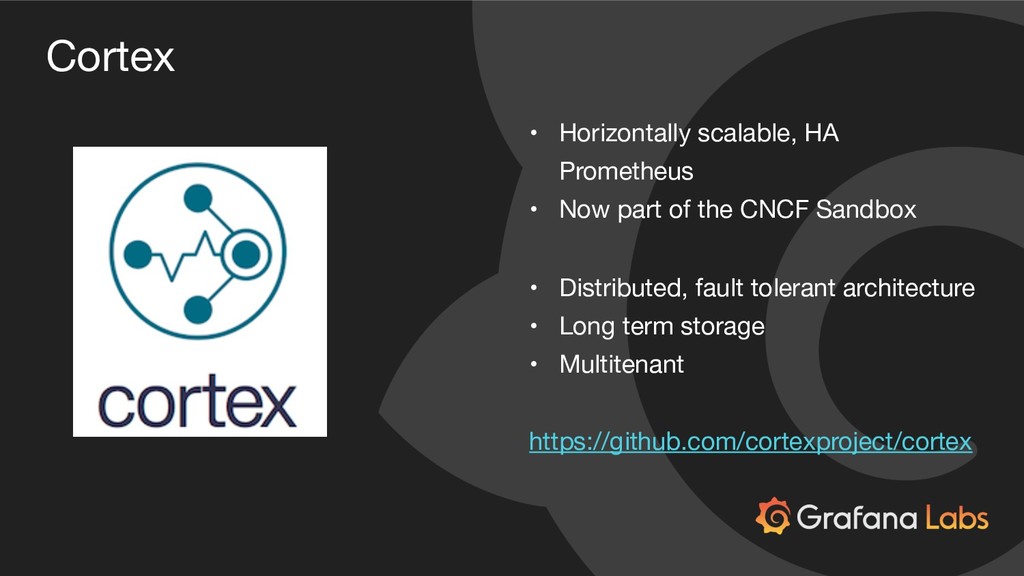
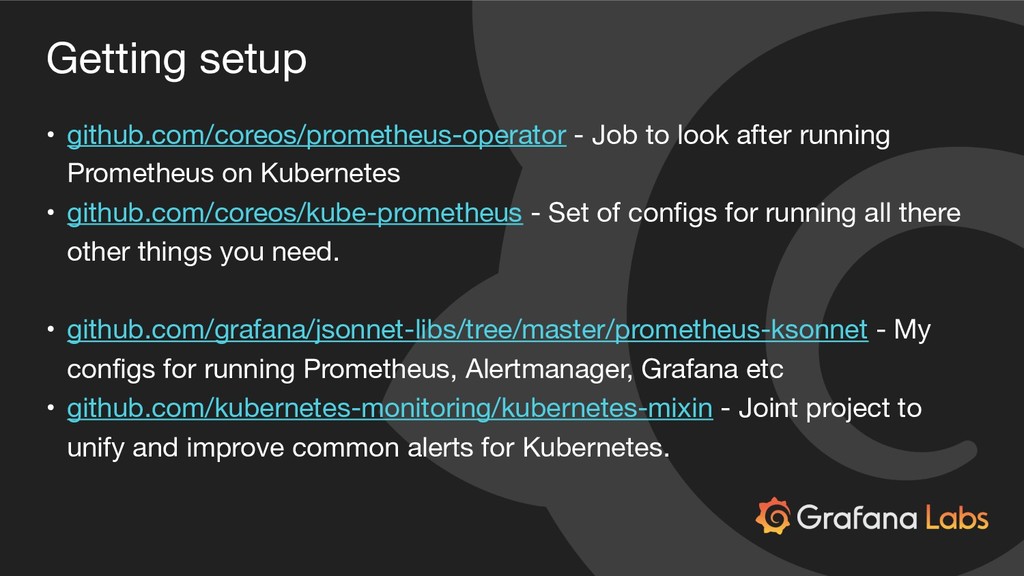
Prometheus has become the defacto monitoring system for cloud native applications, with systems like Kubernetes and Etcd natively exposing Prometheus metrics. In this talk Tom will explore all the moving part for a working Prometheus-on-Kubernetes monitoring system, including kube-state-metrics, node-exporter, cAdvisor and Grafana. You will learn about the various methods for getting to a working setup: the manual approach, using CoreOS’s Prometheus Operator, or using Prometheus Ksonnet Mixin. Tom will also share some little tips and tricks for getting the most out of your Prometheus monitoring, including the common pitfalls and what you should be alerting on.
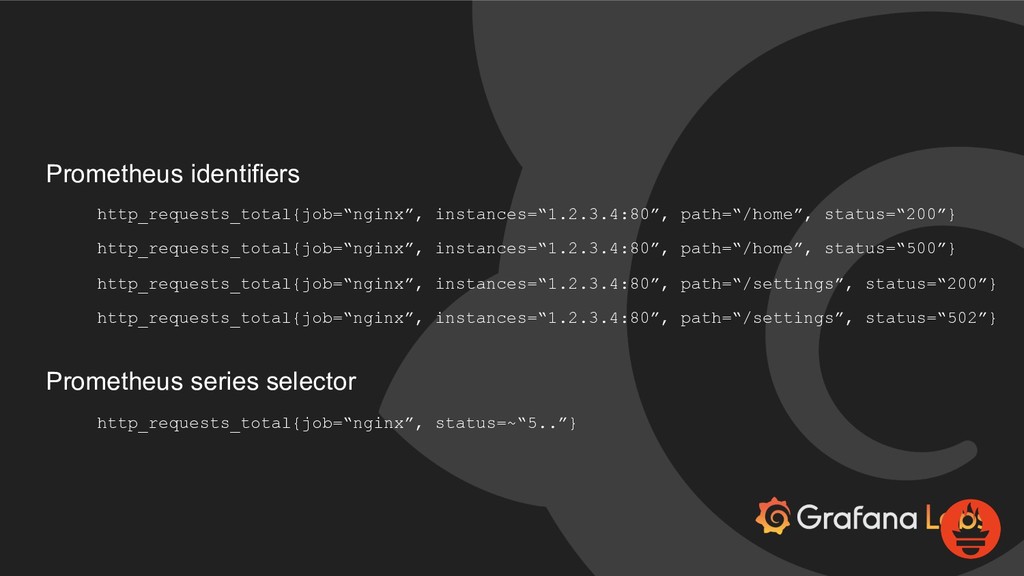
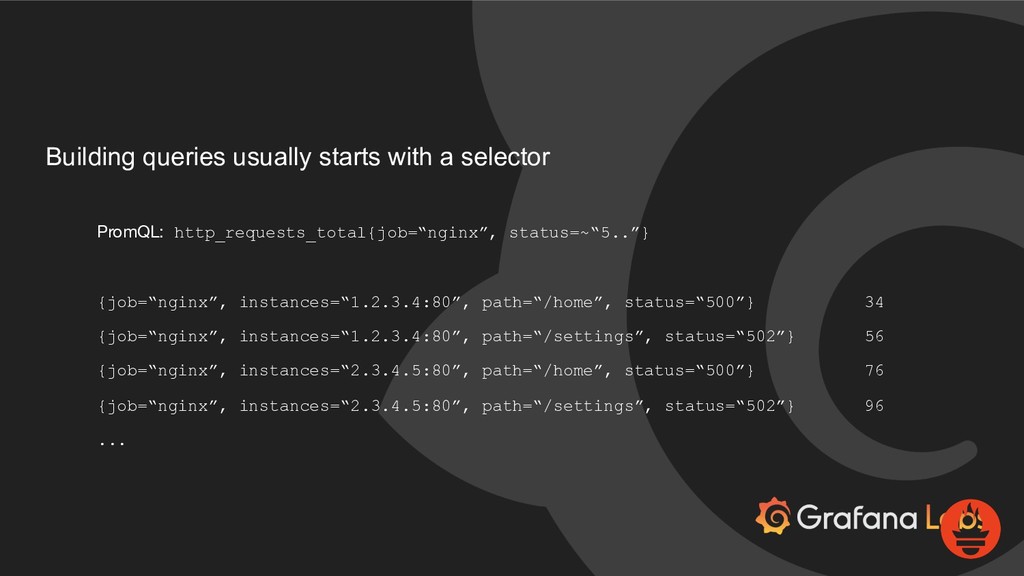
![Can select vectors of values… PromQL: http_requests_total{job=“nginx”, status=~“5..”}[1m] {job=“nginx”, instances=“1.2.3.4:80”,](https://files.speakerdeck.com/presentations/e42c4a22bf3f4b4cbad32a59408c35af/slide_9.jpg)
![And apply functions… PromQL: rate(http_requests_total{job=“nginx”, status=~“5..”}[1m]) {job=“nginx”, instances=“1.2.3.4:80”, path=“/home”, status=“500”}](https://files.speakerdeck.com/presentations/e42c4a22bf3f4b4cbad32a59408c35af/slide_10.jpg)
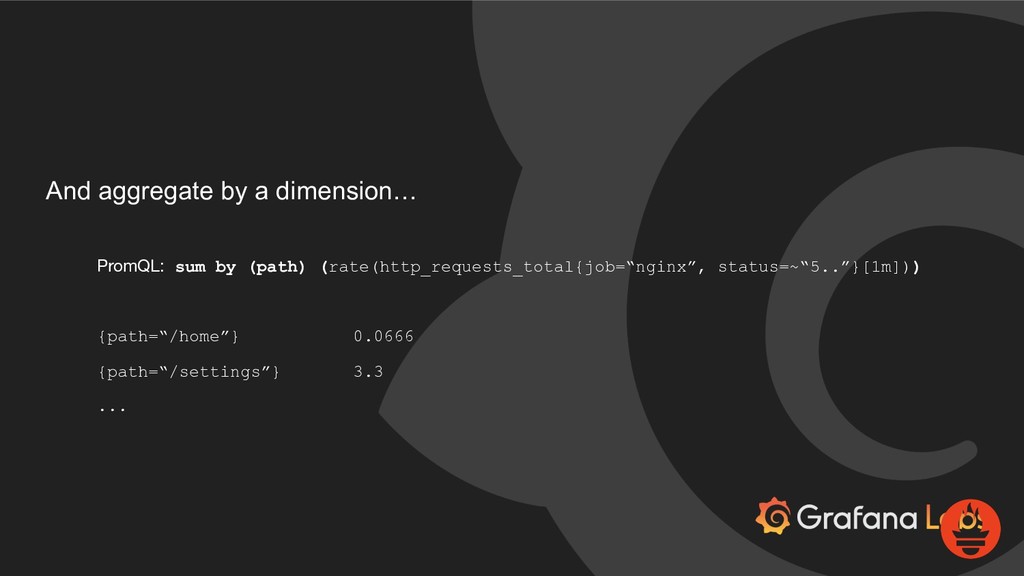
![Do binary operations… PromQL: sum by (path) (rate(http_requests_total{job=“nginx”, status=~“5..”}[1m])) /](https://files.speakerdeck.com/presentations/e42c4a22bf3f4b4cbad32a59408c35af/slide_12.jpg)
![USE Method CPU Utilisation: 1 - avg(rate(node_cpu{mode=“idle"}[1m])) CPU Saturation: sum(node_load1)/](https://files.speakerdeck.com/presentations/e42c4a22bf3f4b4cbad32a59408c35af/slide_21.jpg)