Upgrade to Pro — share decks privately, control downloads, hide ads and more …

#GeoNYC April 8th - NYC Parks Presentation

#GeoNYC April 8th - NYC Parks Presentation

#GeoNYC Meetup
April 8th, 2013
Peter Tiso, NYC Parks Department

georgiamoon

April 08, 2013
Tweet

More Decks by georgiamoon

Other Decks in Research

Transcript

  1. Prioritizing
    Street Tree
    Planting
    Theory & Method
    Peter Tiso
    City of New York
    Department of Parks & Recreation
    Forestry, Horticulture, and Natural Resources
    April 8, 2013

    View Slide

  2. We plant about 17,000 to
    23,000 street trees per year.
    2
    Prioritizing Street Tree Planting

    View Slide

  3. That’s about one tree every
    two minutes during the working
    day in planting season.
    3
    Prioritizing Street Tree Planting

    View Slide

  4. Previous Prioritization (Fall 2007)
    Exceptionally simple design:
    • Population Density
    • Street Tree Stocking Level
    Plus…
    4
    Prioritizing Street Tree Planting

    View Slide

  5. Trees for Public Health Neighborhoods
    5
    Prioritizing Street Tree Planting

    View Slide

  6. The simple design fostered
    community understanding.
    6
    Prioritizing Street Tree Planting

    View Slide

  7. As planting progressed, the
    maps became outdated.
    7
    Prioritizing Street Tree Planting

    View Slide

  8. Previous Prioritization
    8
    Prioritizing Street Tree Planting

    View Slide

  9. Goals for the new prioritization:
    • Retain simple common-sense design
    • Use the then-new 2010 Census data
    • Include new environmental data
    • Make use of LiDAR–derived land
    cover information
    9
    Prioritizing Street Tree Planting

    View Slide

  10. Methodology
    The two-tier system used was developed by
    the USDA Forest Service.
    It identifies and combines a range of variables
    to determine where planting is preferable
    (tier 1) and where planting is possible (tier 2)
    The values for each variable are identified to
    the smallest possible geography, weighted
    by importance, and standardized to a
    “Z-score.”
    10
    Prioritizing Street Tree Planting

    View Slide

  11. Tier 1
    Tier 1 was based on the 2010 Census’ 
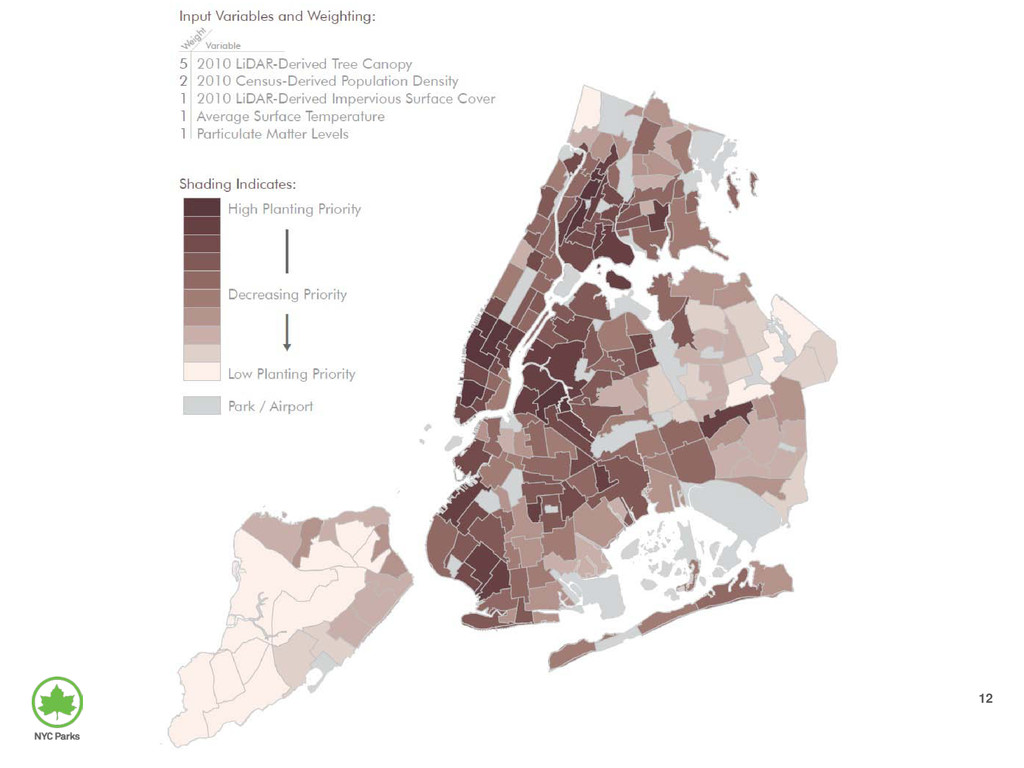
Neighborhood Tabulation
    Areas (NTAs) and includes the following variables:
    • Lack of existing tree canopy (from LiDAR) – weighted 5x
    • High population density – weighted 2x
    • High airborne particulate Matter (PM2)
    • High surface temperature (2002 LANDSAT)
    • Low percentage impervious surface
    11
    Prioritizing Street Tree Planting

    View Slide

  12. 12

    View Slide

  13. Tier 2
    Tier 2 was based on the 2010 Census 
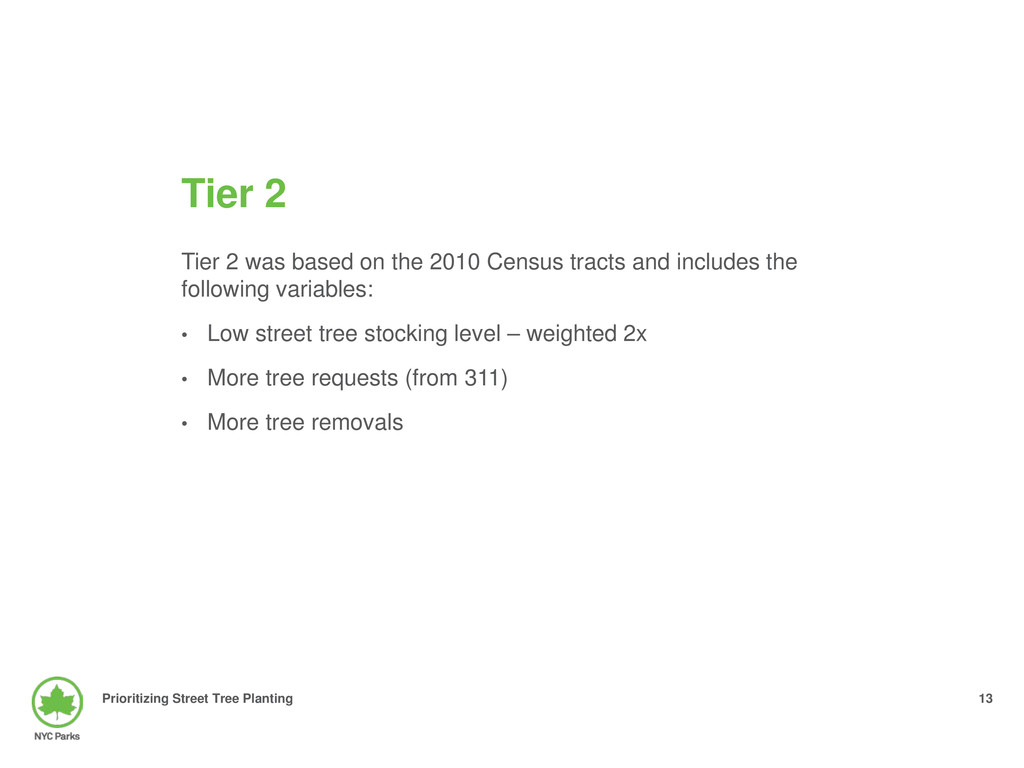
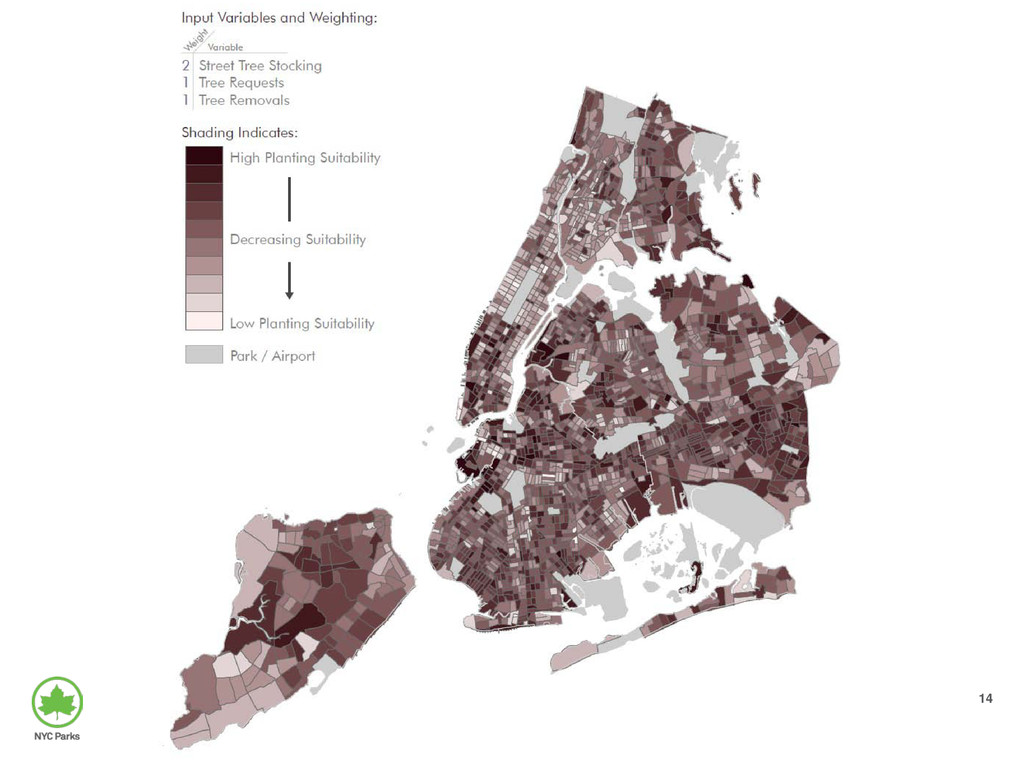
tracts and includes the
    following variables:
    • Low street tree stocking level – weighted 2x
    • More tree requests (from 311)
    • More tree removals
    13
    Prioritizing Street Tree Planting

    View Slide

  14. 14

    View Slide

  15. Overall Prioritization
    Tier 1 and Tier 2 values were averaged in
    each Census tract to create the overall
    planting priority.
    15
    Prioritizing Street Tree Planting

    View Slide

  16. 16

    View Slide

  17. Field Implementation
    The prioritization order produced isn’t a hard
    rule. 
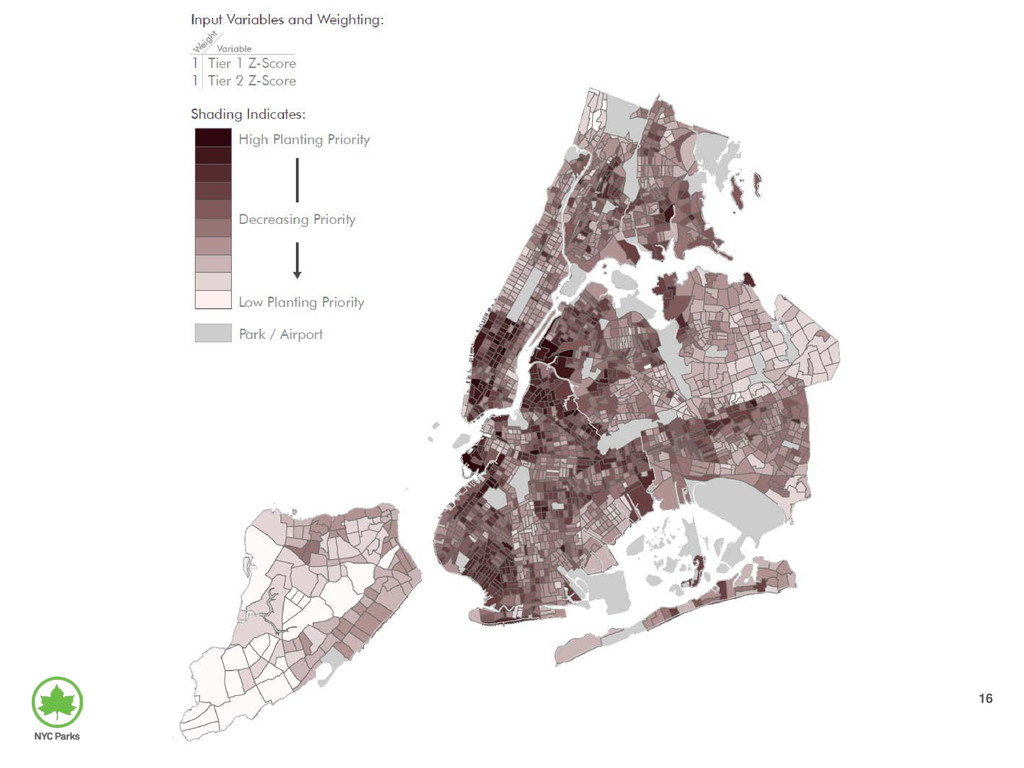
It simply tells foresters where to look
    first.
    The results of this method have been guiding
    the last several seasons of street tree
    planting.
    17
    Prioritizing Street Tree Planting

    View Slide

  18. SHAMELESS PLUG TIME
    This image is of the LiDAR point 
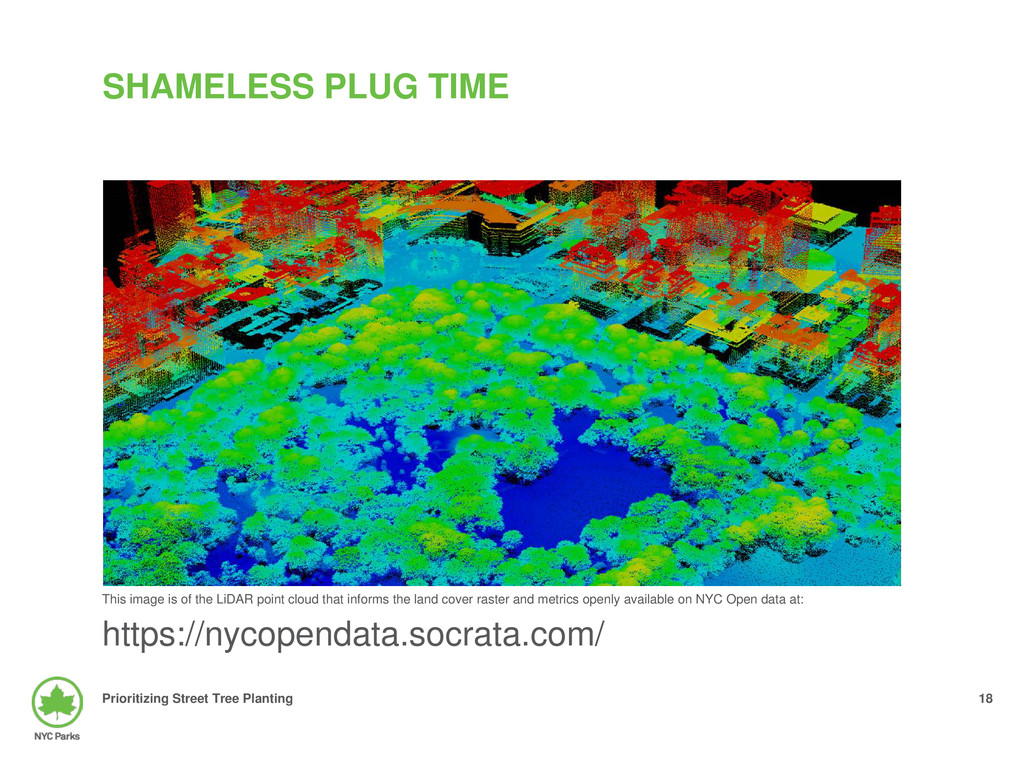
cloud that informs the land cover raster and metrics openly available on NYC Open data at:
    https://nycopendata.socrata.com/
    18
    Prioritizing Street Tree Planting

    View Slide

  19. Questions?
    [email protected]

    View Slide