Synthetic Cov Using Synthetic Coverage Information to Evaluate Test Suite Prioritizers Gregory M. Kapfhammer† Department of Computer Science Allegheny College, Pennsylvania, USA http://www.cs.allegheny.edu/~gkapfham/ Chennai Mathematical Institute, February 2008 †In Conjunction with Mary Lou Soffa, Kristen Walcott (UVa/CS) Suvarshi Bhadra, Joshua Geiger, Adam Smith, Gavilan Steinman, Yuting Zhang (Allegheny/CS) Featuring images from Embroidery and Tapestry Weaving, Grace Christie (Project Gutenberg) 1 / 36 Using Synthetic Coverage Information to , Evaluate Test Suite Prioritizers
Synthetic Cov The Challenge of Software Testing I shall not deny that the construction of these testing programs has been a major intellectual effort: to convince oneself that one has not overlooked “a relevant state” and to convince oneself that the testing programs generate them all is no simple matter. The encouraging thing is that (as far as we know!) it could be done. Edsger W. Dijkstra, Communications of the ACM, 1968 Additional Challenge: empirically evaluating the efficiency and effectiveness of software testing techniques 3 / 36 Using Synthetic Coverage Information to , Evaluate Test Suite Prioritizers
Synthetic Cov Approaches to Software Testing Testing Structural Input Space Testing Random Specification Testing Regression Testing Testing isolates defects and establishes a confidence in the correctness of a software application 6 / 36 Using Synthetic Coverage Information to , Evaluate Test Suite Prioritizers
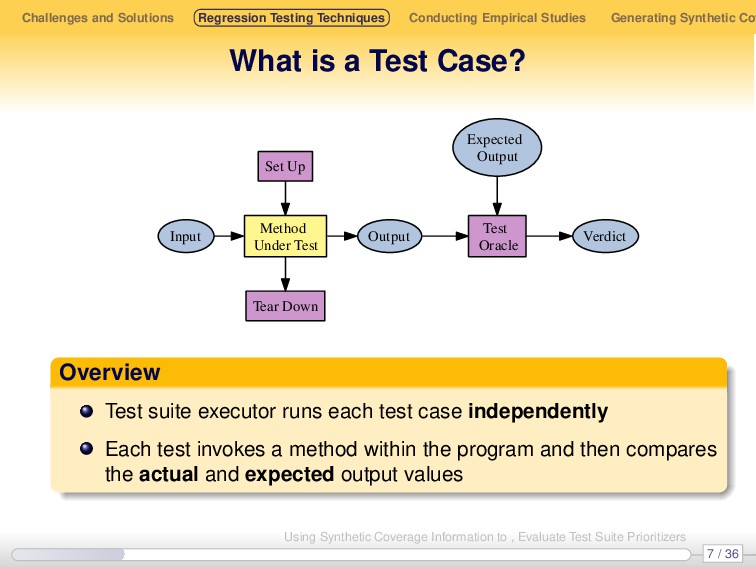
Synthetic Cov What is a Test Case? Input Method Under Test Output Test Oracle Expected Output Verdict Tear Down Set Up Overview Test suite executor runs each test case independently Each test invokes a method within the program and then compares the actual and expected output values 7 / 36 Using Synthetic Coverage Information to , Evaluate Test Suite Prioritizers
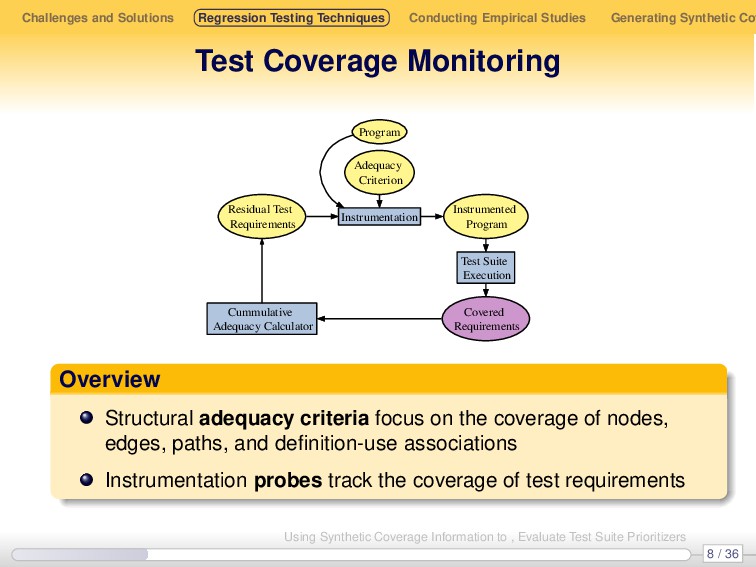
Synthetic Cov Test Coverage Monitoring Program Instrumentation Adequacy Criterion Residual Test Requirements Cummulative Adequacy Calculator Instrumented Program Test Suite Execution Covered Requirements Overview Structural adequacy criteria focus on the coverage of nodes, edges, paths, and definition-use associations Instrumentation probes track the coverage of test requirements 8 / 36 Using Synthetic Coverage Information to , Evaluate Test Suite Prioritizers
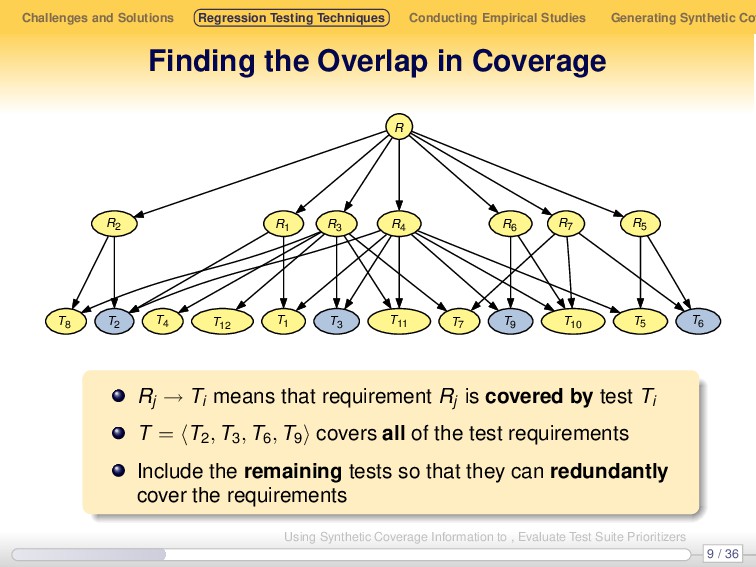
Synthetic Cov Finding the Overlap in Coverage T2 T3 T6 T9 R R1 R2 T4 T8 T11 R3 T12 R4 T1 R4 R4 R4 T5 R4 R4 T10 R4 T11 R5 T5 R5 R6 R6 T10 R7 R7 T7 R7 T10 Rj → Ti means that requirement Rj is covered by test Ti T = T2 , T3 , T6 , T9 covers all of the test requirements Include the remaining tests so that they can redundantly cover the requirements 9 / 36 Using Synthetic Coverage Information to , Evaluate Test Suite Prioritizers
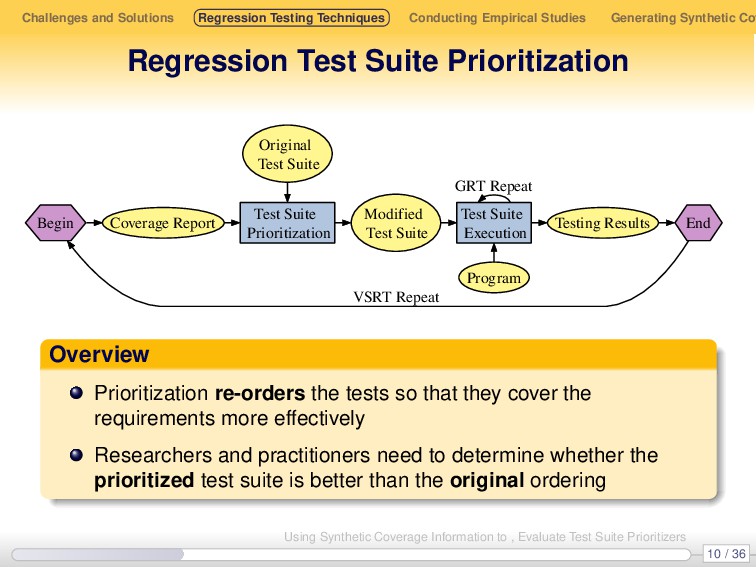
Synthetic Cov Regression Test Suite Prioritization Begin Coverage Report End VSRT Repeat Program Test Suite Prioritization Original Test Suite Modified Test Suite Test Suite Execution Testing Results GRT Repeat Overview Prioritization re-orders the tests so that they cover the requirements more effectively Researchers and practitioners need to determine whether the prioritized test suite is better than the original ordering 10 / 36 Using Synthetic Coverage Information to , Evaluate Test Suite Prioritizers
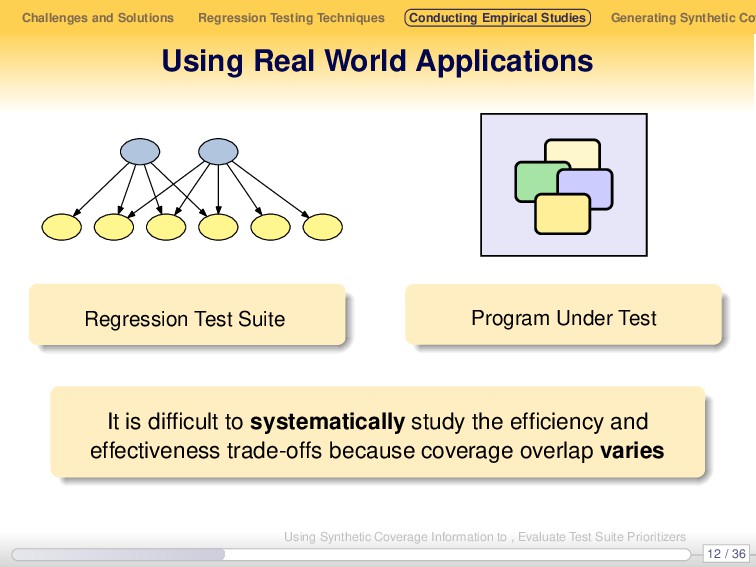
Synthetic Cov Using Real World Applications Regression Test Suite Program Under Test It is difficult to systematically study the efficiency and effectiveness trade-offs because coverage overlap varies 12 / 36 Using Synthetic Coverage Information to , Evaluate Test Suite Prioritizers
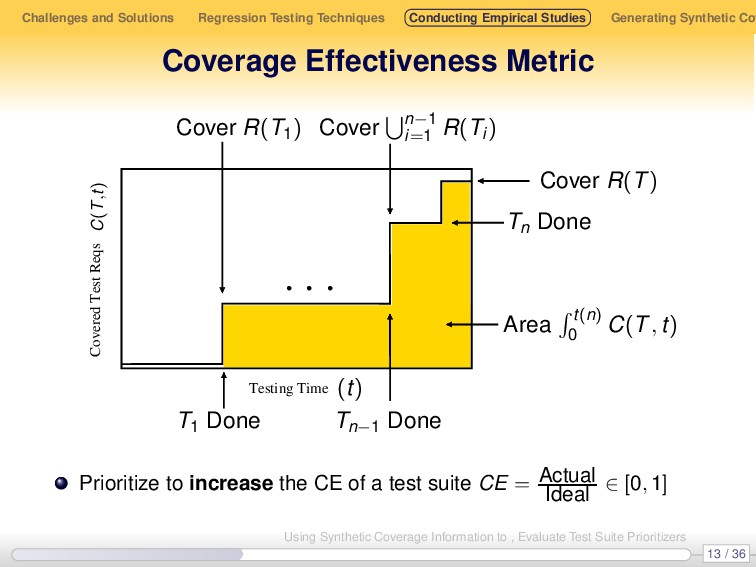
Synthetic Cov Coverage Effectiveness Metric Testing Time . . . Covered Test Reqs acements T1 Done Tn−1 Done Tn Done Cover R(T1 ) Cover n−1 i=1 R(Ti ) Cover R(T) Area t(n) 0 C(T, t) C(T , t) (t) Prioritize to increase the CE of a test suite CE = Actual Ideal ∈ [0, 1] 13 / 36 Using Synthetic Coverage Information to , Evaluate Test Suite Prioritizers
Synthetic Cov Characterizing a Test Suite Test Information Test Case Cost (sec) Requirements R1 R2 R3 R4 R5 T1 5 T2 10 T3 4 Total Testing Time = 19 seconds Formulating the Metrics CE considers the execution time of each test while CEu assumes that all test cases execute for a unit cost 14 / 36 Using Synthetic Coverage Information to , Evaluate Test Suite Prioritizers
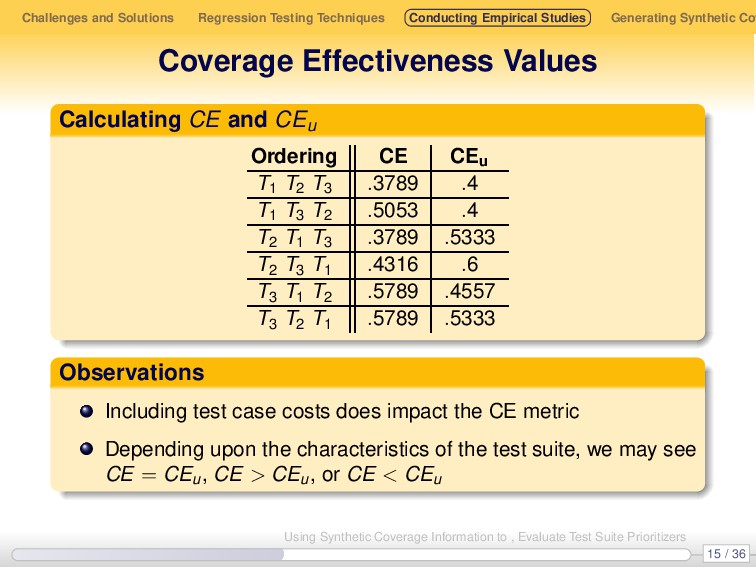
Synthetic Cov Coverage Effectiveness Values Calculating CE and CEu Ordering CE CEu T1 T2 T3 .3789 .4 T1 T3 T2 .5053 .4 T2 T1 T3 .3789 .5333 T2 T3 T1 .4316 .6 T3 T1 T2 .5789 .4557 T3 T2 T1 .5789 .5333 Observations Including test case costs does impact the CE metric Depending upon the characteristics of the test suite, we may see CE = CEu , CE > CEu , or CE < CEu 15 / 36 Using Synthetic Coverage Information to , Evaluate Test Suite Prioritizers
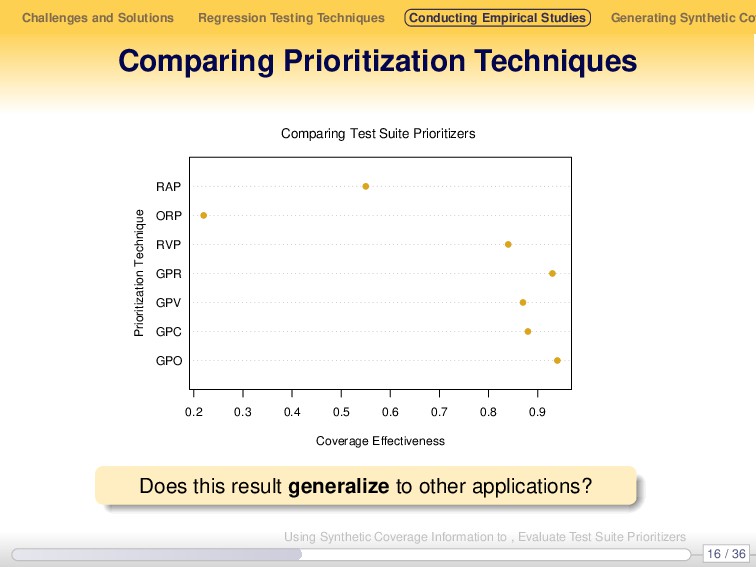
Synthetic Cov Comparing Prioritization Techniques GPO GPC GPV GPR RVP ORP RAP 0.2 0.3 0.4 0.5 0.6 0.7 0.8 0.9 Coverage Effectiveness Prioritization Technique Comparing Test Suite Prioritizers Does this result generalize to other applications? 16 / 36 Using Synthetic Coverage Information to , Evaluate Test Suite Prioritizers
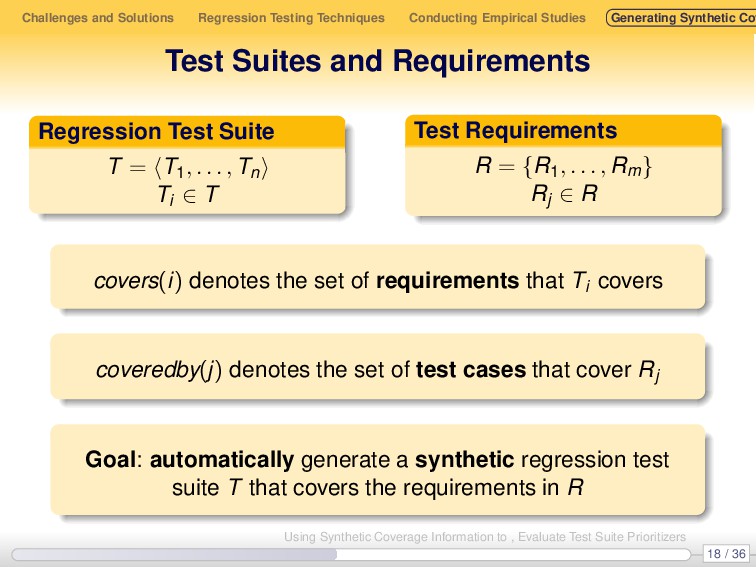
Synthetic Cov Test Suites and Requirements Regression Test Suite T = T1 , . . . , Tn Ti ∈ T Test Requirements R = {R1 , . . . , Rm } Rj ∈ R covers(i) denotes the set of requirements that Ti covers coveredby(j) denotes the set of test cases that cover Rj Goal: automatically generate a synthetic regression test suite T that covers the requirements in R 18 / 36 Using Synthetic Coverage Information to , Evaluate Test Suite Prioritizers
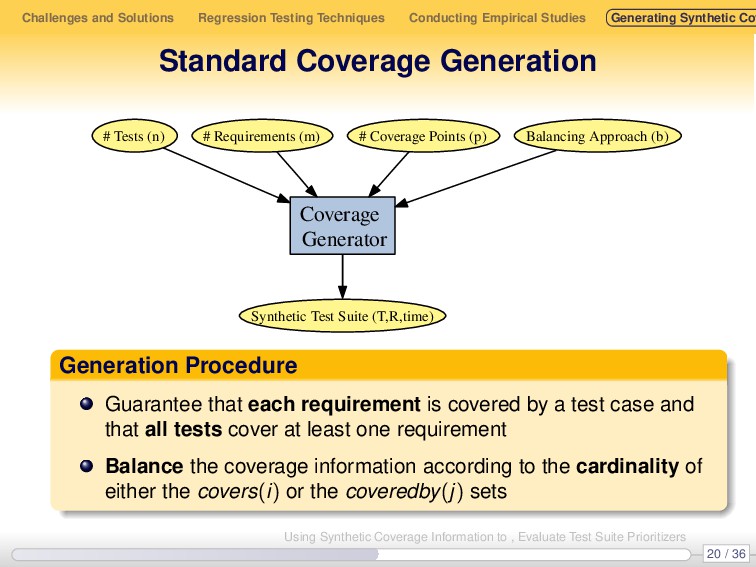
Synthetic Cov Standard Coverage Generation # Tests (n) Coverage Generator # Requirements (m) # Coverage Points (p) Balancing Approach (b) Synthetic Test Suite (T,R,time) Generation Procedure Guarantee that each requirement is covered by a test case and that all tests cover at least one requirement Balance the coverage information according to the cardinality of either the covers(i) or the coveredby(j) sets 20 / 36 Using Synthetic Coverage Information to , Evaluate Test Suite Prioritizers
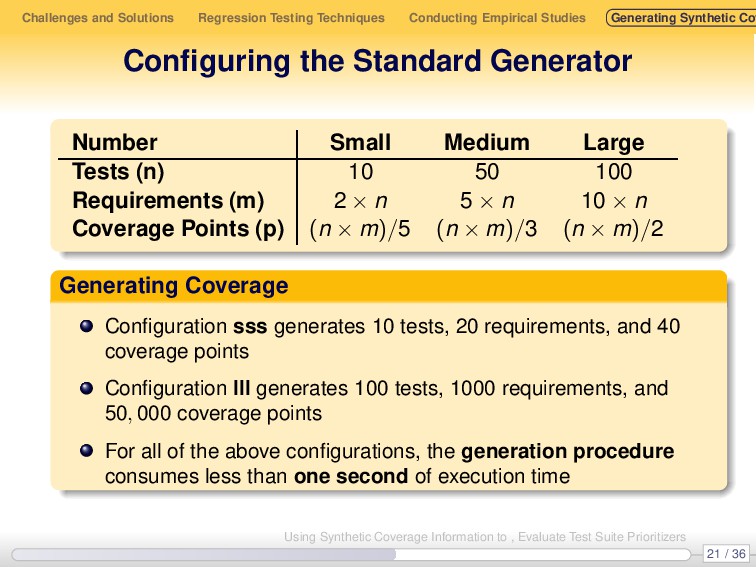
Synthetic Cov Configuring the Standard Generator Number Small Medium Large Tests (n) 10 50 100 Requirements (m) 2 × n 5 × n 10 × n Coverage Points (p) (n × m)/5 (n × m)/3 (n × m)/2 Generating Coverage Configuration sss generates 10 tests, 20 requirements, and 40 coverage points Configuration lll generates 100 tests, 1000 requirements, and 50, 000 coverage points For all of the above configurations, the generation procedure consumes less than one second of execution time 21 / 36 Using Synthetic Coverage Information to , Evaluate Test Suite Prioritizers
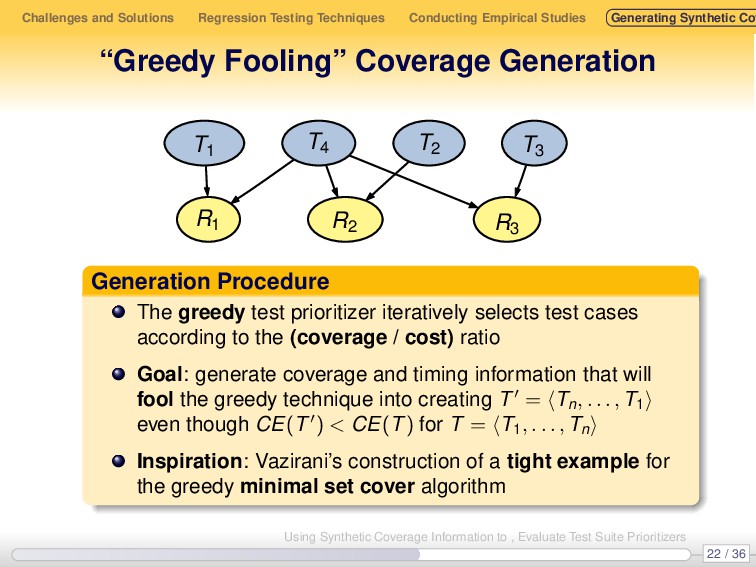
Synthetic Cov “Greedy Fooling” Coverage Generation 0gkapfhamExp Revision : 1.2 T1 R1 R2 R3 T2 T3 T4 Generation Procedure The greedy test prioritizer iteratively selects test cases according to the (coverage / cost) ratio Goal: generate coverage and timing information that will fool the greedy technique into creating T = Tn , . . . , T1 even though CE(T ) < CE(T) for T = T1 , . . . , Tn Inspiration: Vazirani’s construction of a tight example for the greedy minimal set cover algorithm 22 / 36 Using Synthetic Coverage Information to , Evaluate Test Suite Prioritizers
Synthetic Cov Constructing “Greedy Fooling” Test Suites 0gkapfhamExp Revision : 1.2 T1 R1 R2 R3 T2 T3 T4 Approach: use one dimensional optimization (e.g., golden section search and successive parabolic interpolation) to pick a value for cost(Tn ) Construction: set cost(T1 ) = cost(T2 ) = cost(T3 ) = 1 and then determine the bounds for cost(T4 ) ∈ [Cmin , Cmax ] Example: cost(T4 ) ∈ [2.138803, 2.472136] so that CEmin (T ) = .5838004 CEmin (T) = .6108033 CEmax (T ) = .5482172 CEmax (T) = .6345125 23 / 36 Using Synthetic Coverage Information to , Evaluate Test Suite Prioritizers
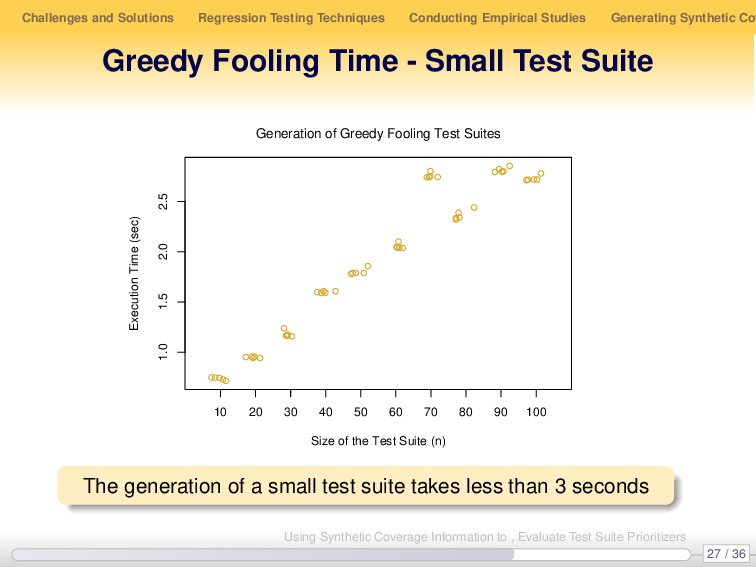
Synthetic Cov Greedy Fooling Time - Small Test Suite 10 20 30 40 50 60 70 80 90 100 1.0 1.5 2.0 2.5 Size of the Test Suite (n) Execution Time (sec) Generation of Greedy Fooling Test Suites The generation of a small test suite takes less than 3 seconds 27 / 36 Using Synthetic Coverage Information to , Evaluate Test Suite Prioritizers
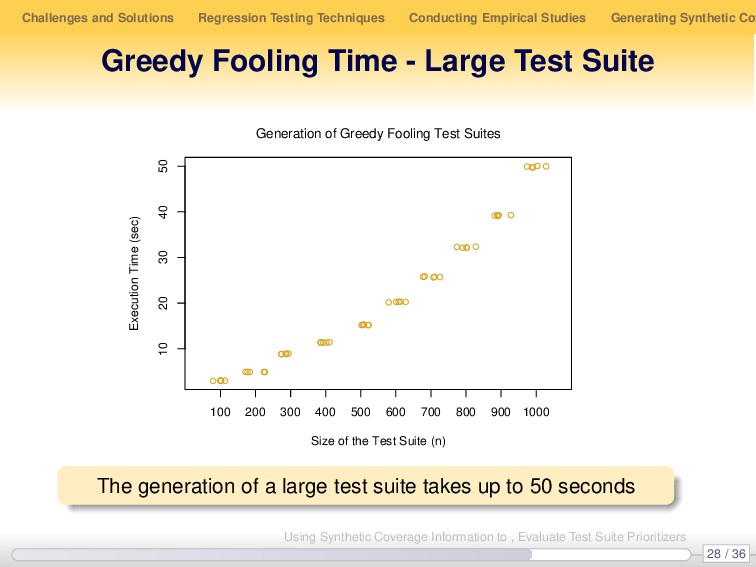
Synthetic Cov Greedy Fooling Time - Large Test Suite 100 200 300 400 500 600 700 800 900 1000 10 20 30 40 50 Size of the Test Suite (n) Execution Time (sec) Generation of Greedy Fooling Test Suites The generation of a large test suite takes up to 50 seconds 28 / 36 Using Synthetic Coverage Information to , Evaluate Test Suite Prioritizers
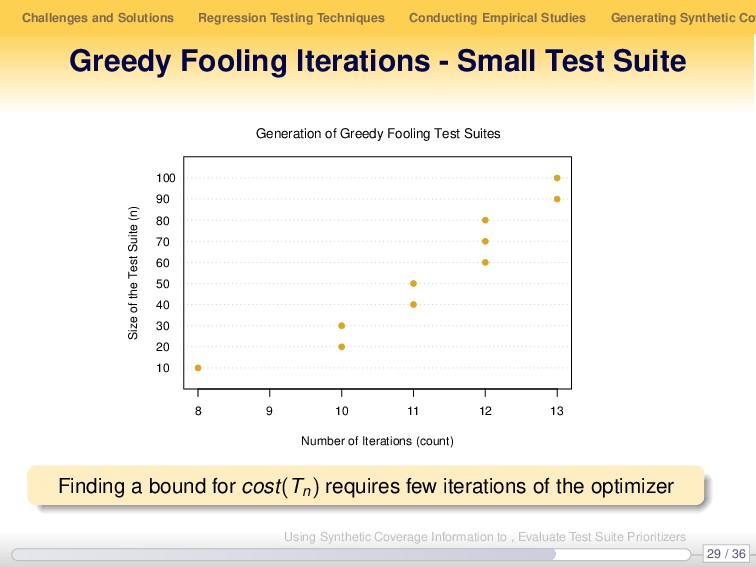
Synthetic Cov Greedy Fooling Iterations - Small Test Suite 10 20 30 40 50 60 70 80 90 100 8 9 10 11 12 13 Number of Iterations (count) Size of the Test Suite (n) Generation of Greedy Fooling Test Suites Finding a bound for cost(Tn ) requires few iterations of the optimizer 29 / 36 Using Synthetic Coverage Information to , Evaluate Test Suite Prioritizers
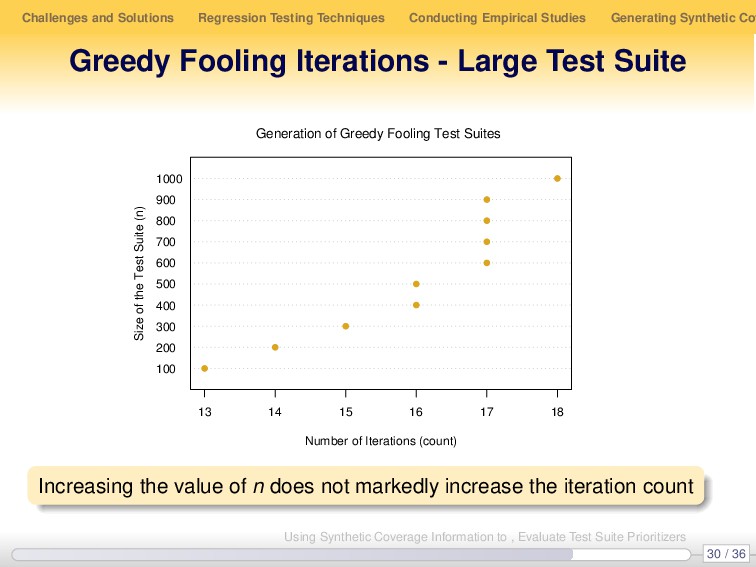
Synthetic Cov Greedy Fooling Iterations - Large Test Suite 100 200 300 400 500 600 700 800 900 1000 13 14 15 16 17 18 Number of Iterations (count) Size of the Test Suite (n) Generation of Greedy Fooling Test Suites Increasing the value of n does not markedly increase the iteration count 30 / 36 Using Synthetic Coverage Information to , Evaluate Test Suite Prioritizers
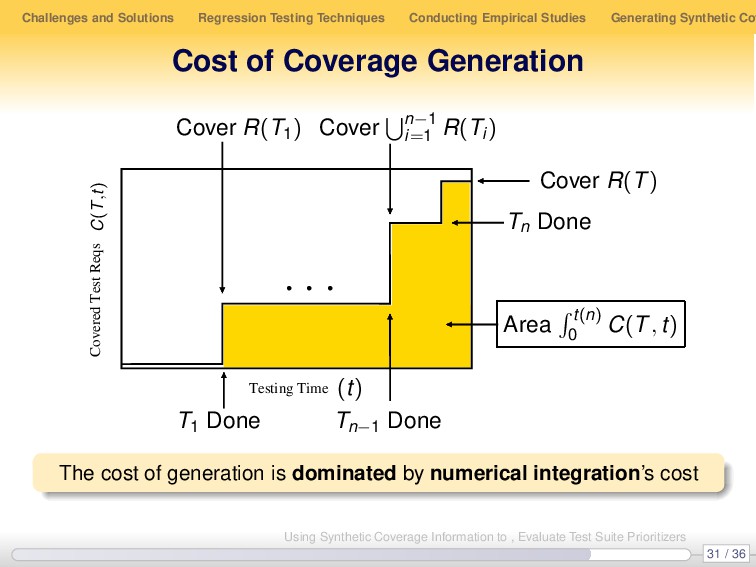
Synthetic Cov Cost of Coverage Generation Testing Time . . . Covered Test Reqs acements T1 Done Tn−1 Done Tn Done Cover R(T1 ) Cover n−1 i=1 R(Ti ) Cover R(T) Area t(n) 0 C(T, t) C(T , t) (t) The cost of generation is dominated by numerical integration’s cost 31 / 36 Using Synthetic Coverage Information to , Evaluate Test Suite Prioritizers
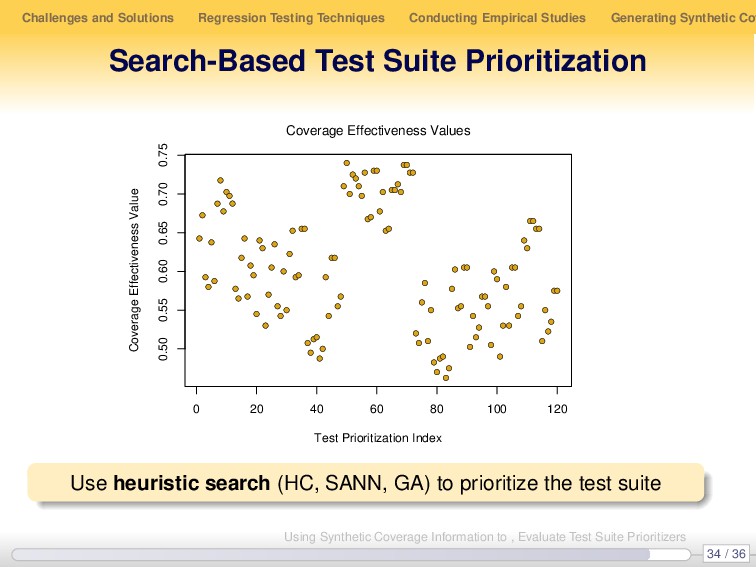
Synthetic Cov Search-Based Test Suite Prioritization 0 20 40 60 80 100 120 0.50 0.55 0.60 0.65 0.70 0.75 Test Prioritization Index Coverage Effectiveness Value Coverage Effectiveness Values Use heuristic search (HC, SANN, GA) to prioritize the test suite 34 / 36 Using Synthetic Coverage Information to , Evaluate Test Suite Prioritizers
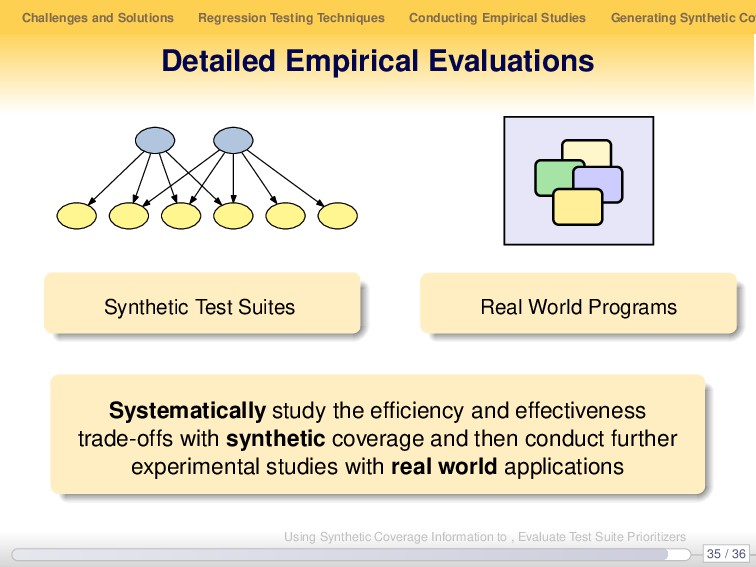
Synthetic Cov Detailed Empirical Evaluations Synthetic Test Suites Real World Programs Systematically study the efficiency and effectiveness trade-offs with synthetic coverage and then conduct further experimental studies with real world applications 35 / 36 Using Synthetic Coverage Information to , Evaluate Test Suite Prioritizers