Upgrade to Pro — share decks privately, control downloads, hide ads and more …

WordPress Blog Posts Recommender in Spark, Scala and the SparkNotebook

Gianmario
November 16, 2015

WordPress Blog Posts Recommender in Spark, Scala and the SparkNotebook

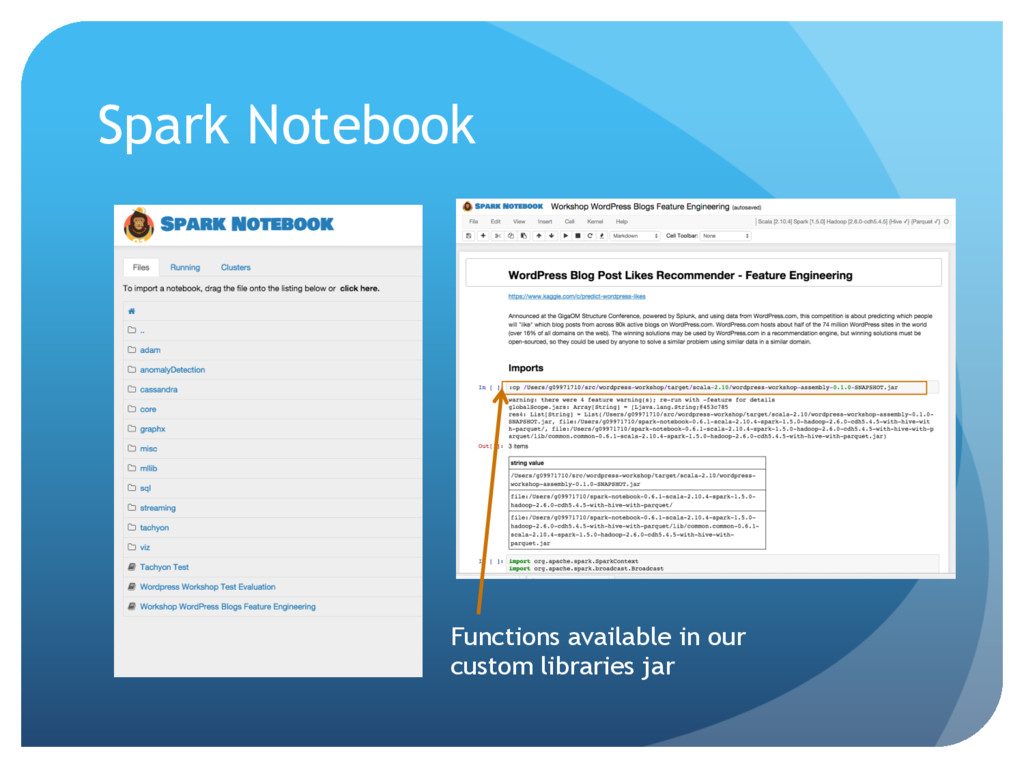
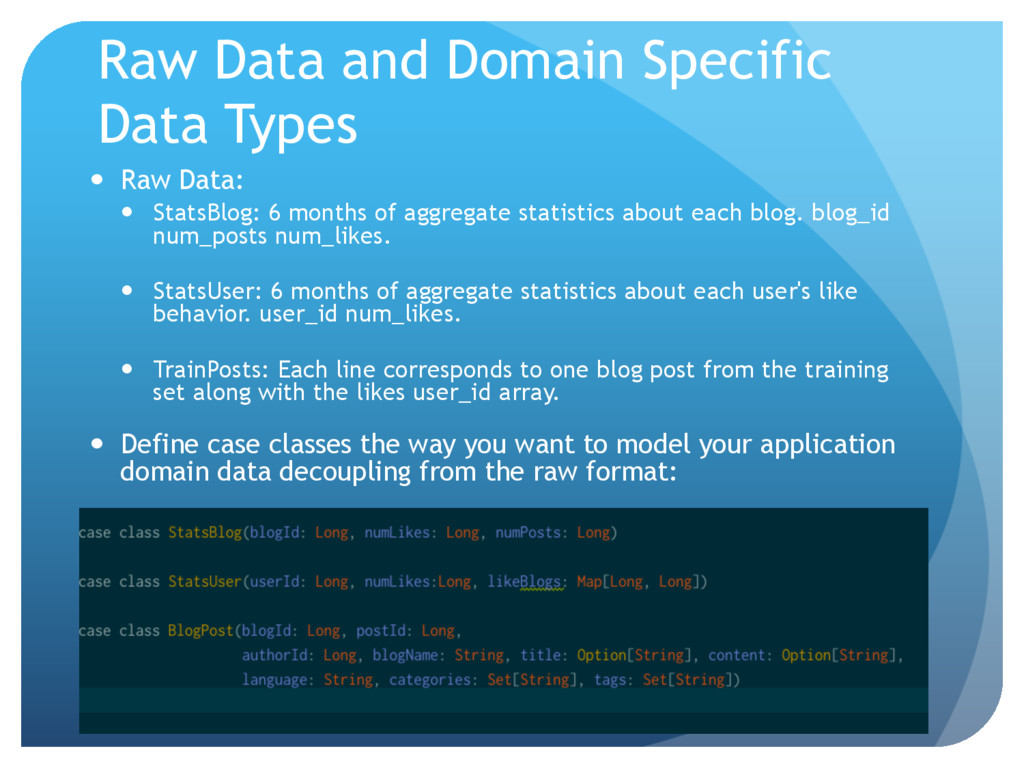
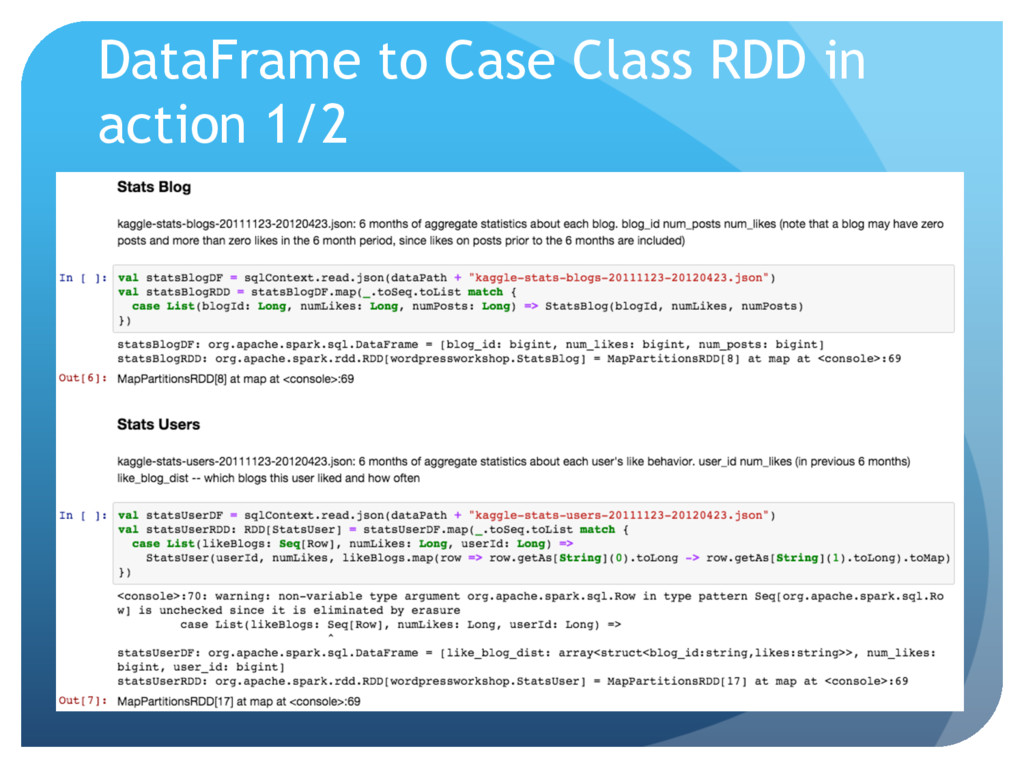
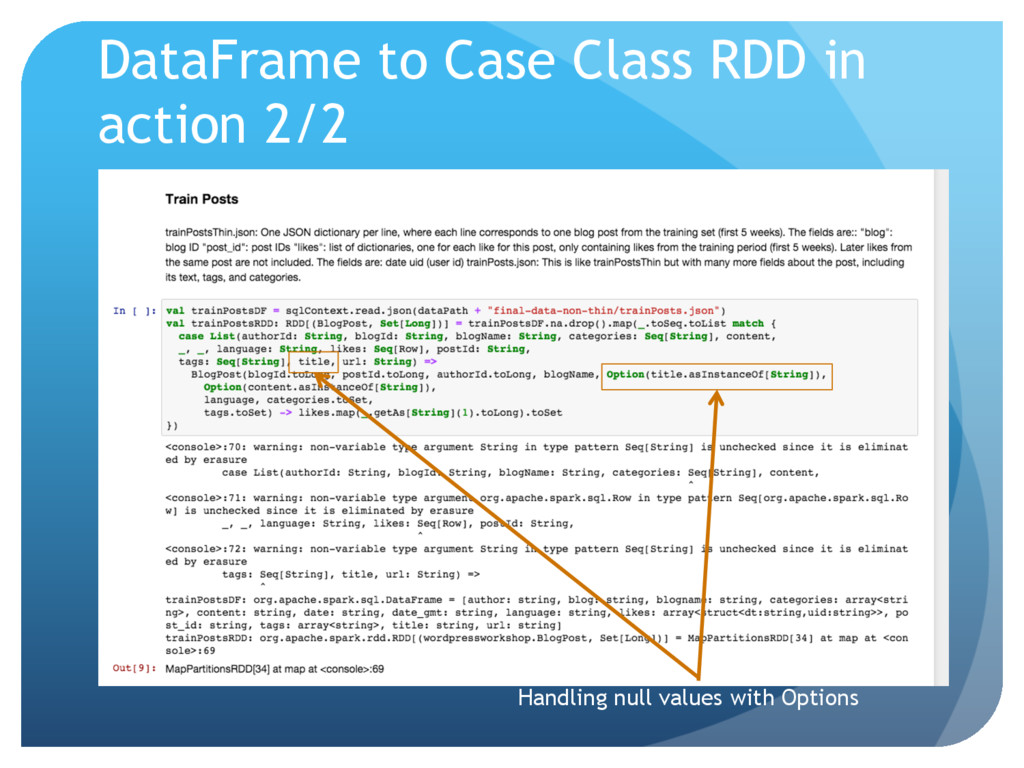
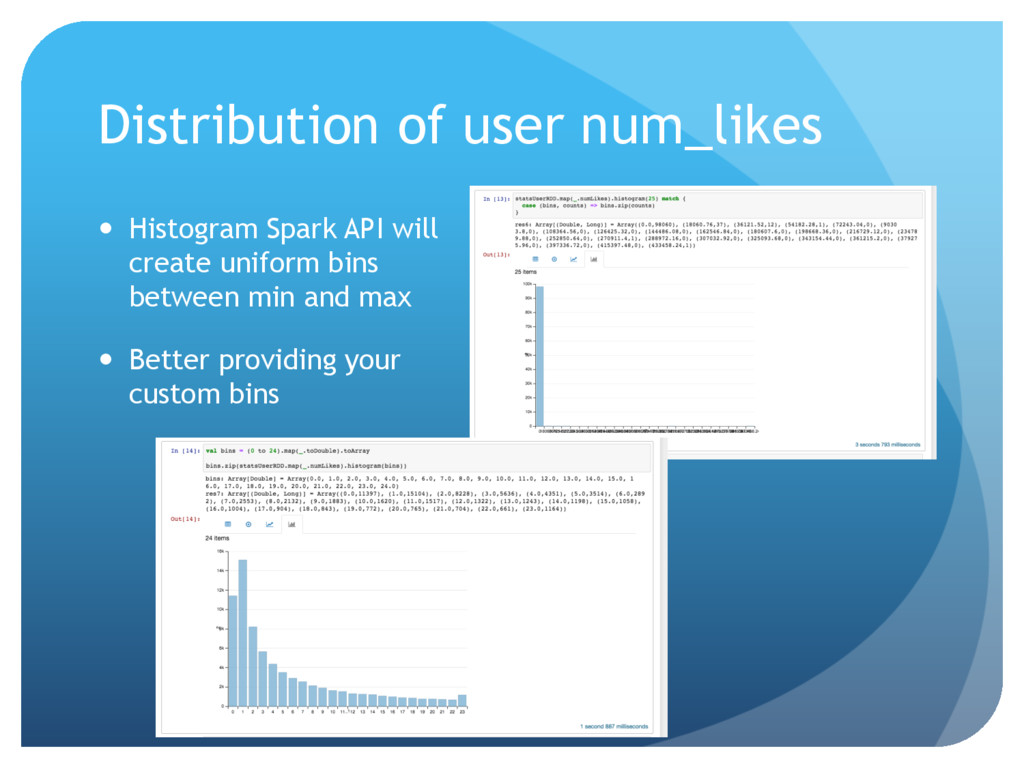
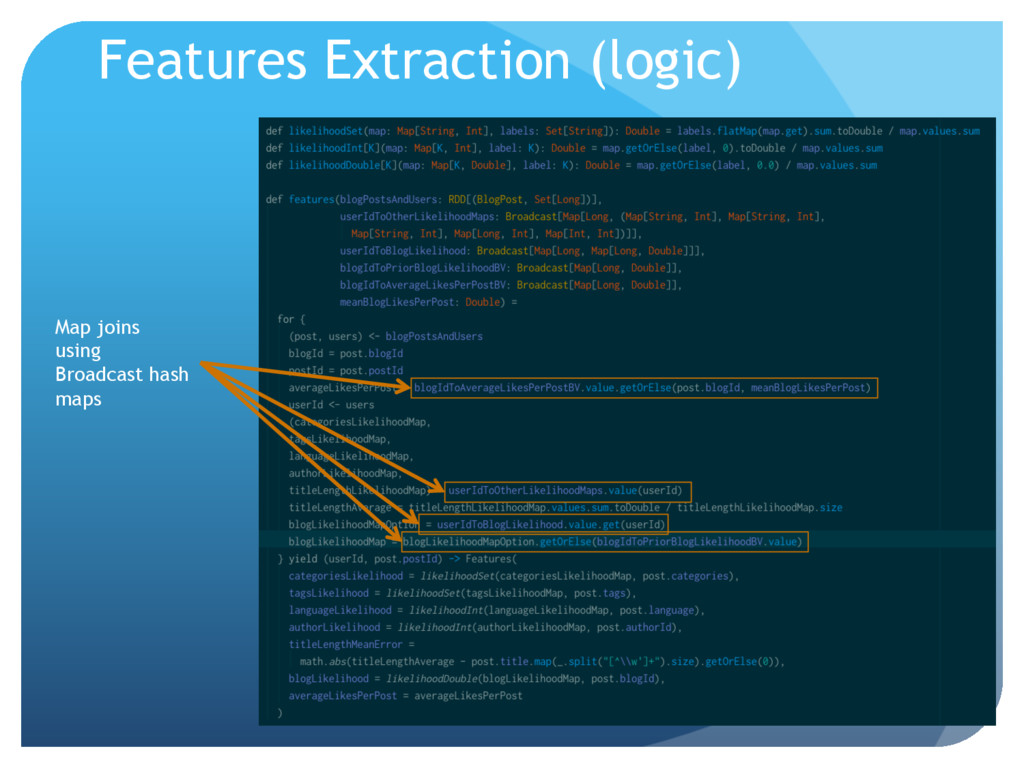
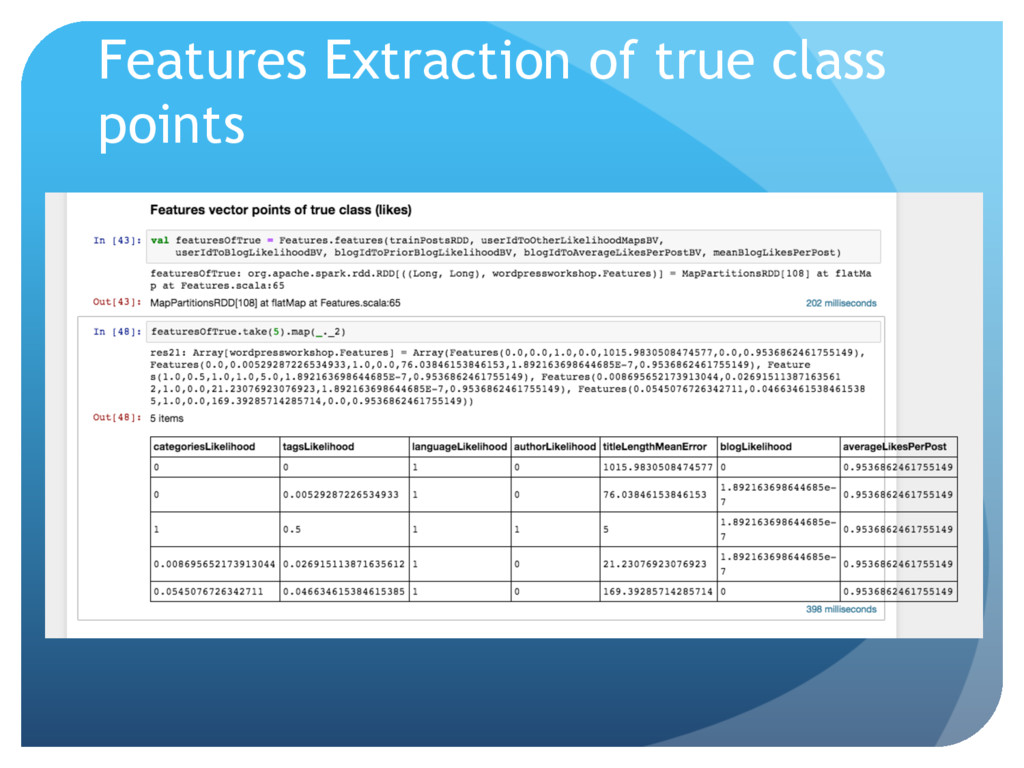
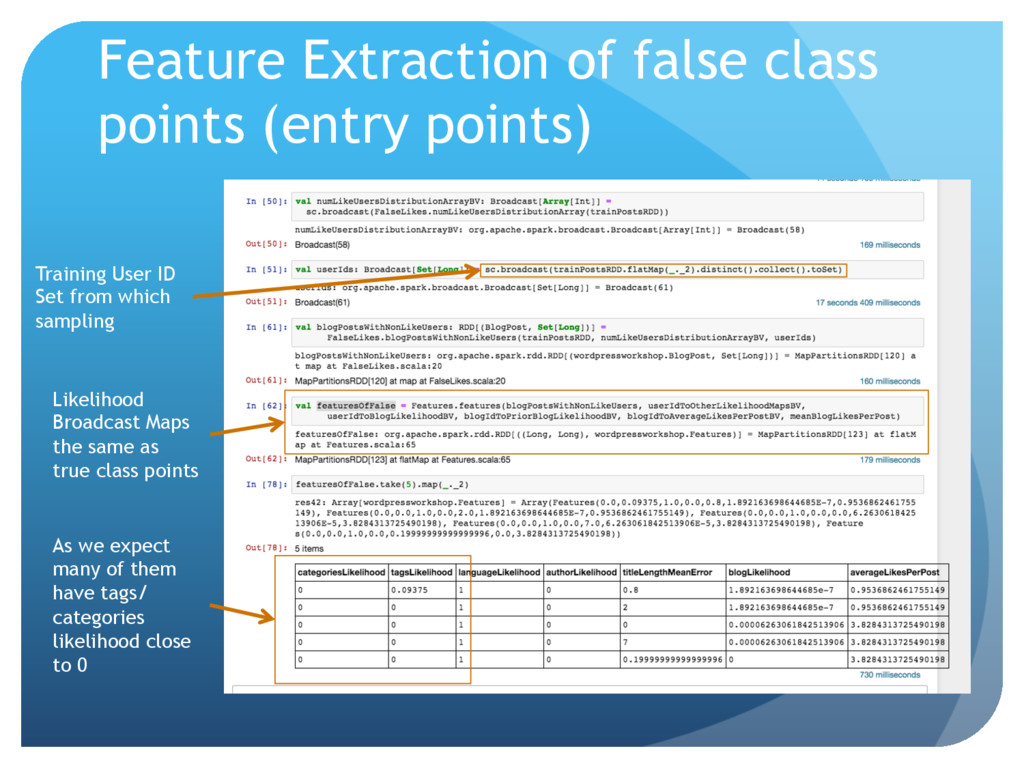
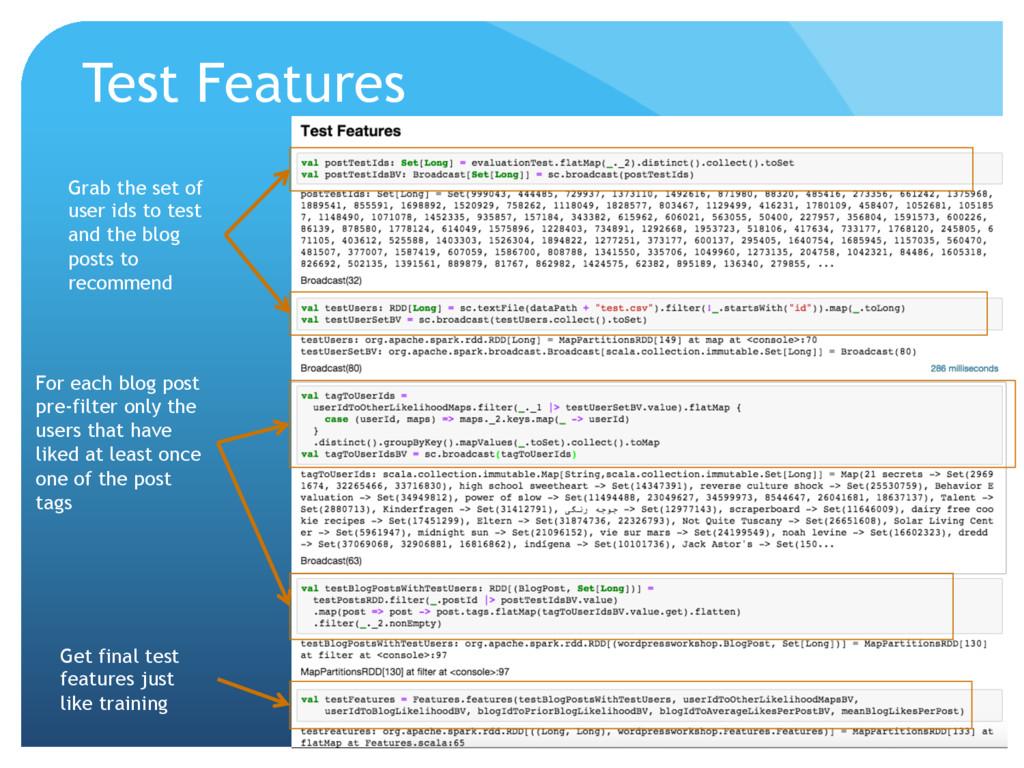
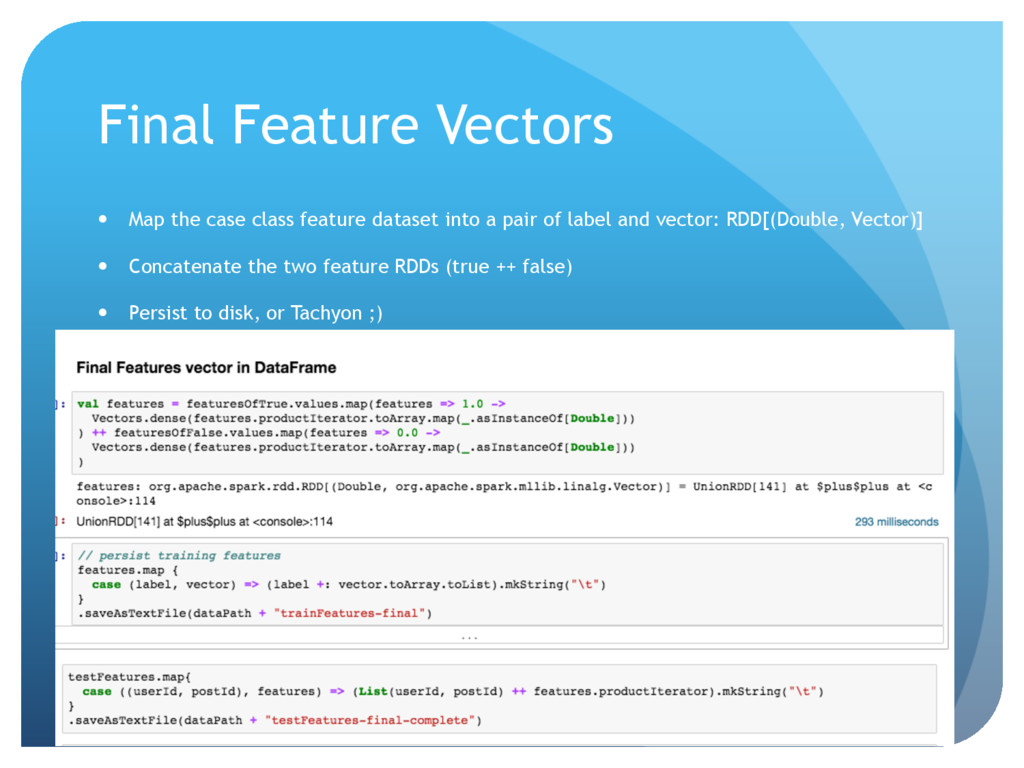
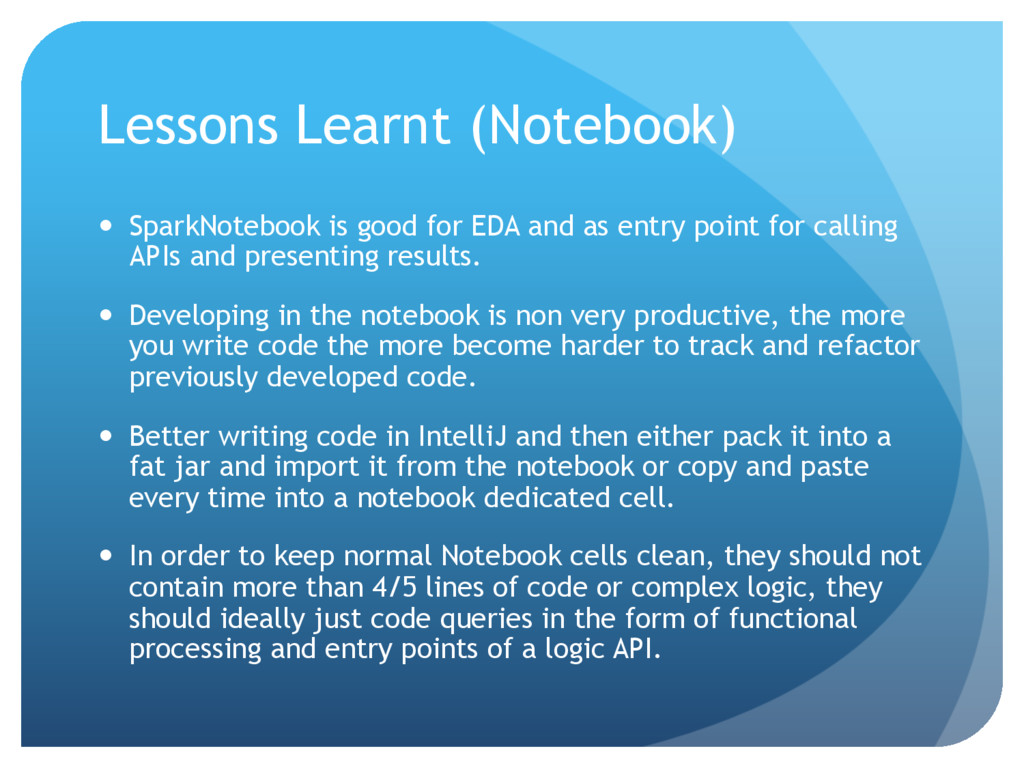
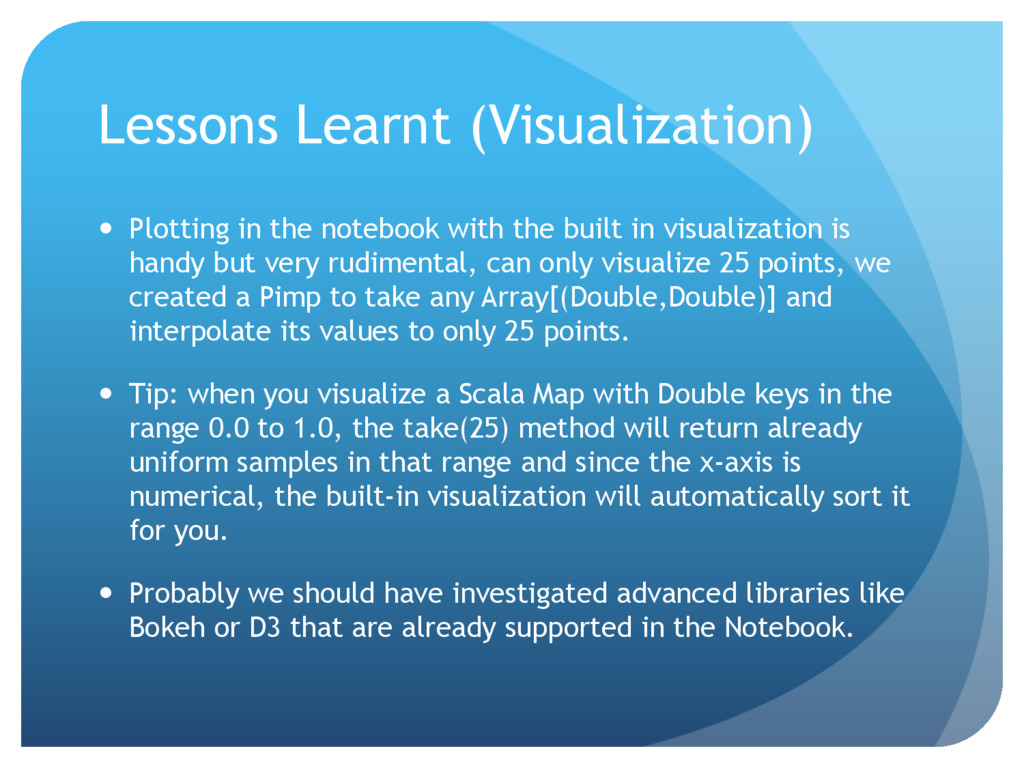
At the Advanced Data Analytics team at Barclays we solved the Kaggle competition of recommending WordPress blog posts that the users may like as proof-of-concept of how to use Spark, Scala and the Spark Notebook to solve a typical machine learning problem end-to-end.

Gianmario

November 16, 2015
Tweet

Other Decks in Technology

Transcript

  1. WordPress Blog Posts Recommender in Spark, Scala and the SparkNotebook

    Gianmario Spacagna @gm_spacagna https://github.com/gm-spacagna/wordpress-posts-recommender/
  2. Goal —  At the Advanced Data Analytics team at Barclays

    we solved the Kaggle competition as proof-of-concept of how to use Spark, Scala and the Spark Notebook to solve a typical machine learning problem end-to-end. —  Topics covered: —  DataFrame/RDD conversions and I/O —  Exploratory Data Analysis (EDA) —  Scalable Feature Engineering —  Modelling (MlLib and ML) —  End-to-end Evaluation —  Agile Methodology
  3. Case Study —  Recommending a sequence of WordPress blog posts

    that the users may like based on their historical likes and blog/post/author characteristics —  https://www.kaggle.com/c/predict-wordpress-likes
  4. Why Scala? —  Functional —  Native to Spark —  Compiled

    / Type Safe —  JVM means reliability and portability —  10x Productivity —  Great development environments like IntelliJ —  REPL shell
  5. Why Spark? —  Fast In Memory Computation —  Interactive — 

    Support Functional Programming —  Spark shell but lack of visualization tool and embedded story points
  6. What’s next? —  Methodology/tools for: —  Investigating Interactively the data;

    and —  Writing quality code in a productive environment; and —  Embedding the developed functions into executable entry points; and —  Presenting the results in a clean and visual way; and —  Meeting the required acceptance criteria. —  AKA: Delivering a Data Science MVP quickly in a complete Agile way!
  7. DataFrame vs RDDs —  DataFrame: —  Optimized execution plans — 

    Great I/O interfaces supporting many formats (json, jdbc, parquet) —  Schema inference from the Raw Source —  Columns defined at run time, no type tags —  Can fail at runtime if columns are inexistent —  UDFs must be registered —  Ad-hoc Domain Specific Language —  Looks more like Python/R —  RDD: —  Type safe API —  Functional, yep! J —  Is Scala code! —  Can use Case Classes —  Can use anonymous functions without registering them —  You have to optimize your execution plan —  Lower level Spark API —  Requires a little bit more of engineering
  8. DataFrame to Case Class RDD —  org.apache.spark.sql.Row objects can be

    casted into Sequences of Scala classes: val anyFieldList: List[Any] = row.toSeq.toList val stringByIndex: String = row.getAs[String](3) val longByColumnName: Long = row.getAs[Long](“post_id”) —  Careful with nulls —  df.na.drop() to remove rows containing null columns —  must explicitly handle for nested structures
  9. Raw Data and Domain Specific Data Types —  Raw Data:

    —  StatsBlog: 6 months of aggregate statistics about each blog. blog_id num_posts num_likes. —  StatsUser: 6 months of aggregate statistics about each user's like behavior. user_id num_likes. —  TrainPosts: Each line corresponds to one blog post from the training set along with the likes user_id array. —  Define case classes the way you want to model your application domain data decoupling from the raw format:
  10. Distribution of user num_likes —  Histogram Spark API will create

    uniform bins between min and max —  Better providing your custom bins
  11. Categories Frequency Distribution 45% of posts in the training set

    are Uncategorized, maybe treating them separately?
  12. Populate Missing Features (logic) —  Monoidal aggregations using |+| Scalaz

    operator: Hack for solving serialization issues on MapLike objects Default value for missing keys
  13. Users Likelihood Maps (complex logic) —  RDDs can be iterated

    in for-comprehension Take only Top 100 terms Words count
  14. Users Likelihood Maps (entry points and simple logic) Bound HashMap

    size to fix the in-memory allocation of the broadcast variable Anonymous type, maybe better having a case class
  15. Features —  categoriesLikelihood: probability of liking the post by the

    user only based on the categories term frquency of likes. —  tagsLikelihood: probability of liking the post by the user only based on the tags term frquency of likes. —  languageLikelihood: probability of liking the post by the user only based on the language frquency of likes. —  authorLikelihood: probability of liking the post by the user only based on the author frequency of likes. —  titleLengthMeanError: absolute difference between the title length and the average title length of liked posts. —  blogLikelihood: probability of liking the post by the user only based on the blog frequency of likes. —  averageLikesPerPost: average number of likes per post of that blog.
  16. Like users distribution —  We want to balance the number

    of false records according to the same distribution of true records
  17. Feature Extraction of false class points (logic) —  For each

    blog post generate a sample of user id subset that have not liked that post:
  18. Feature Extraction of false class points (entry points) Training User

    ID Set from which sampling As we expect many of them have tags/ categories likelihood close to 0 Likelihood Broadcast Maps the same as true class points
  19. Grab the set of user ids to test and the

    blog posts to recommend For each blog post pre-filter only the users that have liked at least once one of the post tags Get final test features just like training Test Features
  20. Final Feature Vectors —  Map the case class feature dataset

    into a pair of label and vector: RDD[(Double, Vector)] —  Concatenate the two feature RDDs (true ++ false) —  Persist to disk, or Tachyon ;)
  21. Reading back the Feature Vectors into DataFrame (Training) Filter out

    invalid values of features, they are not going to work in our model
  22. TagLikelihood Recommender Return an RDD of (userId, postId, rawLikeScore) where

    the rawLikeScore is anything between 0 and 1 Return the binary classification metrics from MlLib where the score is the index 1 of the feature vector, ergo the Tag Likelihood
  23. VizUtils Pimps —  We created some custom Pimps for helping

    in the built-in visualization of the Notebook —  Given an Array[(Double, Double)] representing (X,Y) points: —  interpolateLinear(n : Int) = return an array of n points with the x values sampled uniformely —  interpolatePercentiles(n: Int) = return an array of n points with the x values corresponding to the percentiles —  roundX(nDigits :Int) = round the X values to at most n digits —  https://github.com/gm-spacagna/wordpress-posts- recommender/blob/master/src/main/scala/ wordpressworkshop/Pimps.scala
  24. Limitations —  We run our experiments in Spark local mode

    since that the size of data was small enough but the implementation is so that it can scale for any size and any cluster. —  We did not leverage the DataFrame optimizations for the engineering part but we preferred the flexibility and functionalities of the classic RDDs. —  Features independency was not verified, for example we expect tagsLikelihood and categoriesLikelihood features to be highly correlated. PCA or similar techniques could have been adopted to make the solution more reliable. —  Whilst the training set was balanced, the test set contained many more false records. —  The whole analysis/modeling was performed statically without considering timestamps or sequence of events. —  We have not compared how Zeppelin compare to the SparkNotebook in terms of visualizations.
  25. Final Goal —  The goal was not proving the correctness

    of the solution but showing how you can easily implement and end-to-end scalable and production-quality solution for typical data science problem by leveraging Spark, Scala and the SparkNotebook.
  26. Lessons Learnt (Spark, Dataframe, RDDs) —  DataFrame is great for

    I/O, schema inference from the sources and when you have flatten schemas. Operations start to be more complicated with nested and array fields. —  RDD gives you the flexibility of doing your ETL using the richness of the Scala framework, in the other hand you must be careful on optimizing your execution plans. Functional Programming allowed us to express complex logic with a simple and clear code and free of side effects. —  Map joins with broadcast maps is very efficient but we need to make sure to reduce at minimum its size before to broadcast, e.g. applying some filtering to remove the unmatched keys before the join or capping the size of each value in case of size-variable structures (e.g. hash maps).
  27. Lessons Learnt (ML, MlLib) —  ETL and feature engineering is

    the most time-consuming part, once you obtained the data you want in vector format then you can convert back to DataFrame and use the ML APIs. —  ML unfortunately does not wrap everything available in MlLib, sometime you have to convert back to RDD[LabeledPoint] or RDD[(Double, Vector)] in order to use the MlLib features (e.g. evaluation metrics). —  ML pipeline API (Transformer, Estimator, Evaluator) seems cool but for an MVP is a pre-mature abstraction.
  28. Lessons Learnt (Modeling) —  Do not underestimate simple solutions. In

    the worst case they serve as baseline for benchmarking. —  Even tough the Logistic Regression was better on classifying as true or false, the simple model outperformed when running the end-to-end ranking evaluation. —  Focus on solving problems rather than models or algorithms. Many Data Science problems can be solved with counts and divisions, e.g. Naïve Bayes. —  Logistic Regression “raw scores” are NOT probabilities, treat them carefully!
  29. Lessons Learnt (Notebook) —  SparkNotebook is good for EDA and

    as entry point for calling APIs and presenting results. —  Developing in the notebook is non very productive, the more you write code the more become harder to track and refactor previously developed code. —  Better writing code in IntelliJ and then either pack it into a fat jar and import it from the notebook or copy and paste every time into a notebook dedicated cell. —  In order to keep normal Notebook cells clean, they should not contain more than 4/5 lines of code or complex logic, they should ideally just code queries in the form of functional processing and entry points of a logic API.
  30. Lessons Learnt (Visualization) —  Plotting in the notebook with the

    built in visualization is handy but very rudimental, can only visualize 25 points, we created a Pimp to take any Array[(Double,Double)] and interpolate its values to only 25 points. —  Tip: when you visualize a Scala Map with Double keys in the range 0.0 to 1.0, the take(25) method will return already uniform samples in that range and since the x-axis is numerical, the built-in visualization will automatically sort it for you. —  Probably we should have investigated advanced libraries like Bokeh or D3 that are already supported in the Notebook.
  31. Follow-up Links —  GitHub page and source code: https://github.com/gm-spacagna/wordpress-posts- recommender/

    —  Manifesto for Agile Data Science: www.datasciencemanifesto.org —  The complete 18 steps to start a new Agile Data Science project: https://datasciencevademecum.wordpress.com/ 2015/11/12/the-complete-18-steps-to-start-a-new- agile-data-science-project/