Provides a framework for assessing open educational resources (OER) projects at institutions to demonstrate the effectiveness of OER in student learning.
Gong, OER Project Manager Dr. Karen Hicks, Director of Assessment Lansing Community College MI-OER Summit, September 21, 2018 This work is licensed under the Creative Commons Attribution 4.0 International License.
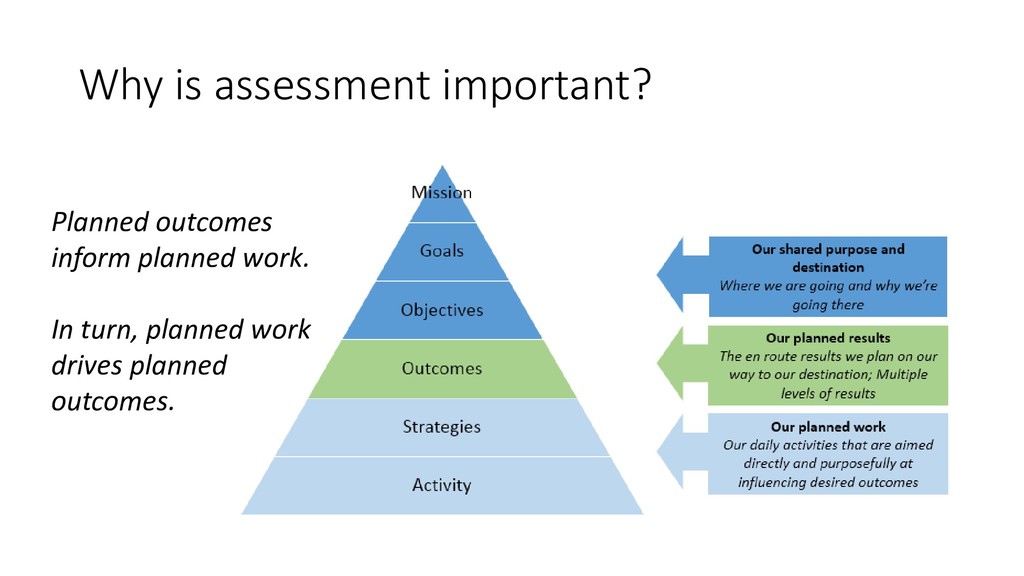
our OER project at LCC. • Importance of assessment. • Development of our assessment framework. • Elements and design of each assessment framework. • Snapshot of our data. • Questions and discussions.
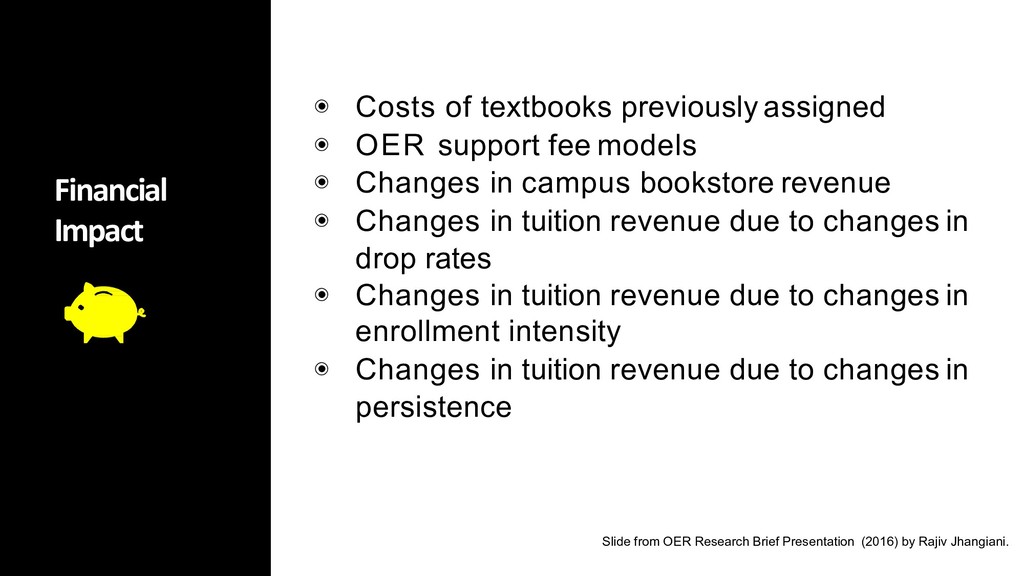
models ◉ Changes in campus bookstore revenue ◉ Changes in tuition revenue due to changes in drop rates ◉ Changes in tuition revenue due to changes in enrollment intensity ◉ Changes in tuition revenue due to changes in persistence Financial Impact Slide from OER Research Brief Presentation (2016) by Rajiv Jhangiani.
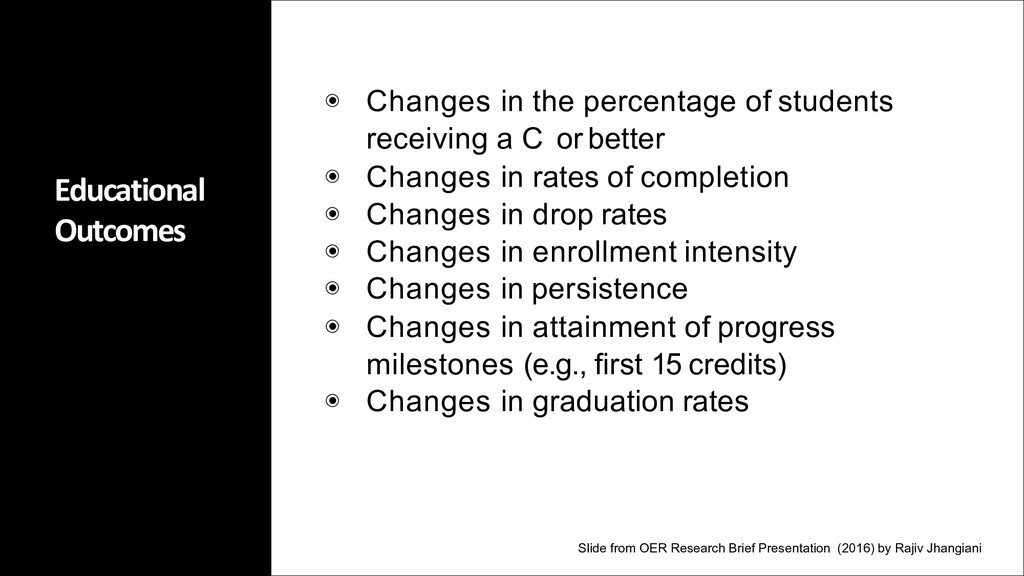
a C or better ◉ Changes in rates of completion ◉ Changes in drop rates ◉ Changes in enrollment intensity ◉ Changes in persistence ◉ Changes in attainment of progress milestones (e.g., first 15 credits) ◉ Changes in graduation rates Slide from OER Research Brief Presentation (2016) by Rajiv Jhangiani
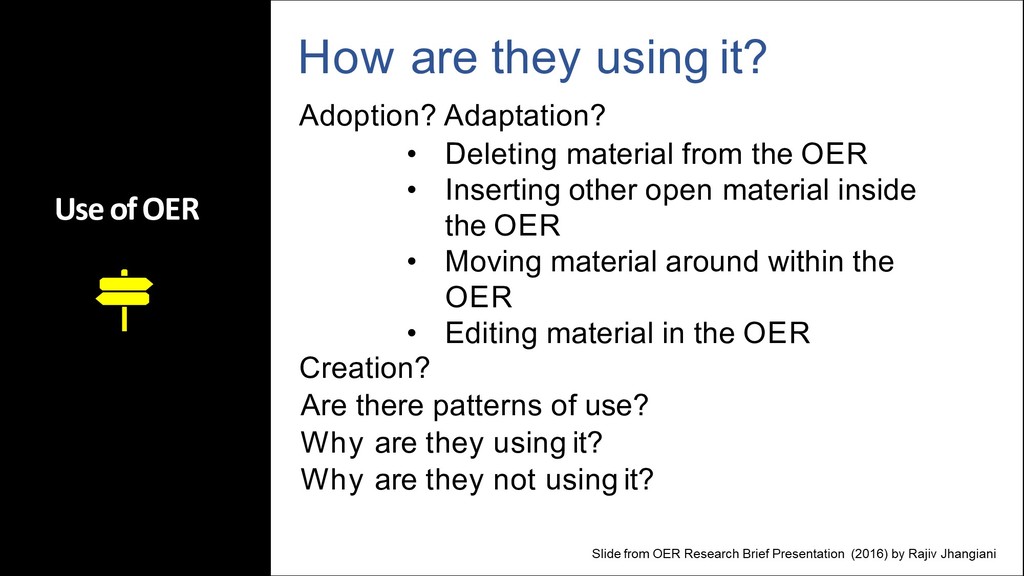
from the OER • Inserting other open material inside the OER • Moving material around within the OER • Editing material in the OER Creation? Are there patterns of use? Why are they using it? Why are they not using it? Use ofOER
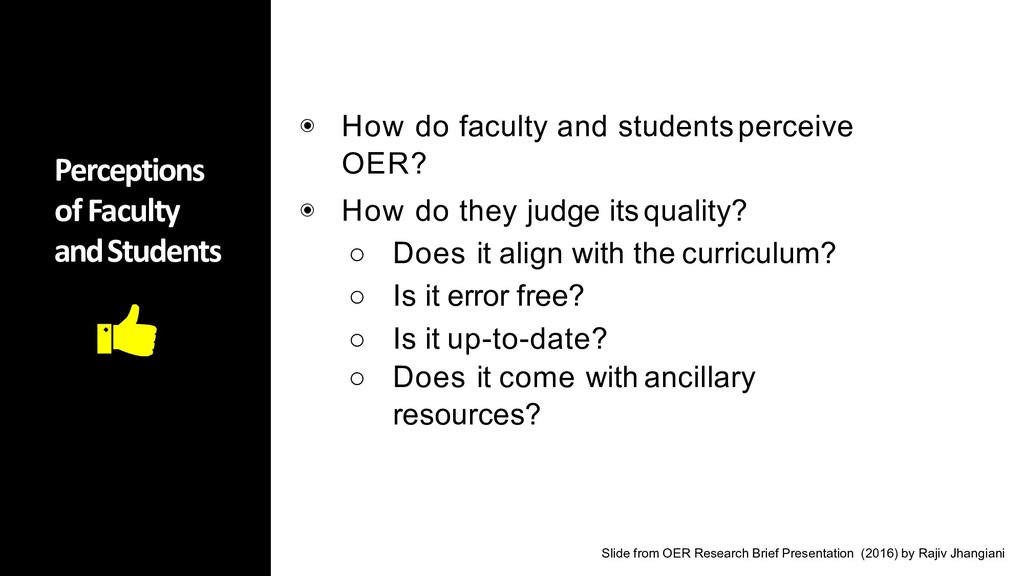
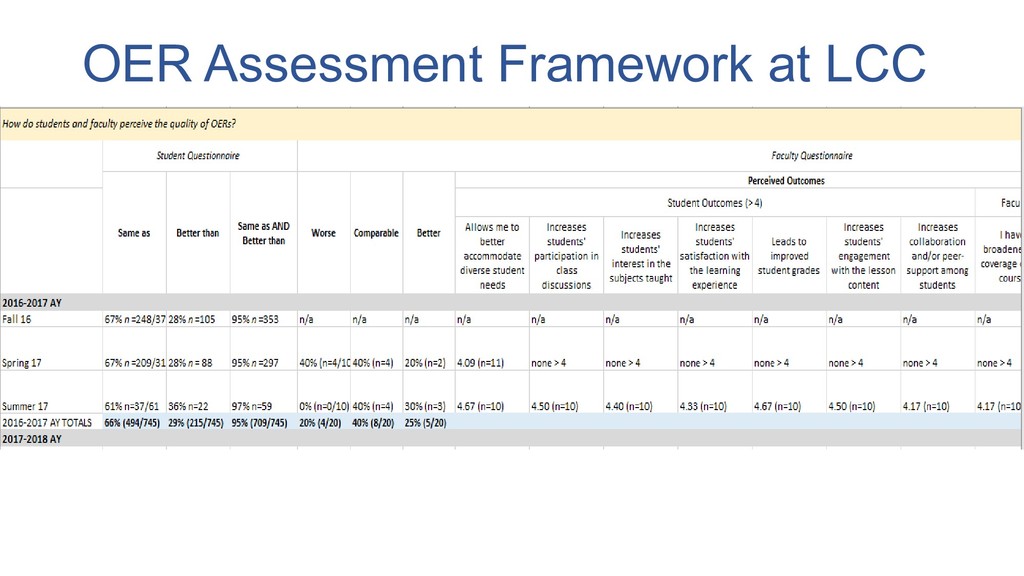
they judge its quality? ◦ Does it align with the curriculum? ◦ Is it error free? ◦ Is it up-to-date? ◦ Does it come with ancillary resources? Perceptions of Faculty andStudents Slide from OER Research Brief Presentation (2016) by Rajiv Jhangiani
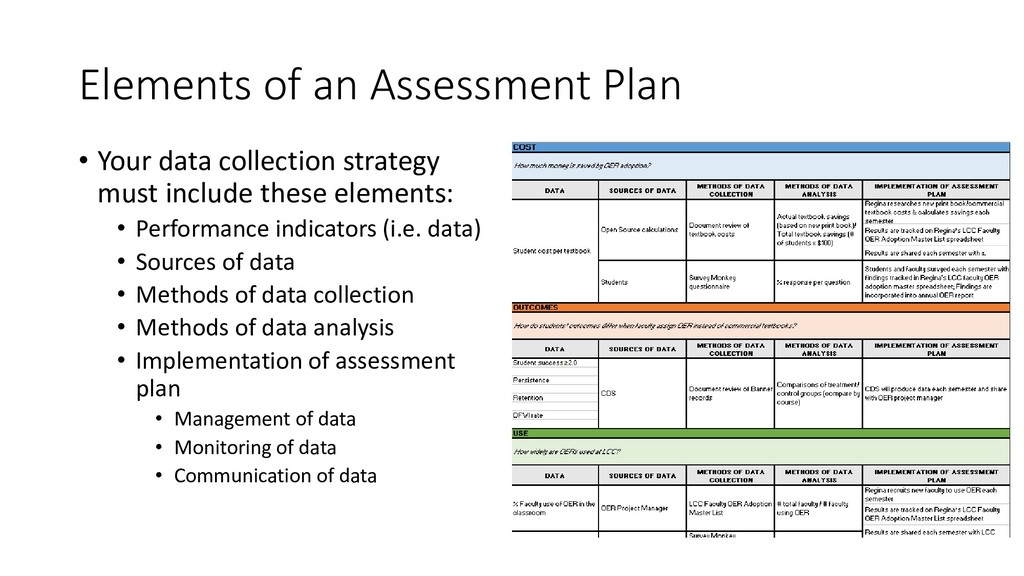
must include these elements: • Performance indicators (i.e. data) • Sources of data • Methods of data collection • Methods of data analysis • Implementation of assessment plan • Management of data • Monitoring of data • Communication of data
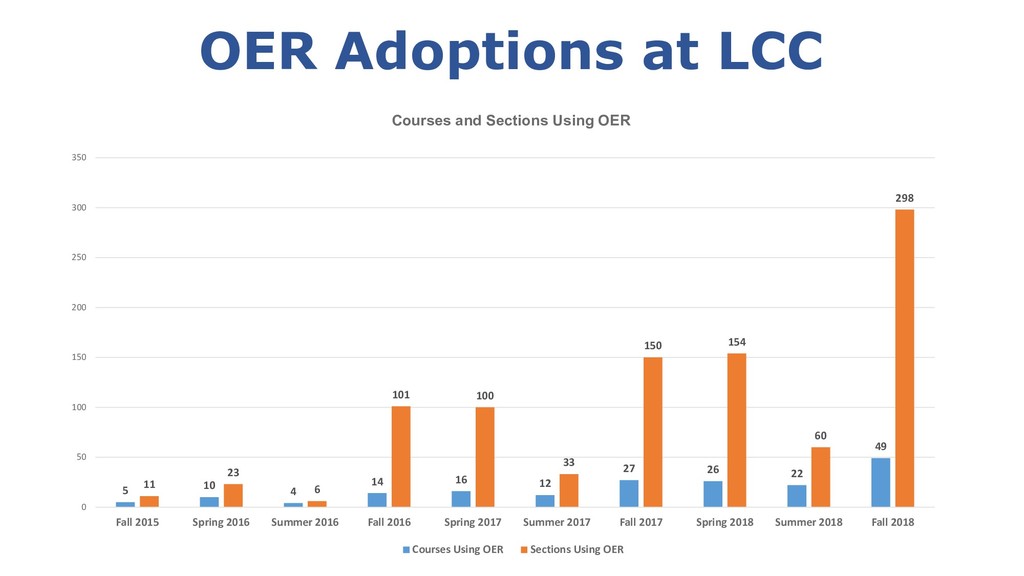
27 26 22 49 11 23 6 101 100 33 150 154 60 298 0 50 100 150 200 250 300 350 Fall 2015 Spring 2016 Summer 2016 Fall 2016 Spring 2017 Summer 2017 Fall 2017 Spring 2018 Summer 2018 Fall 2018 Courses and Sections Using OER Courses Using OER Sections Using OER
74 75 41 136 0 20 40 60 80 100 120 140 160 Fall 2015 Spring 2016 Summer 2016 Fall 2016 Spring 2017 Summer 2017 Fall 2017 Spring 2018 Summer 2018 Fall 2018 Faculty Using OER
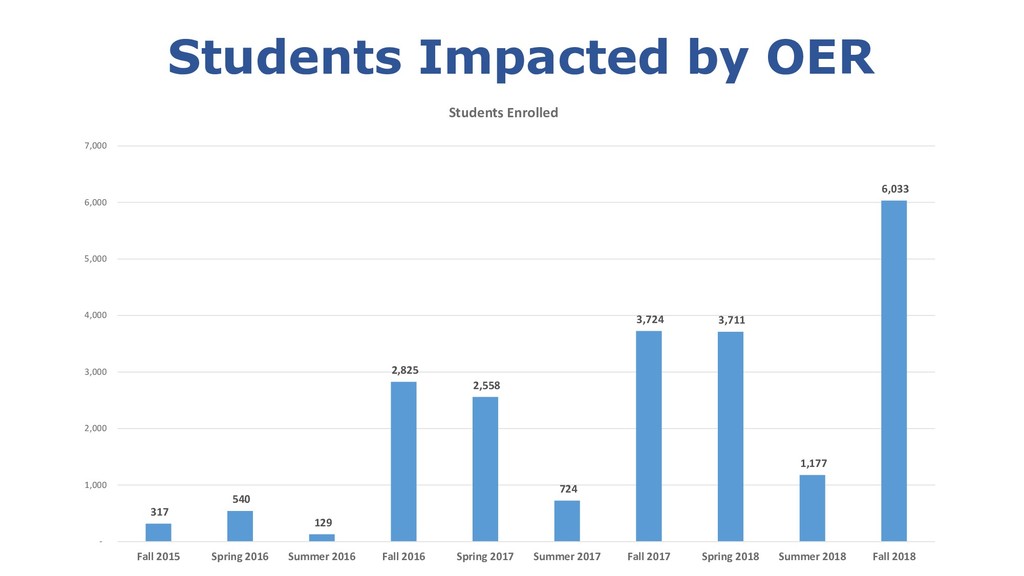
3,724 3,711 1,177 6,033 - 1,000 2,000 3,000 4,000 5,000 6,000 7,000 Fall 2015 Spring 2016 Summer 2016 Fall 2016 Spring 2017 Summer 2017 Fall 2017 Spring 2018 Summer 2018 Fall 2018 Students Enrolled
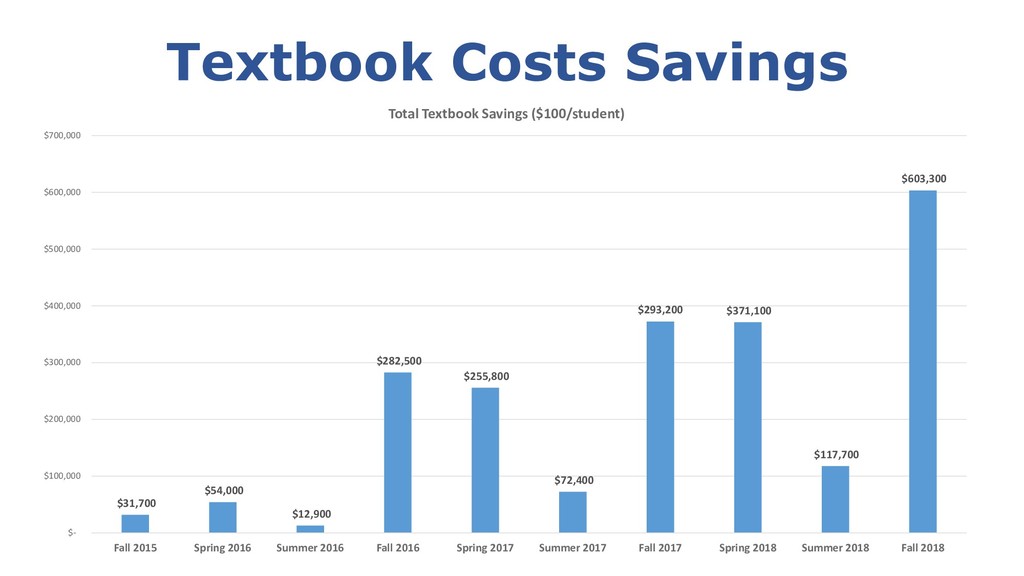
$371,100 $117,700 $603,300 $- $100,000 $200,000 $300,000 $400,000 $500,000 $600,000 $700,000 Fall 2015 Spring 2016 Summer 2016 Fall 2016 Spring 2017 Summer 2017 Fall 2017 Spring 2018 Summer 2018 Fall 2018 Total Textbook Savings ($100/student)
![Image source: https://unsplash.com/collections/167234/questions?photo=i--IN3cvEjg Regina Gong, [email protected]](https://files.speakerdeck.com/presentations/86ca25a6c3294fbaa7991323d55617fb/slide_30.jpg)