work as a Beam Dental a dental insurance startup based in Columbus Ohio. Twitter: @gregmalcolm Speakerdeck: https://speakerdeck.com/gregmalcolm/chrome-dev-tools Code: https://github.com/gregmalcolm/wacky-wandas-wicked-weapons-frontend https://github.com/gregmalcolm/wacky-wandas-wicked-weapons-api Caveat: The demo code was written in a hurry. It is indeed crude, buggy and not a good example of how to write a frontend. Which suits the purposes of this presentation just fine. Don’t judge me! :)
Whack Back In Wacky! “Putting the Whack back in Wacky!” I’ve been contracted to work on bugs on the new store front for Wicked Wanda’s Wicked Weapons. To save time I’m going to work on this while giving the demo, hope you don’t mind! <I give a quick demo of the app at this point and show that it needs work>
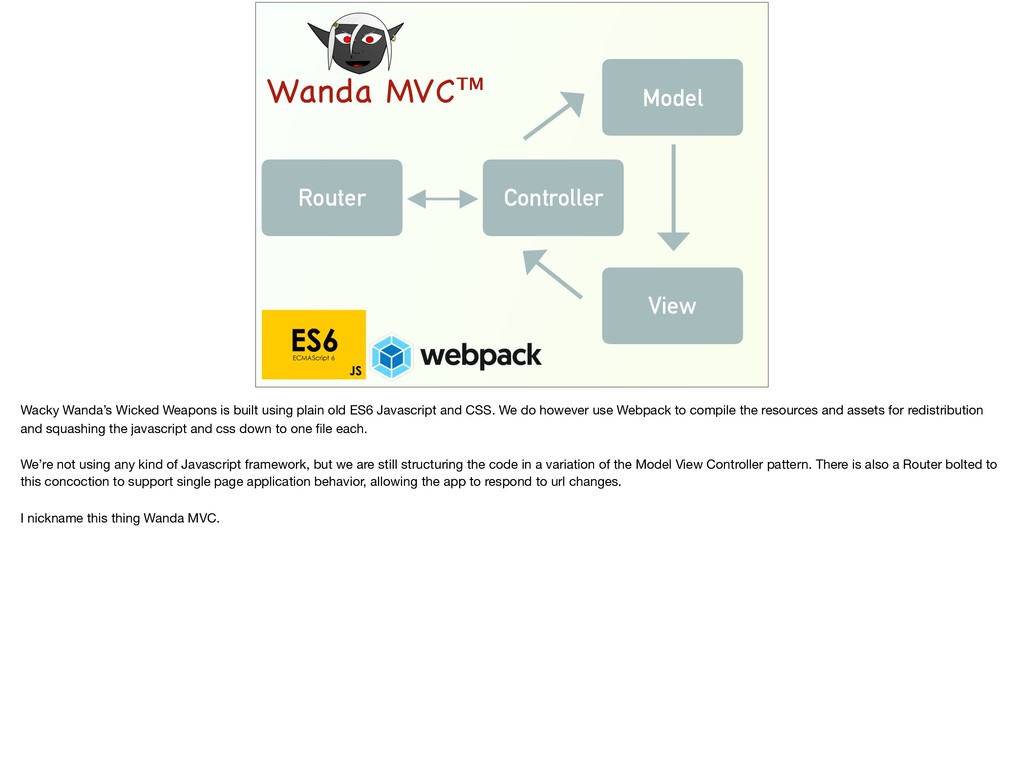
is built using plain old ES6 Javascript and CSS. We do however use Webpack to compile the resources and assets for redistribution and squashing the javascript and css down to one file each. We’re not using any kind of Javascript framework, but we are still structuring the code in a variation of the Model View Controller pattern. There is also a Router bolted to this concoction to support single page application behavior, allowing the app to respond to url changes. I nickname this thing Wanda MVC.
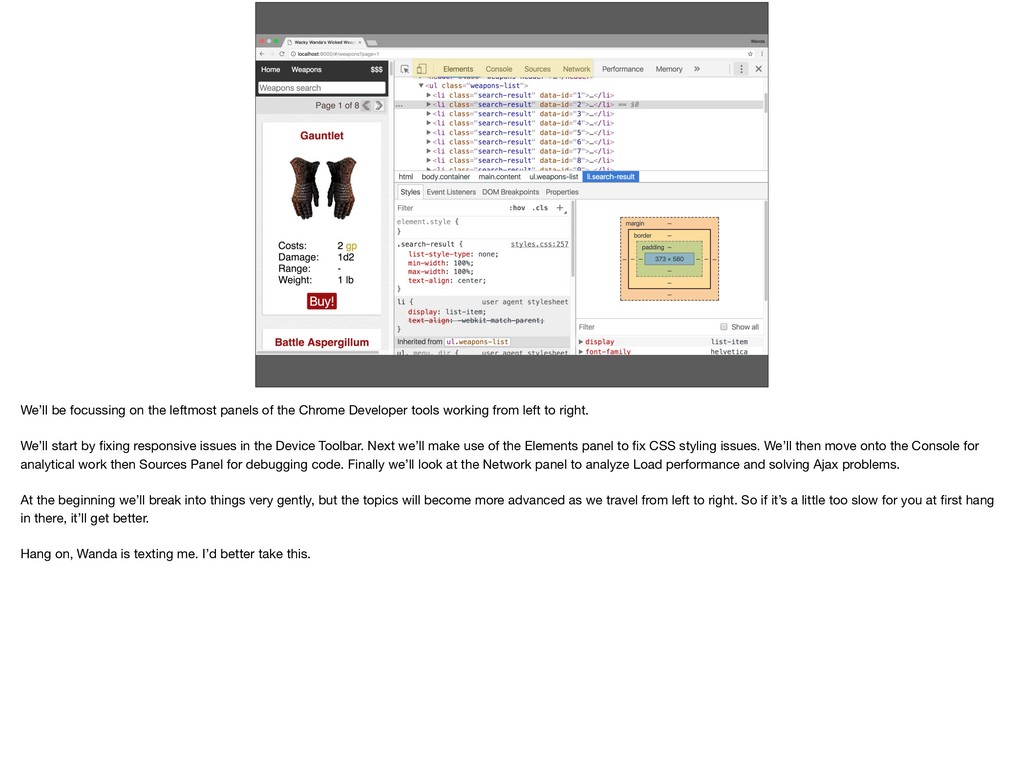
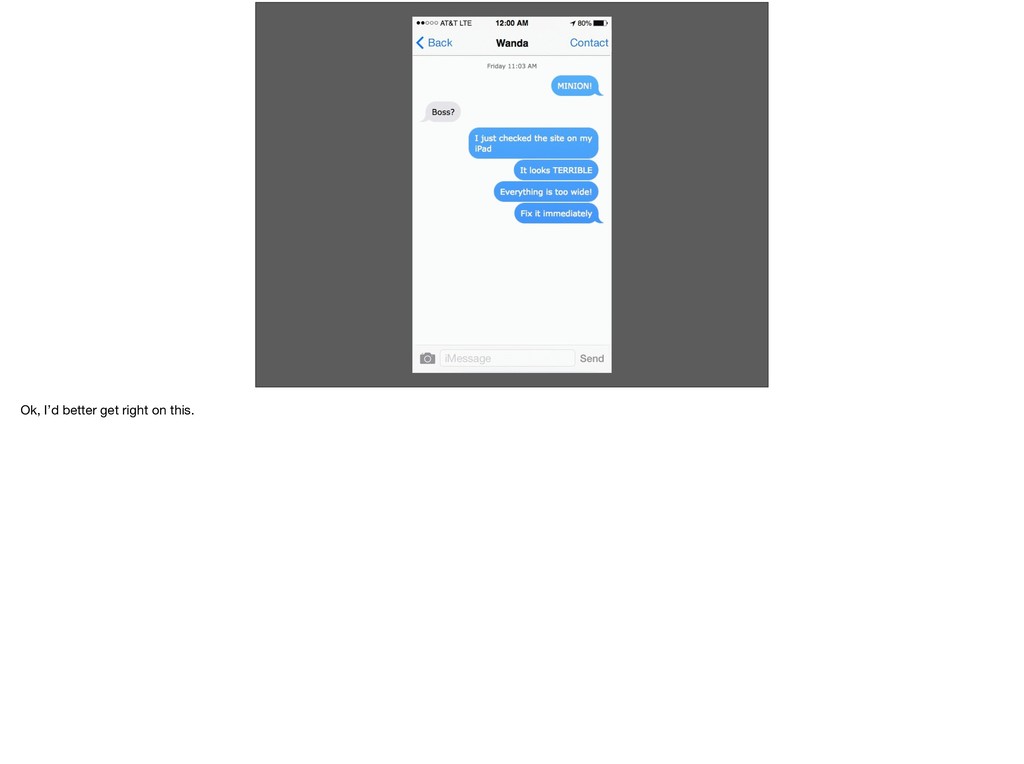
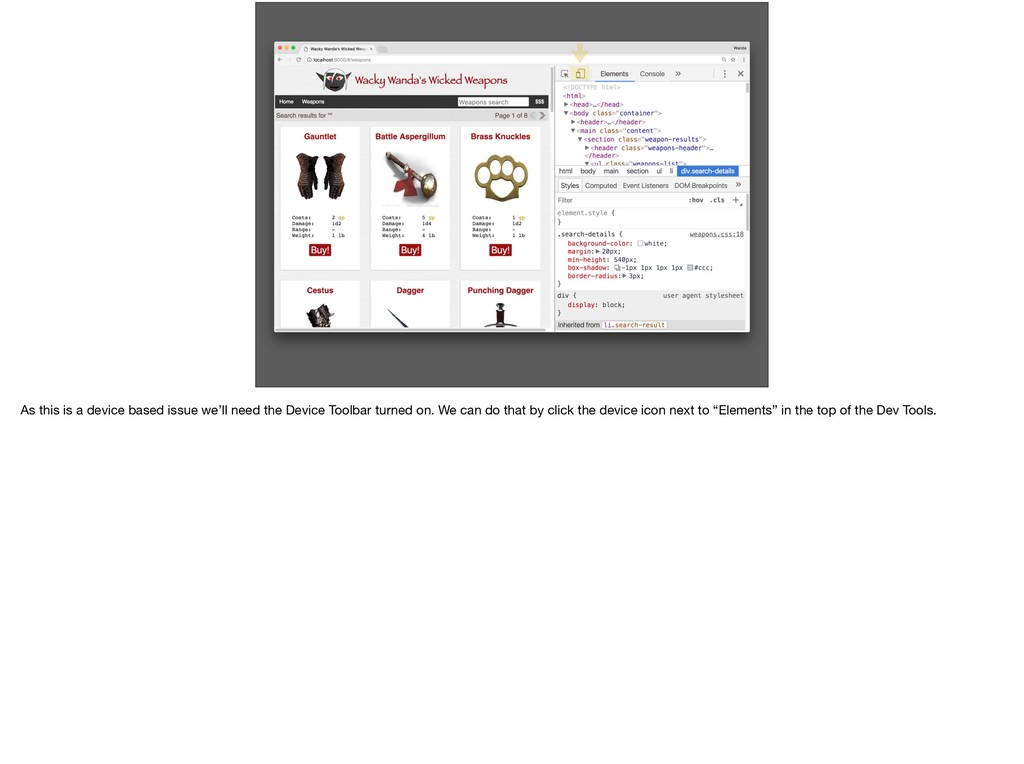
Developer tools working from left to right. We’ll start by fixing responsive issues in the Device Toolbar. Next we’ll make use of the Elements panel to fix CSS styling issues. We’ll then move onto the Console for analytical work then Sources Panel for debugging code. Finally we’ll look at the Network panel to analyze Load performance and solving Ajax problems. At the beginning we’ll break into things very gently, but the topics will become more advanced as we travel from left to right. So if it’s a little too slow for you at first hang in there, it’ll get better. Hang on, Wanda is texting me. I’d better take this.
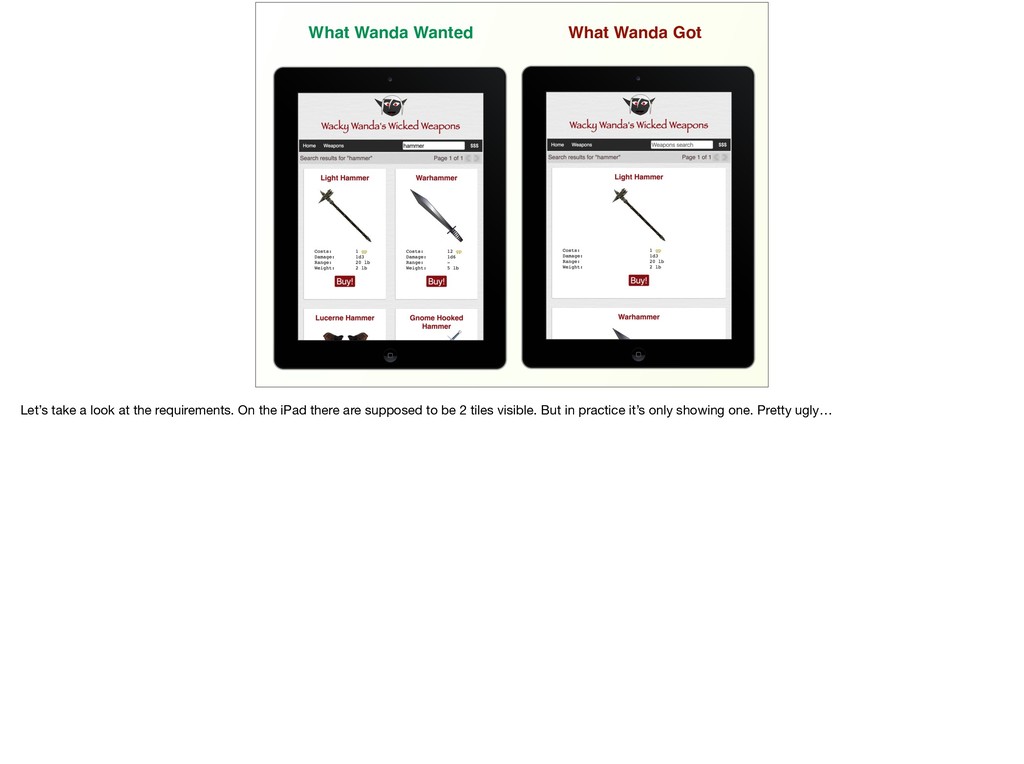
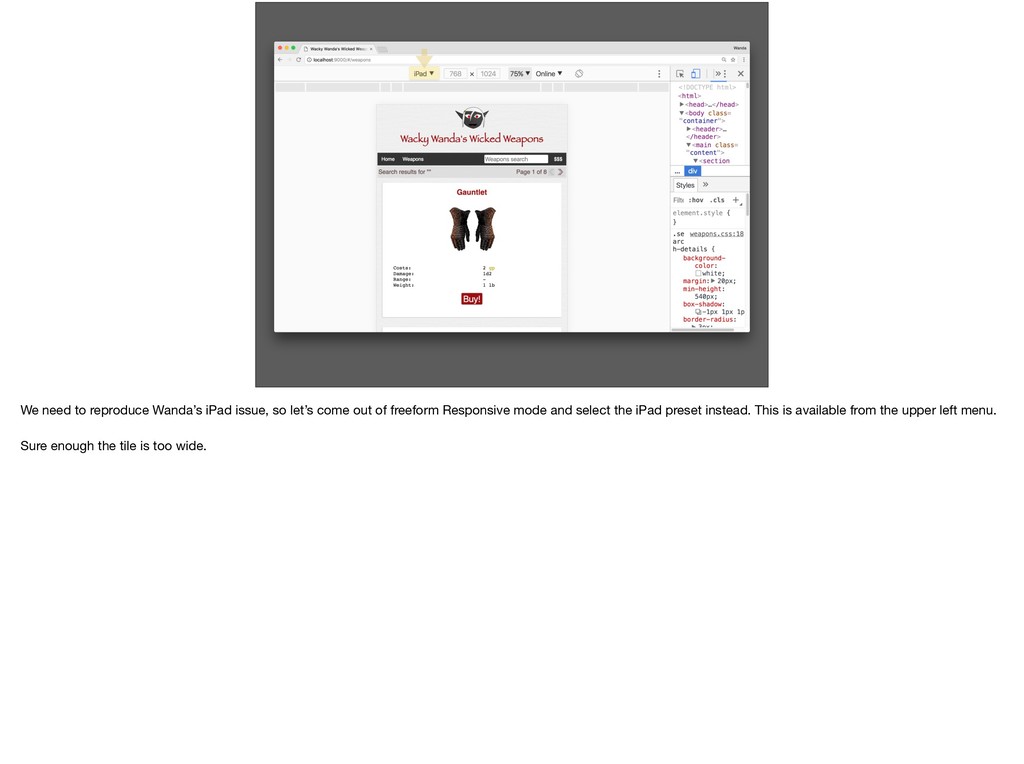
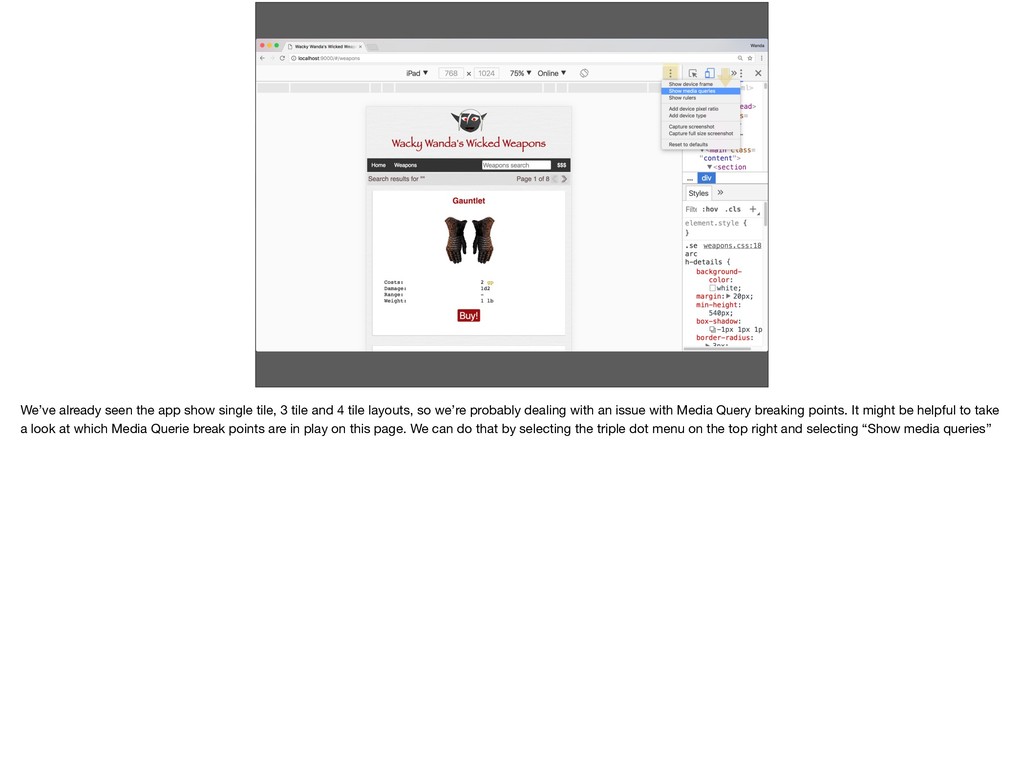
and 4 tile layouts, so we’re probably dealing with an issue with Media Query breaking points. It might be helpful to take a look at which Media Querie break points are in play on this page. We can do that by selecting the triple dot menu on the top right and selecting “Show media queries”
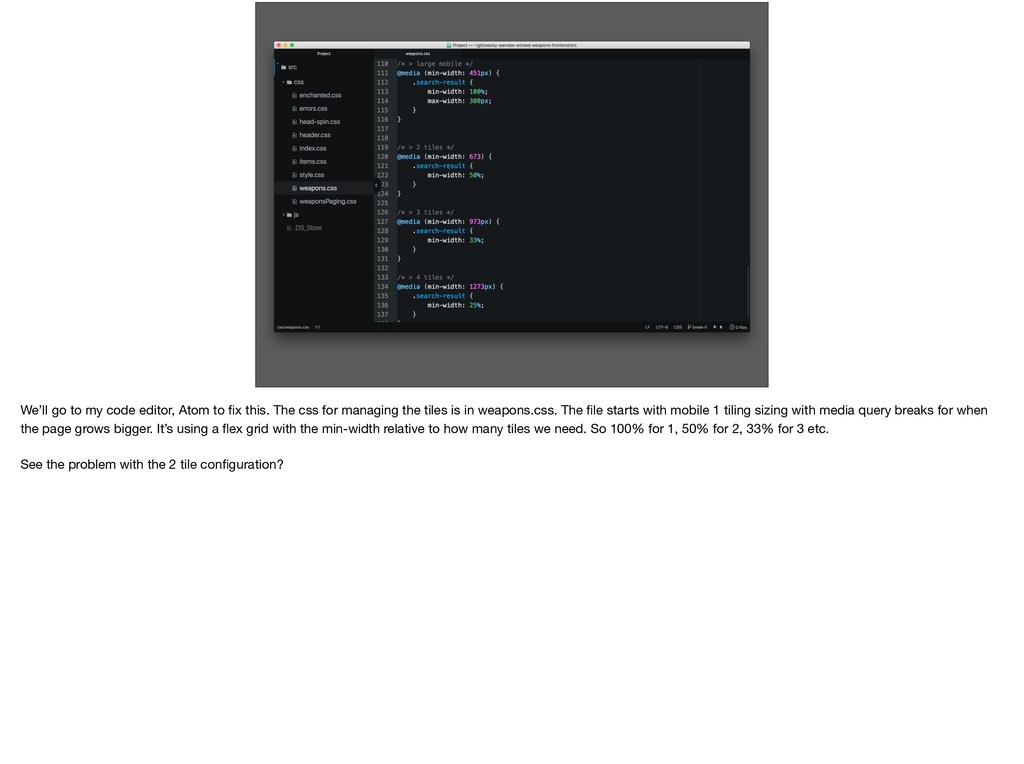
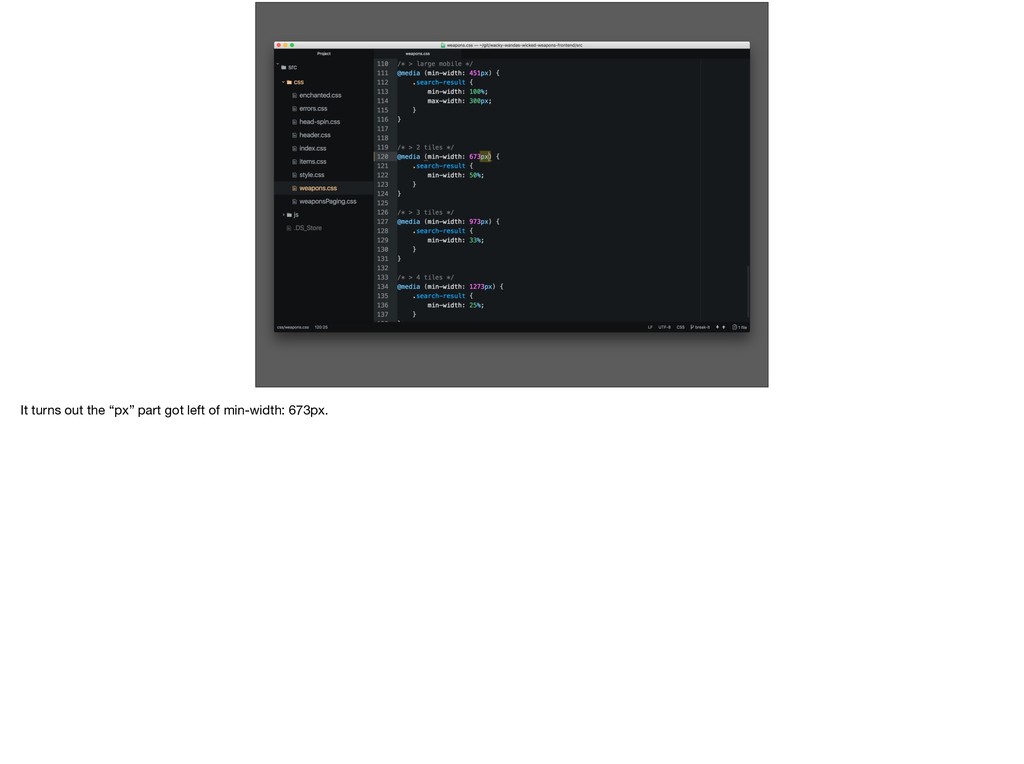
The css for managing the tiles is in weapons.css. The file starts with mobile 1 tiling sizing with media query breaks for when the page grows bigger. It’s using a flex grid with the min-width relative to how many tiles we need. So 100% for 1, 50% for 2, 33% for 3 etc. See the problem with the 2 tile configuration?
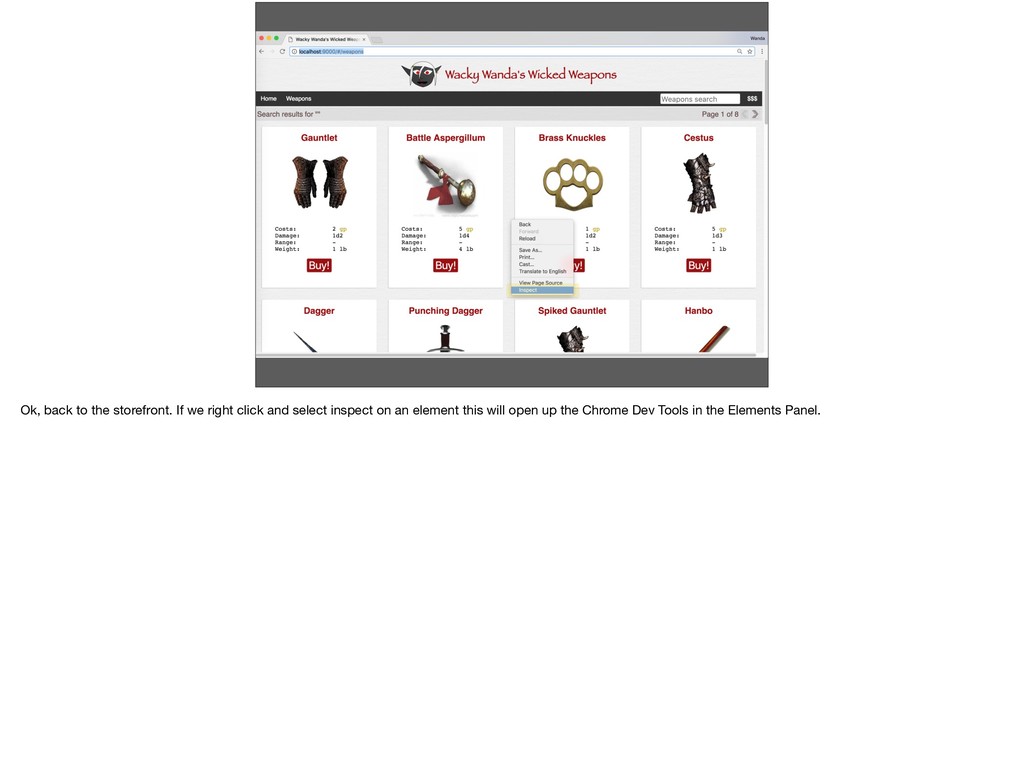
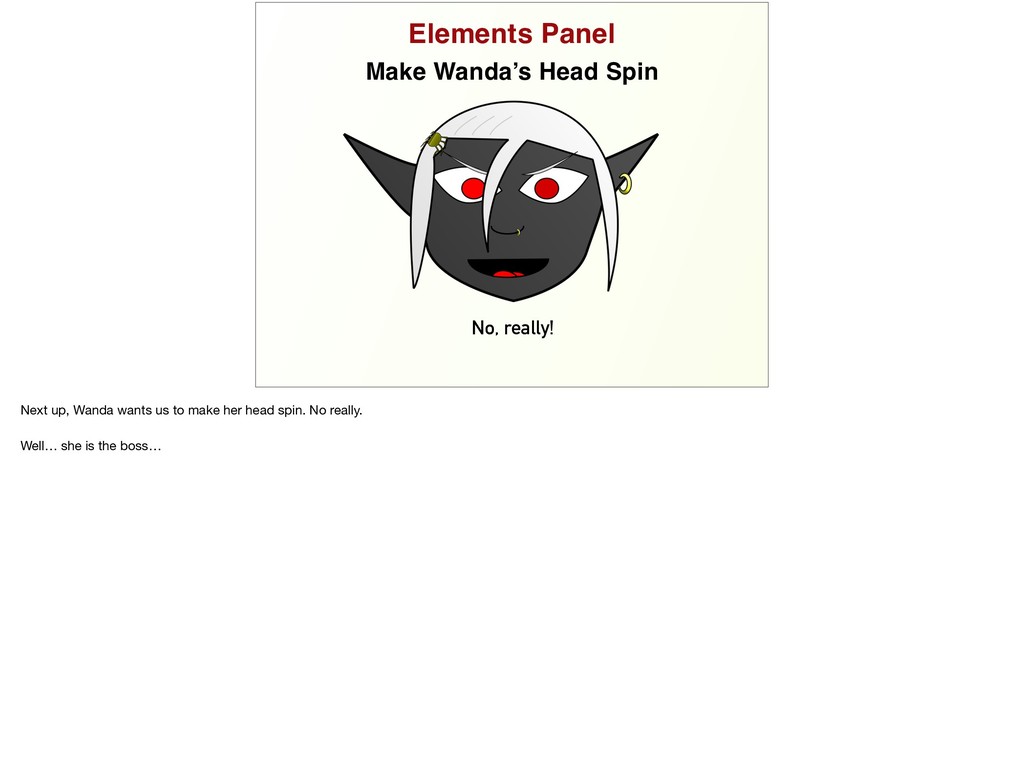
might as well turn off the device toolbar. This is purely a Styling problem so we’re going to work exclusively in the Elements Panel. I’ll go ahead an Inspect Wanda’s face which will take me right there.
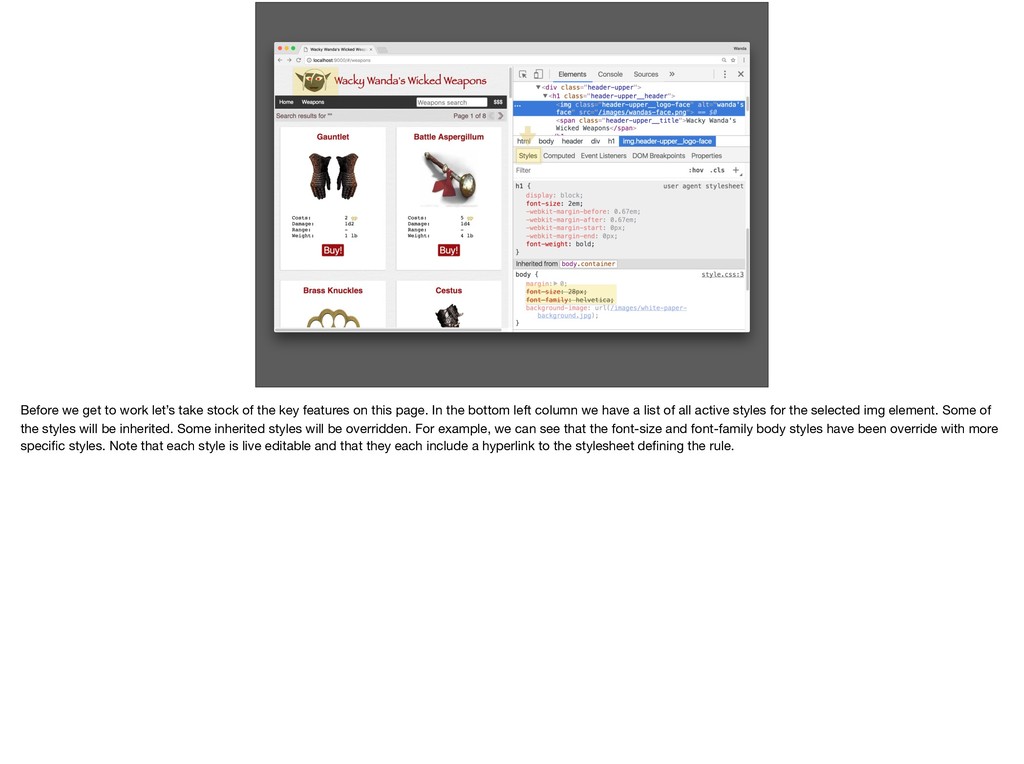
key features on this page. In the bottom left column we have a list of all active styles for the selected img element. Some of the styles will be inherited. Some inherited styles will be overridden. For example, we can see that the font-size and font-family body styles have been override with more specific styles. Note that each style is live editable and that they each include a hyperlink to the stylesheet defining the rule.
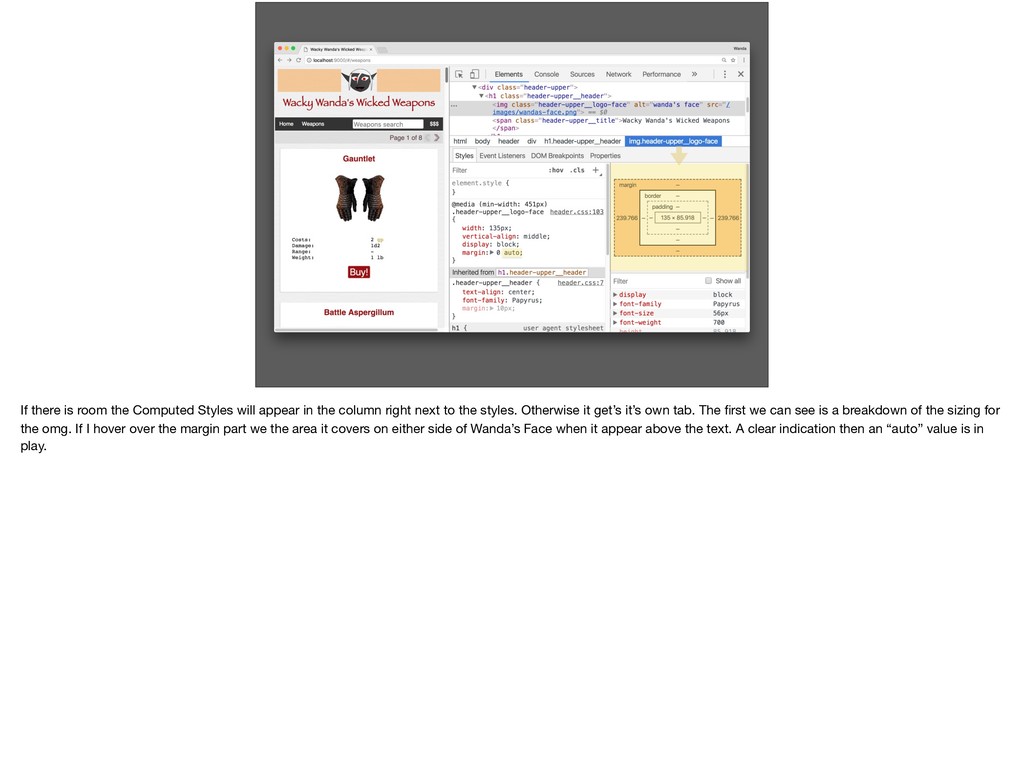
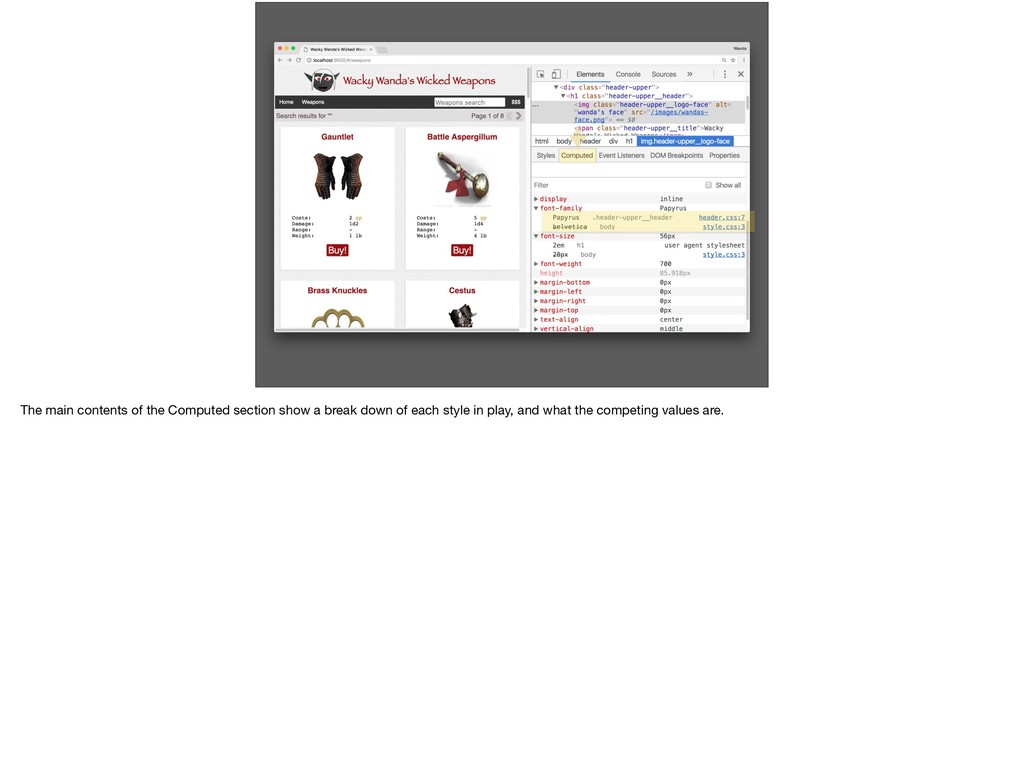
the column right next to the styles. Otherwise it get’s it’s own tab. The first we can see is a breakdown of the sizing for the omg. If I hover over the margin part we the area it covers on either side of Wanda’s Face when it appear above the text. A clear indication then an “auto” value is in play.
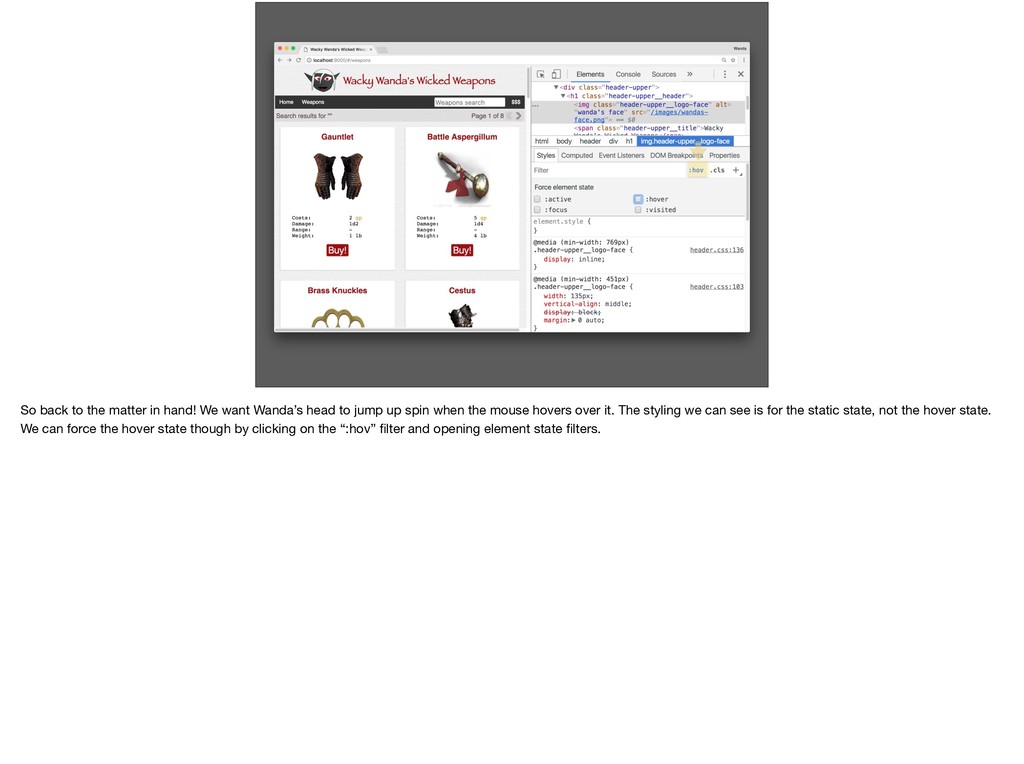
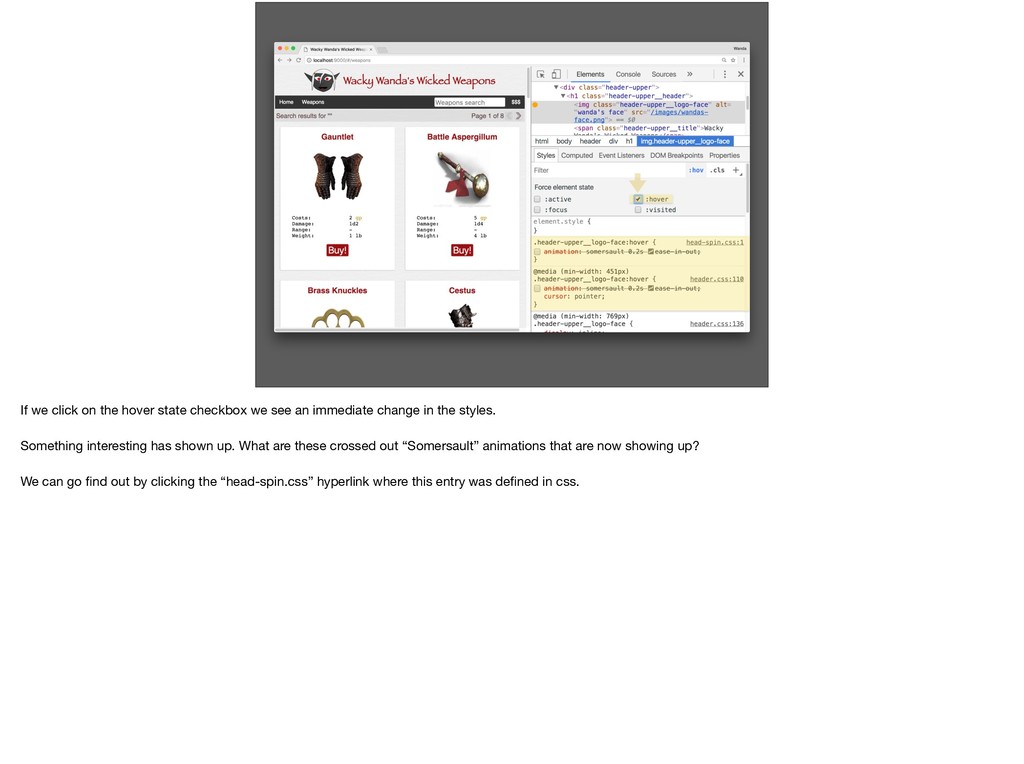
head to jump up spin when the mouse hovers over it. The styling we can see is for the static state, not the hover state. We can force the hover state though by clicking on the “:hov” filter and opening element state filters.
an immediate change in the styles. Something interesting has shown up. What are these crossed out “Somersault” animations that are now showing up? We can go find out by clicking the “head-spin.css” hyperlink where this entry was defined in css.
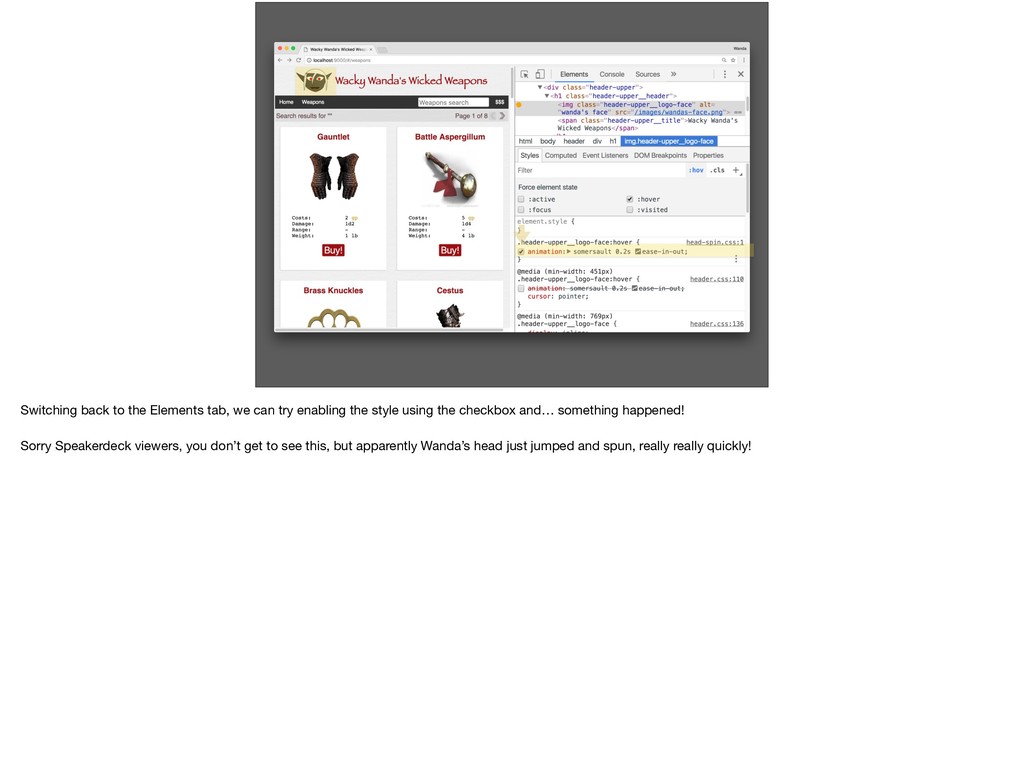
the style using the checkbox and… something happened! Sorry Speakerdeck viewers, you don’t get to see this, but apparently Wanda’s head just jumped and spun, really really quickly!
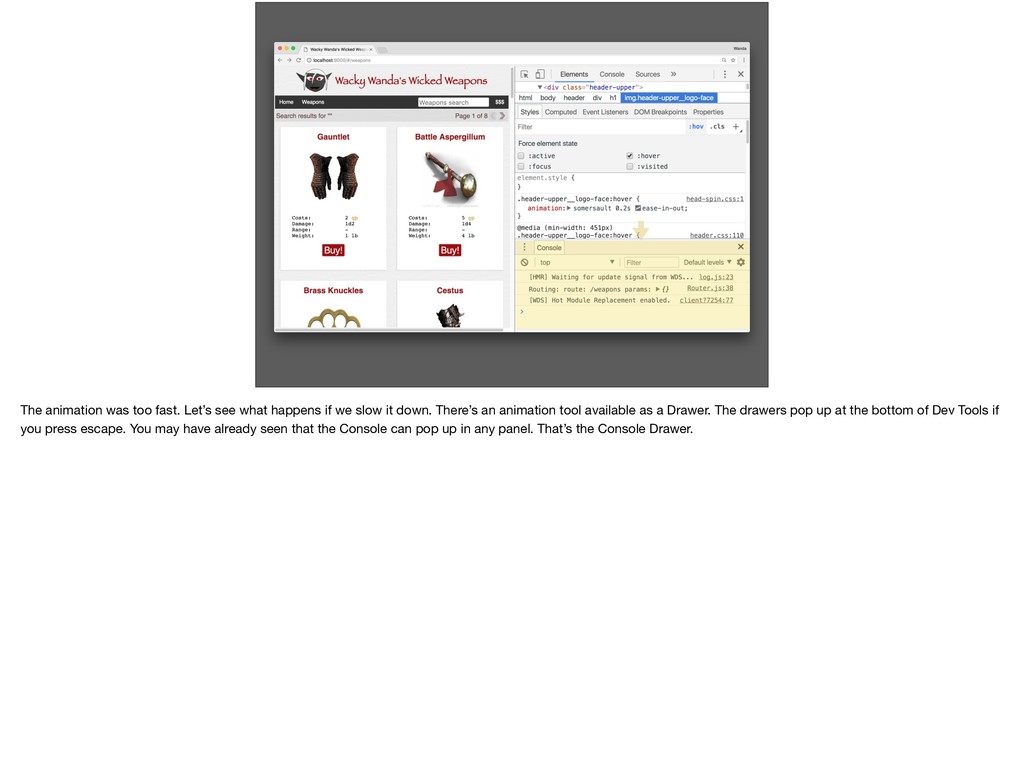
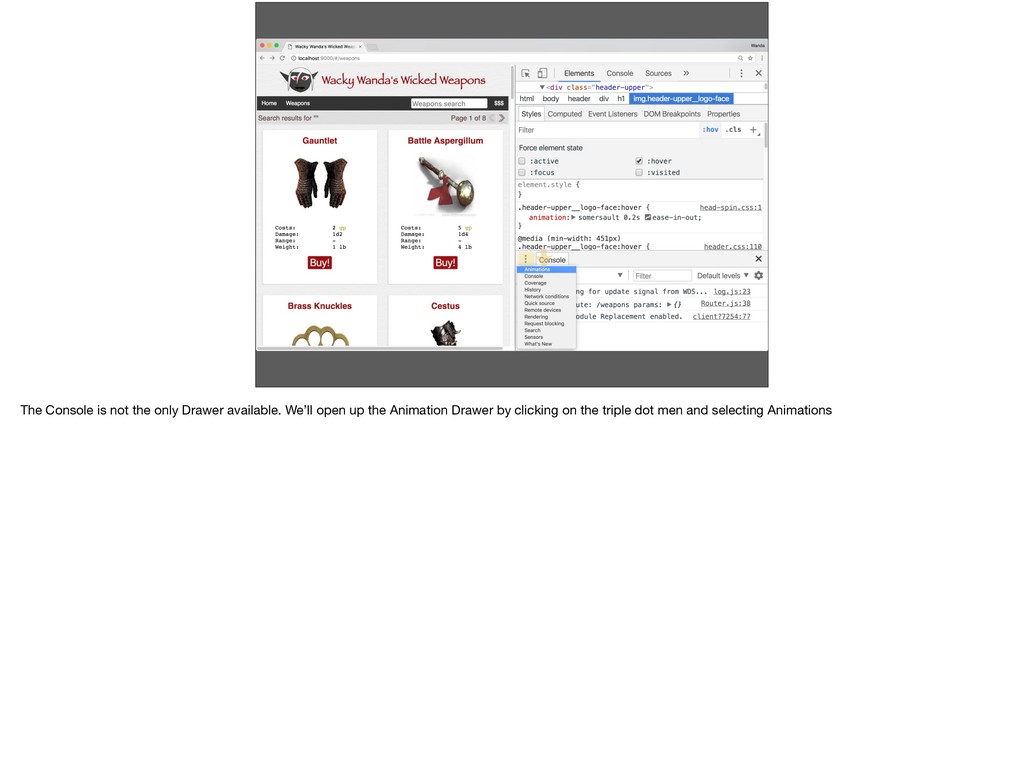
we slow it down. There’s an animation tool available as a Drawer. The drawers pop up at the bottom of Dev Tools if you press escape. You may have already seen that the Console can pop up in any panel. That’s the Console Drawer.
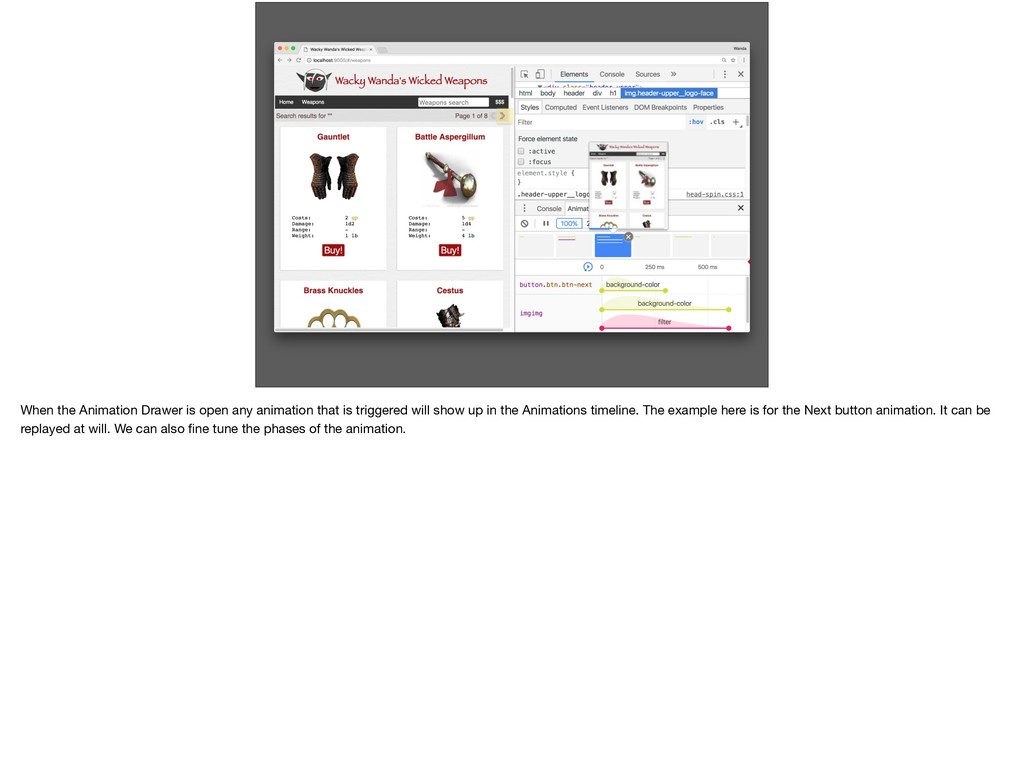
triggered will show up in the Animations timeline. The example here is for the Next button animation. It can be replayed at will. We can also fine tune the phases of the animation.
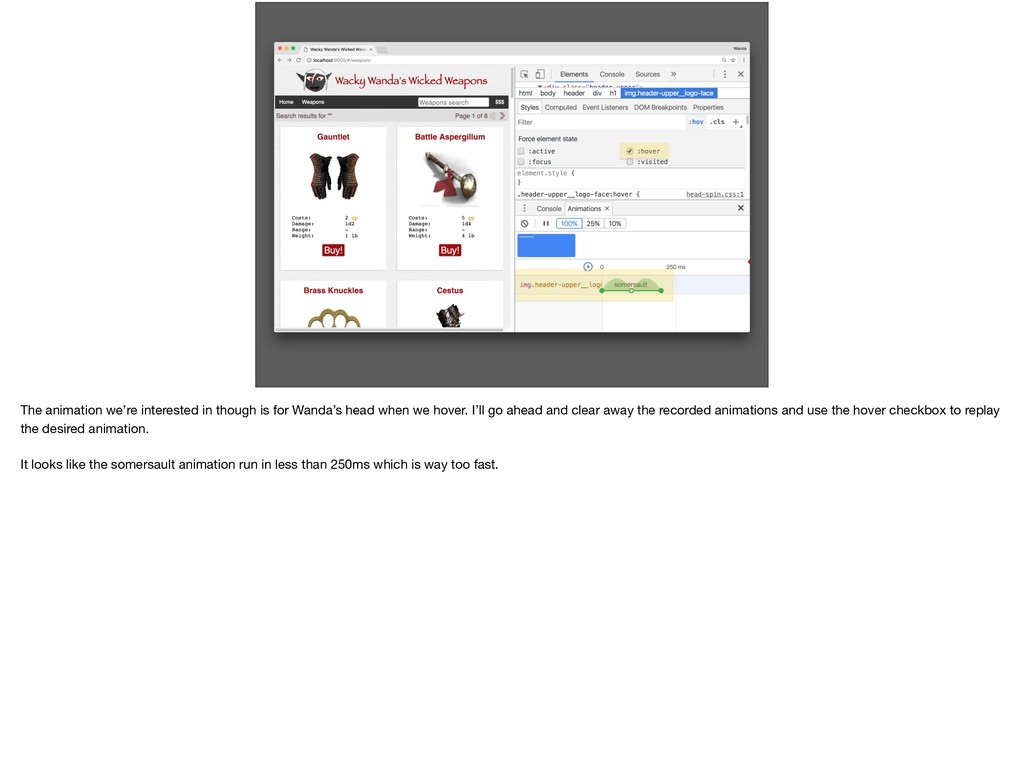
when we hover. I’ll go ahead and clear away the recorded animations and use the hover checkbox to replay the desired animation. It looks like the somersault animation run in less than 250ms which is way too fast.
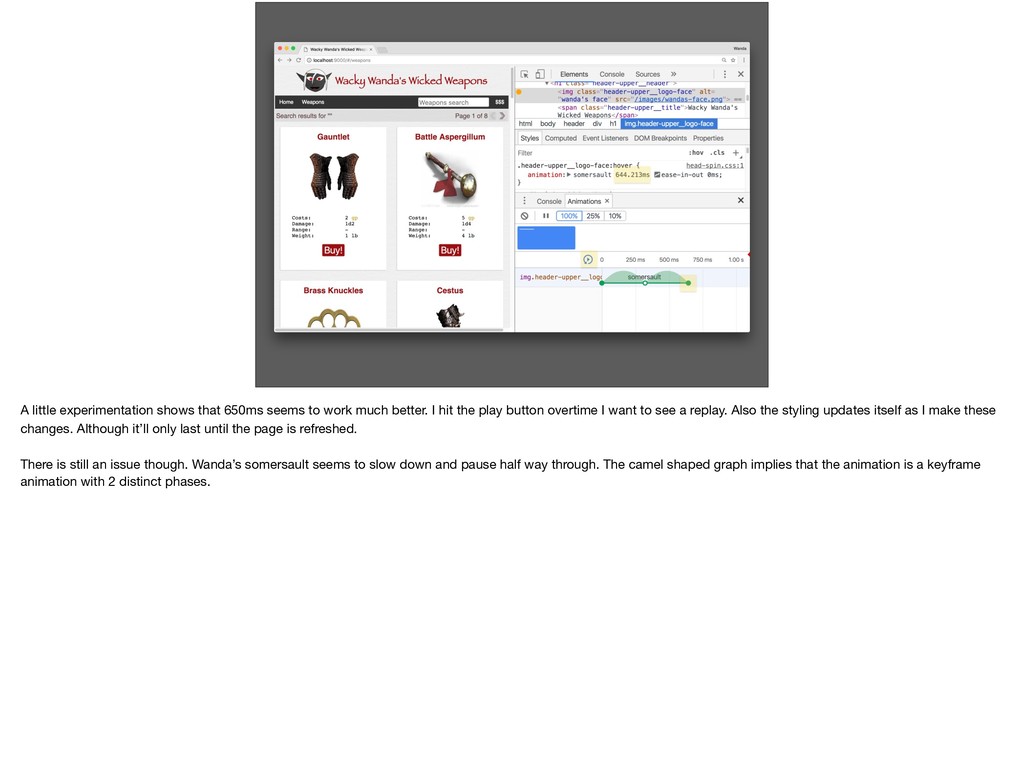
better. I hit the play button overtime I want to see a replay. Also the styling updates itself as I make these changes. Although it’ll only last until the page is refreshed. There is still an issue though. Wanda’s somersault seems to slow down and pause half way through. The camel shaped graph implies that the animation is a keyframe animation with 2 distinct phases.
a keyframe animation with 3 points: At 0%: No movement yet At 50%: Wanda’s face is transformed so her face is in the air and rotated so that it is upside down At 100%: A reverse transformation occurs. Wanda’s head continues the rotation back to origin.
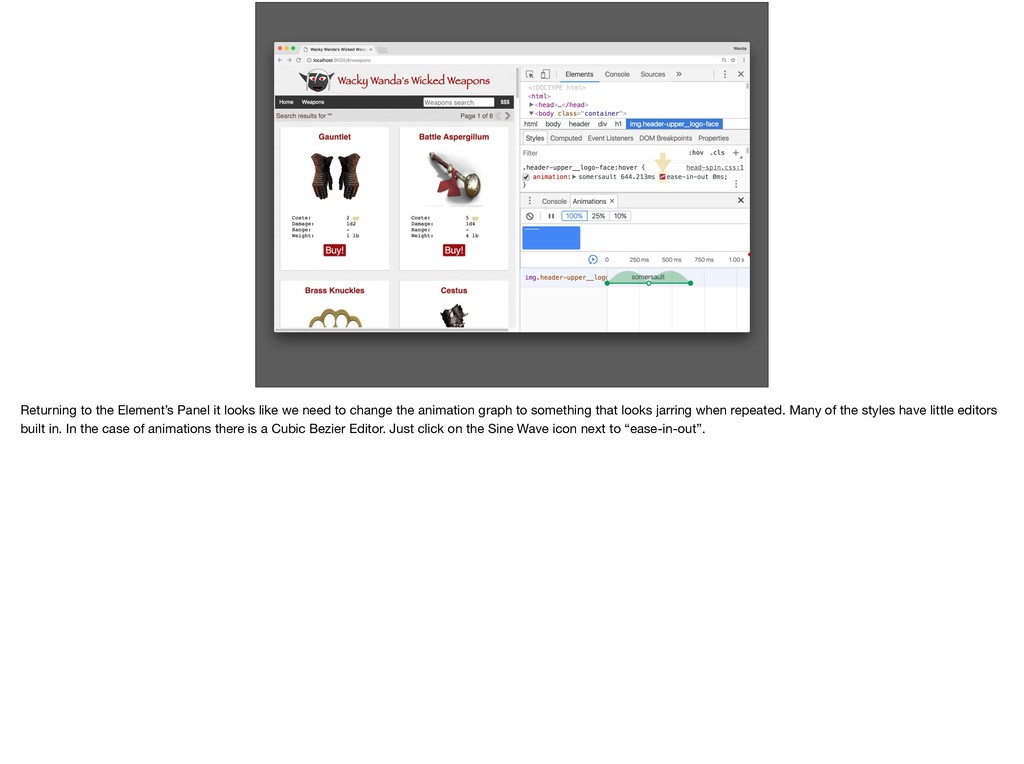
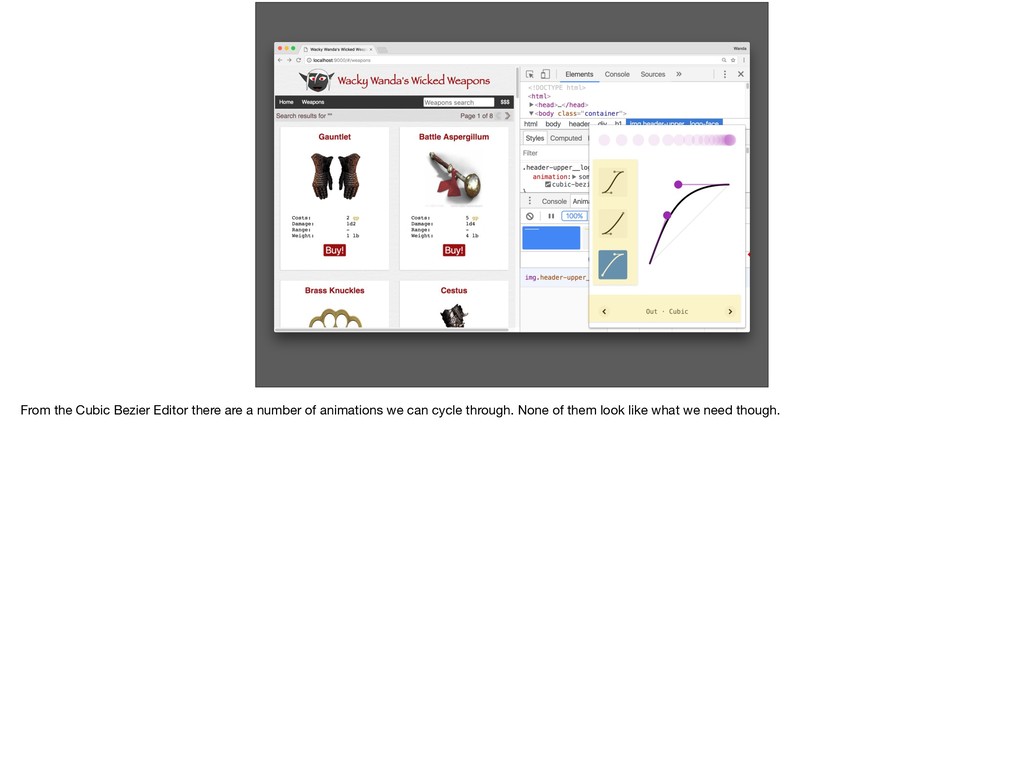
to change the animation graph to something that looks jarring when repeated. Many of the styles have little editors built in. In the case of animations there is a Cubic Bezier Editor. Just click on the Sine Wave icon next to “ease-in-out”.
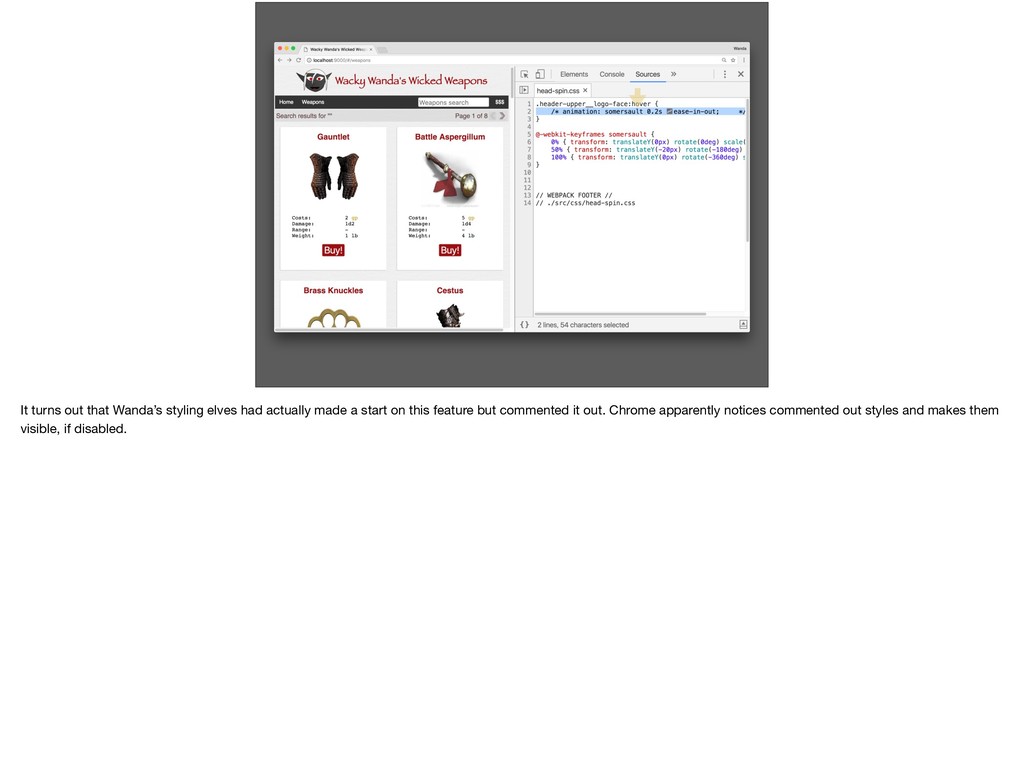
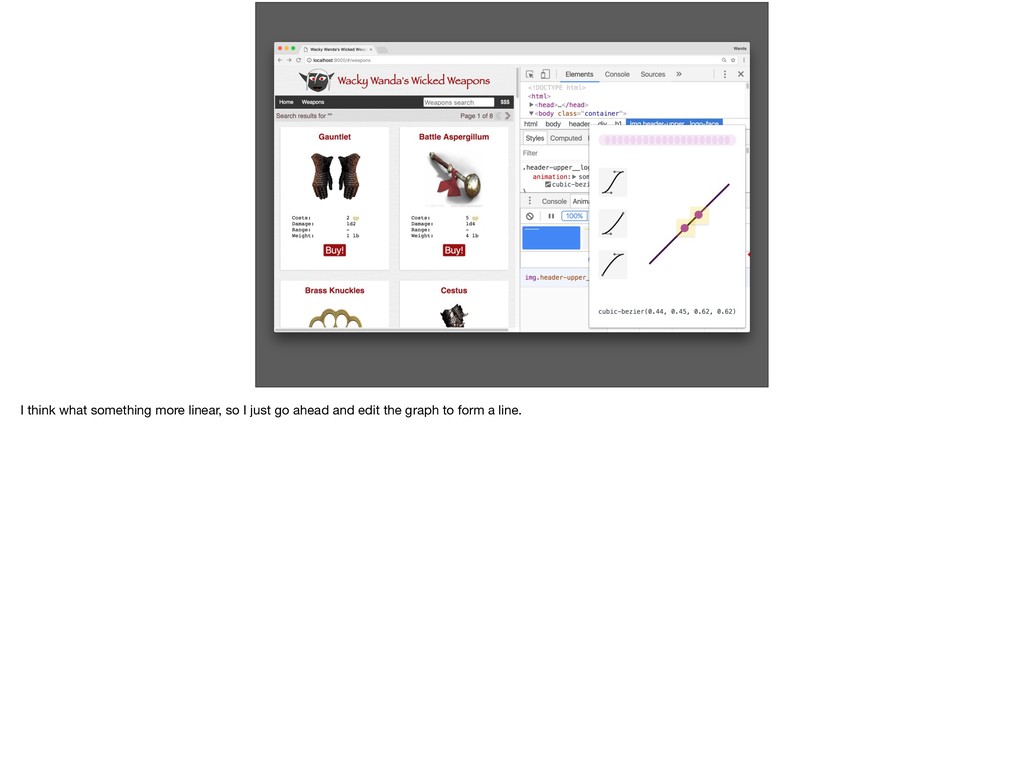
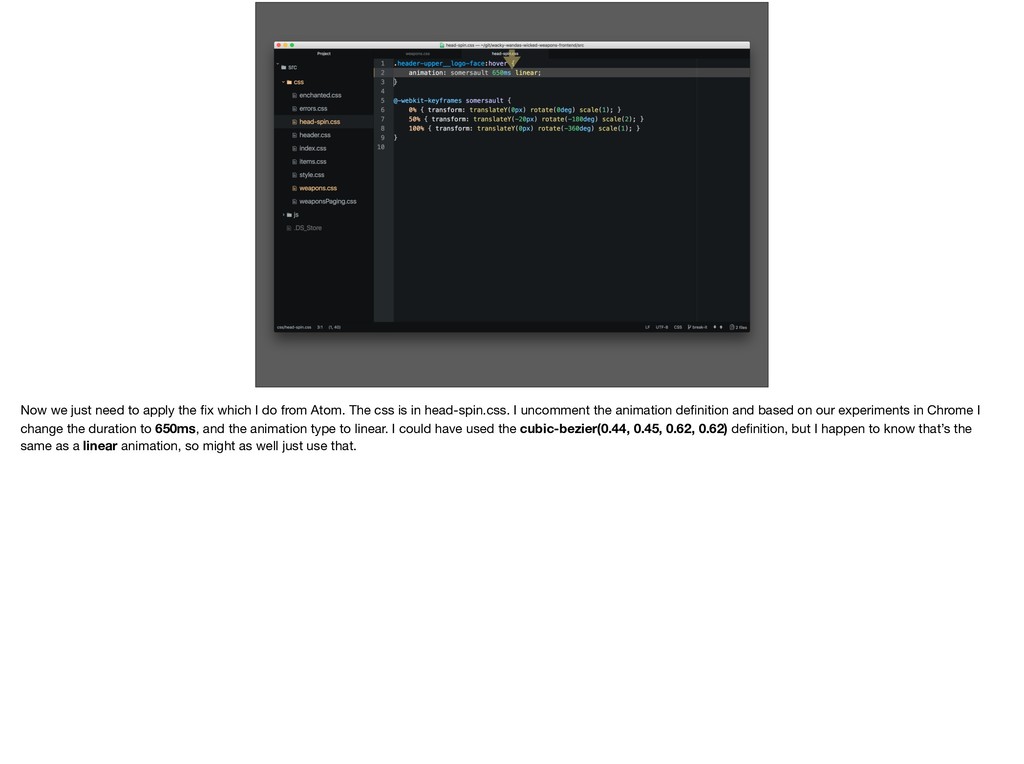
do from Atom. The css is in head-spin.css. I uncomment the animation definition and based on our experiments in Chrome I change the duration to 650ms, and the animation type to linear. I could have used the cubic-bezier(0.44, 0.45, 0.62, 0.62) definition, but I happen to know that’s the same as a linear animation, so might as well just use that.
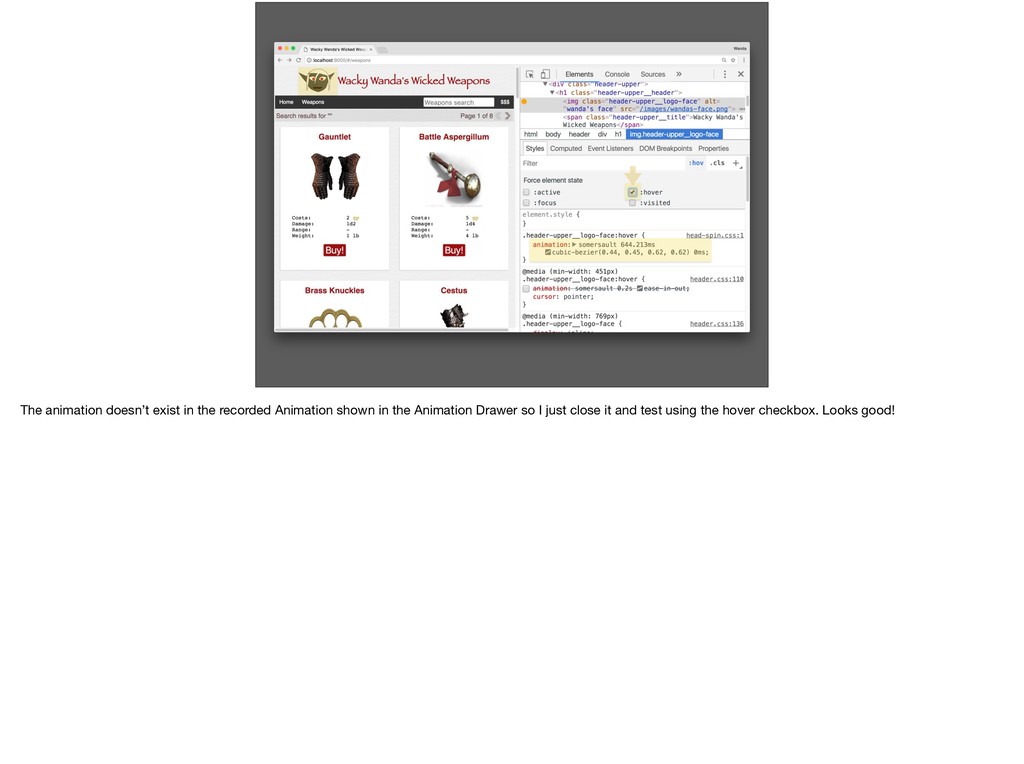
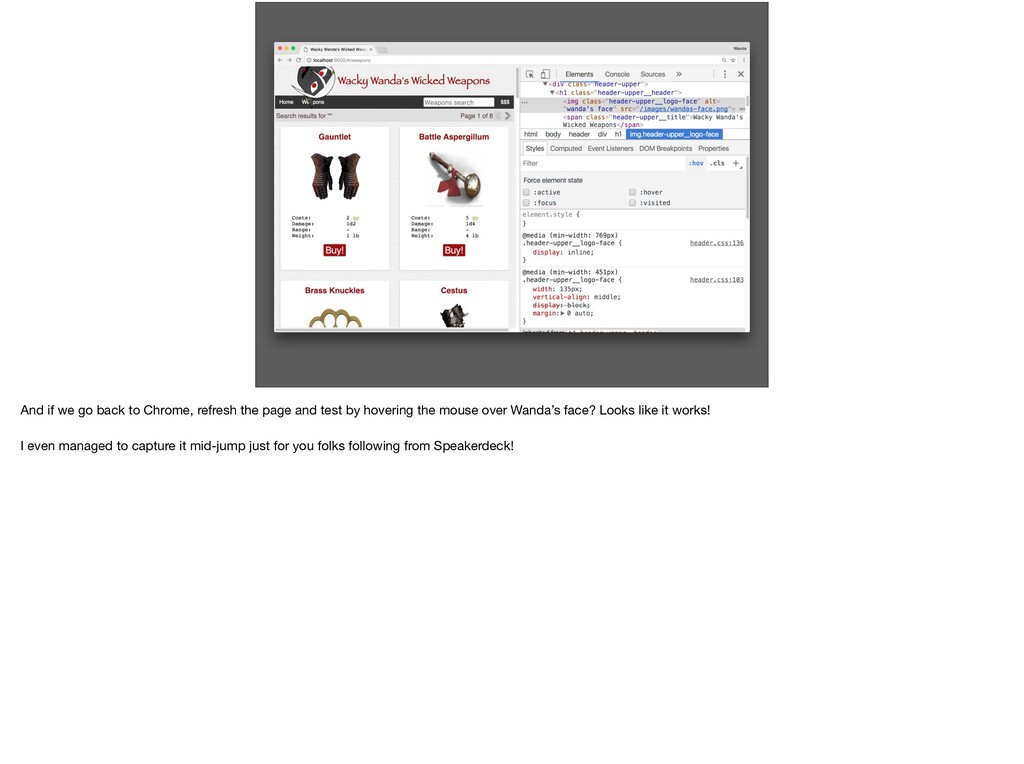
and test by hovering the mouse over Wanda’s face? Looks like it works! I even managed to capture it mid-jump just for you folks following from Speakerdeck!
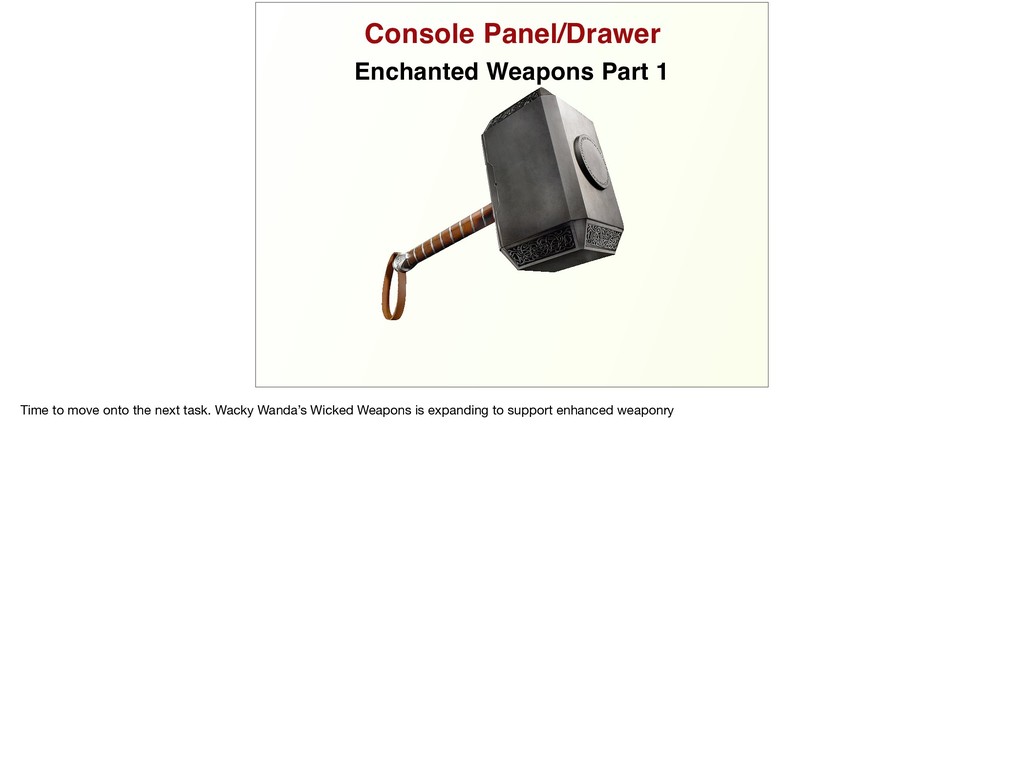
adding a checkbox. Clicking the checkbox will cause the attributes to change and magical glow to appear. Work has actually already begun on this but tragically my predecessor was tragically eaten by a balrog from the accounts department. It’s my tasks find out far Jasper got with implementing the Model before his untimely workplace accident. For this first phase we’ll be working from Console Panel and sometimes the Console Drawer to enchant Mjolnir as proof of concept.
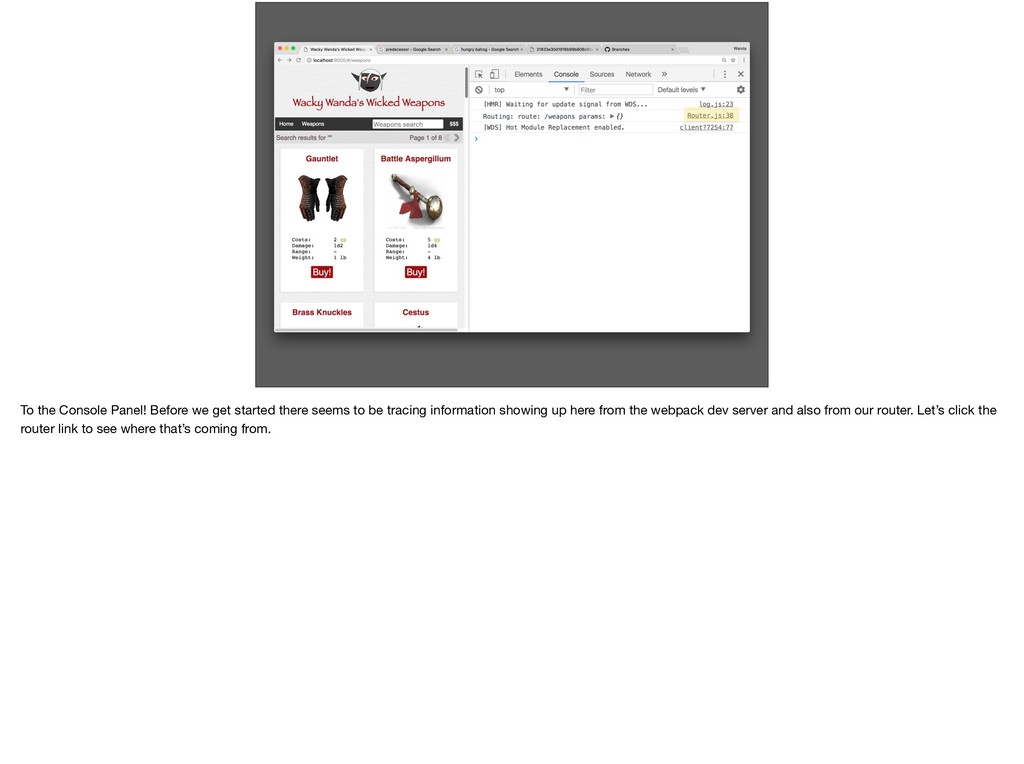
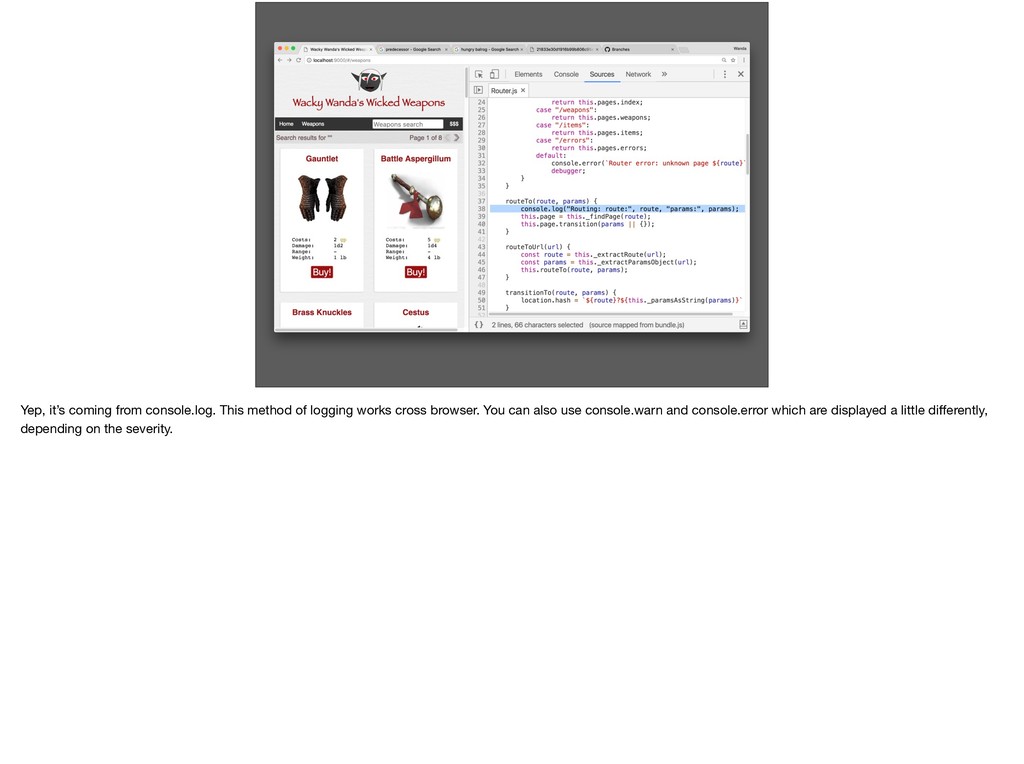
to be tracing information showing up here from the webpack dev server and also from our router. Let’s click the router link to see where that’s coming from.
to be tracing information showing up here from the webpack dev server and also from our router. Let’s click the router link to see where that’s coming from.
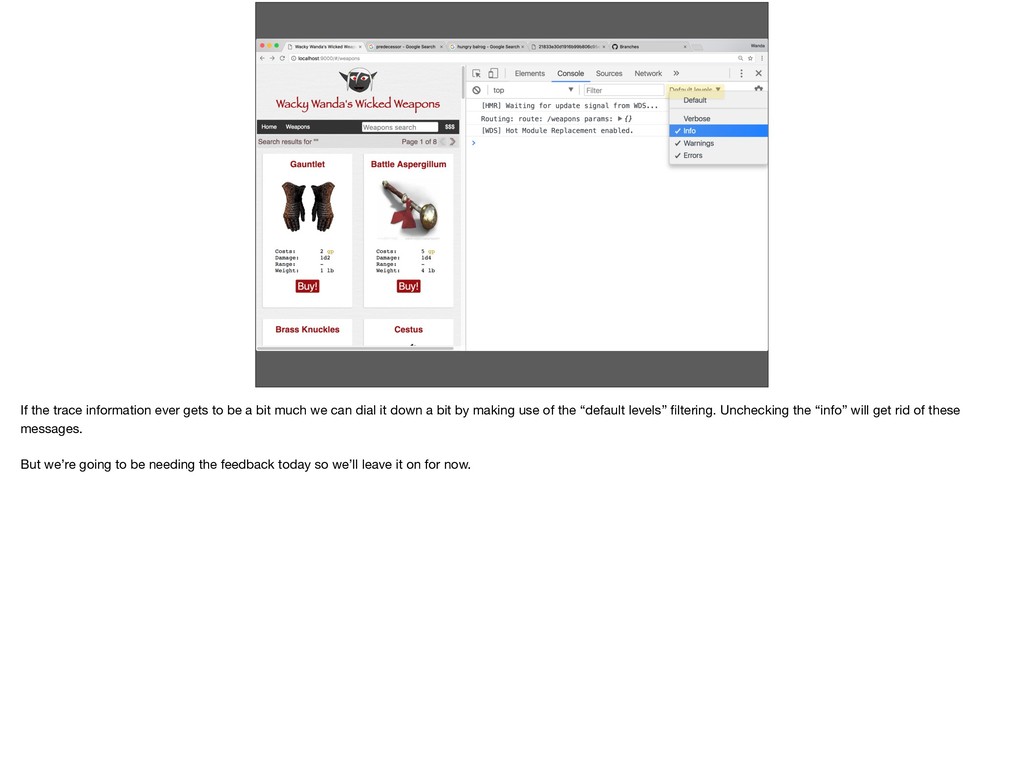
much we can dial it down a bit by making use of the “default levels” filtering. Unchecking the “info” will get rid of these messages. But we’re going to be needing the feedback today so we’ll leave it on for now.
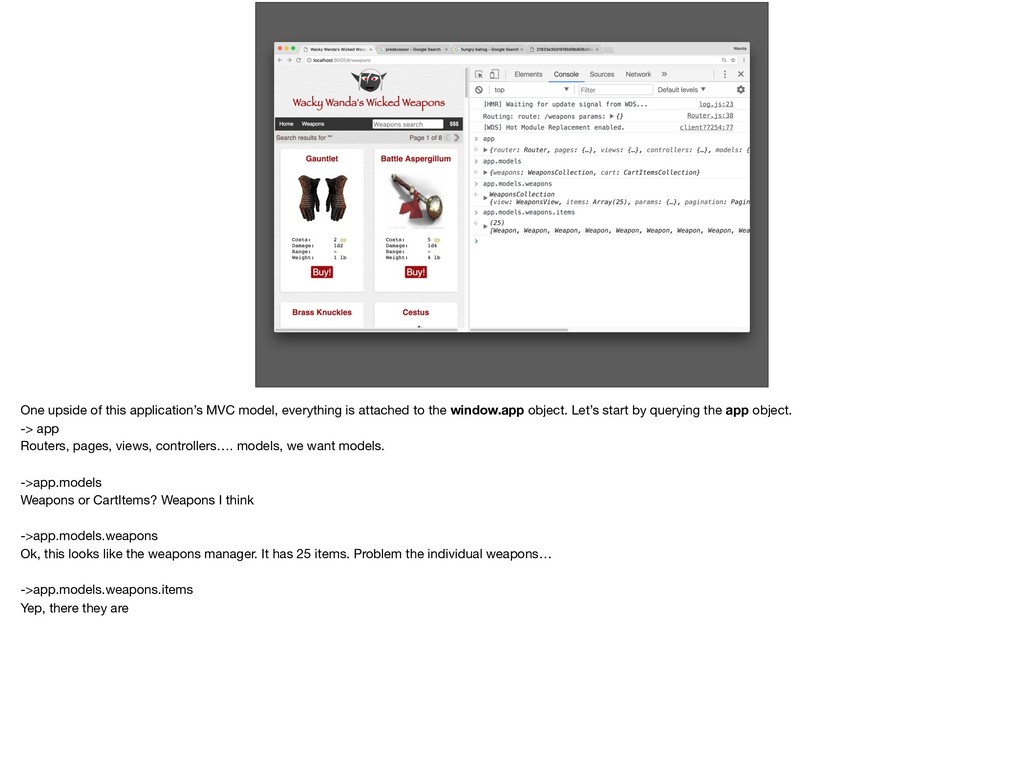
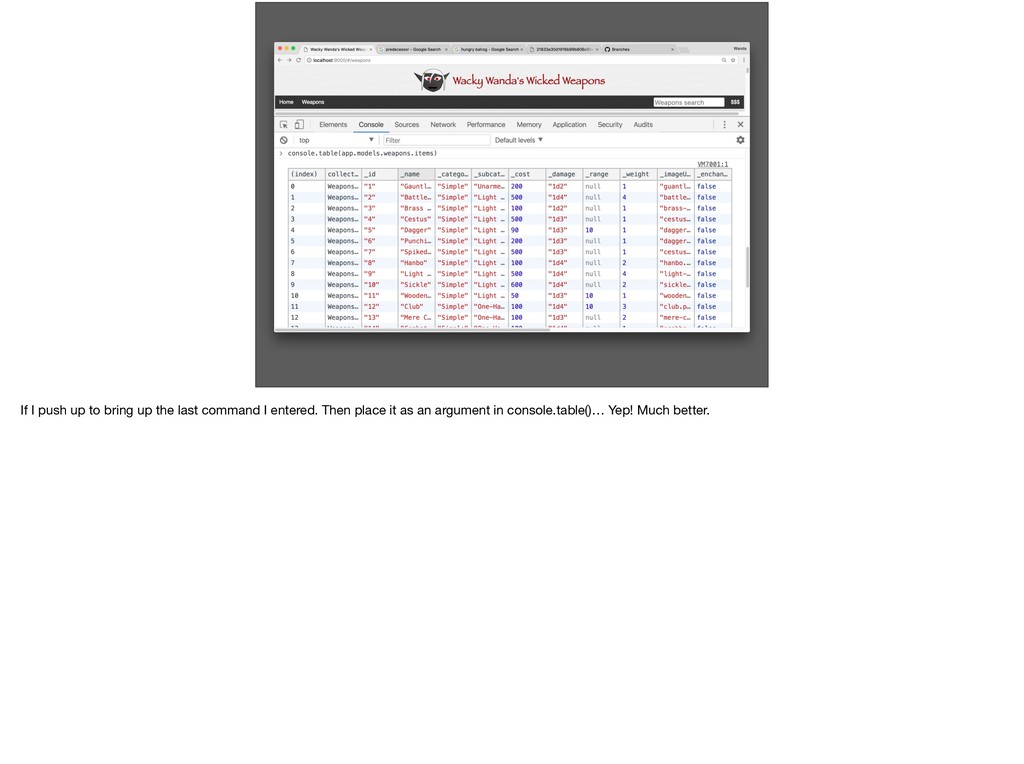
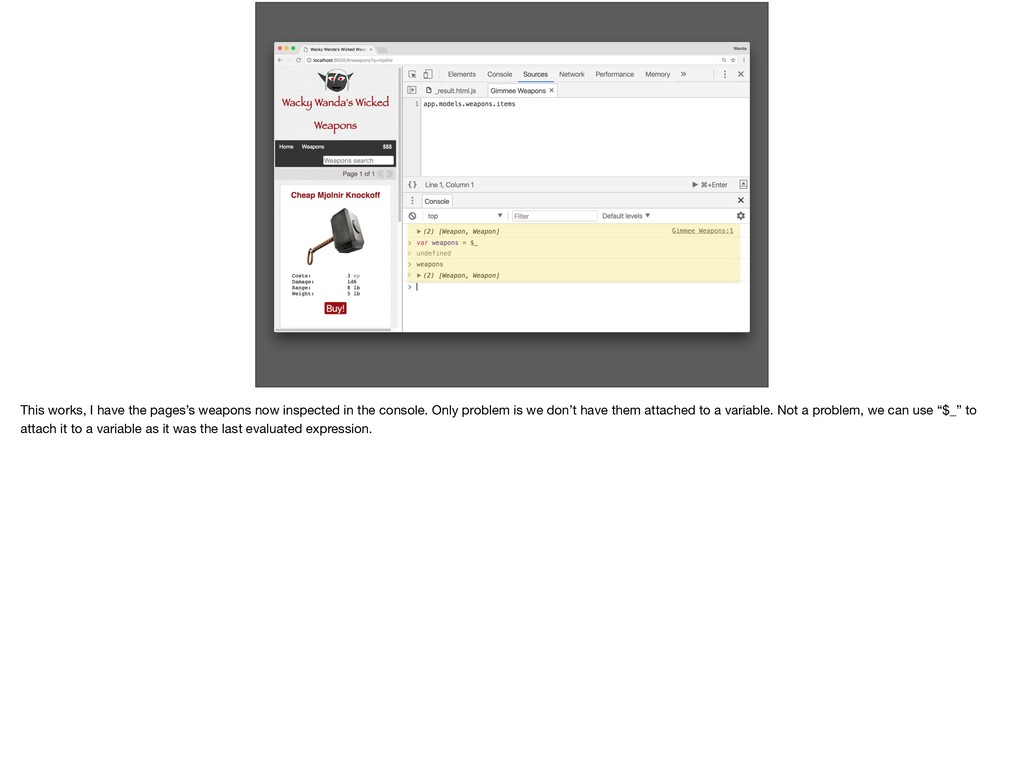
to the window.app object. Let’s start by querying the app object. -> app Routers, pages, views, controllers…. models, we want models. ->app.models Weapons or CartItems? Weapons I think ->app.models.weapons Ok, this looks like the weapons manager. It has 25 items. Problem the individual weapons… ->app.models.weapons.items Yep, there they are
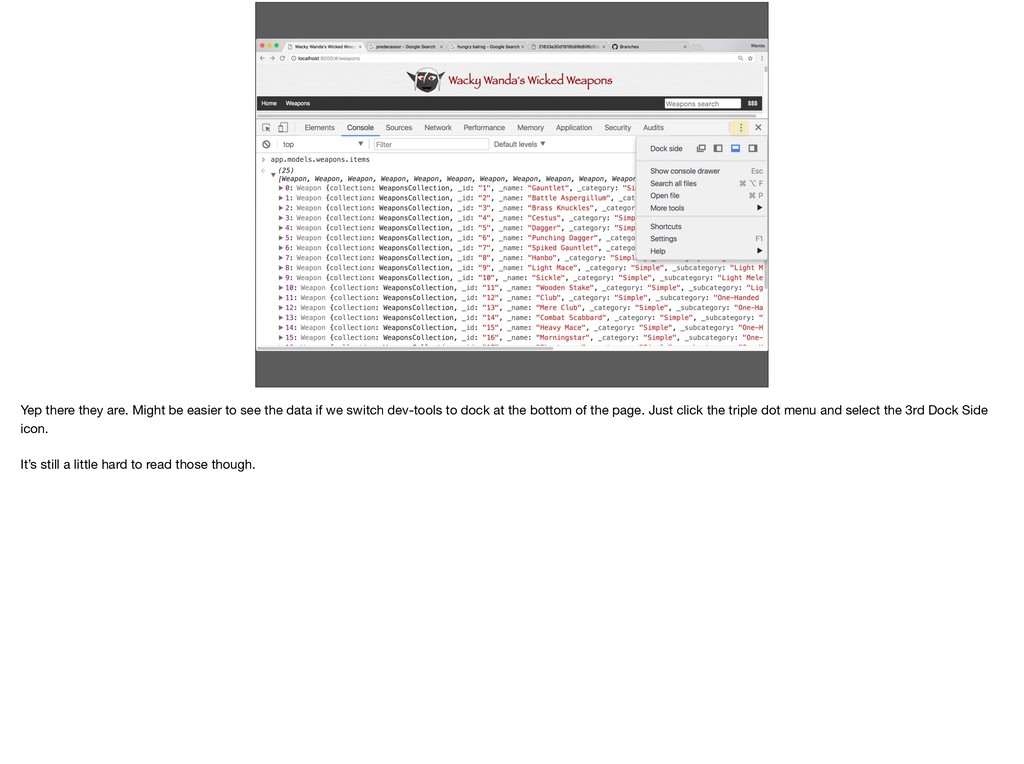
data if we switch dev-tools to dock at the bottom of the page. Just click the triple dot menu and select the 3rd Dock Side icon. It’s still a little hard to read those though.
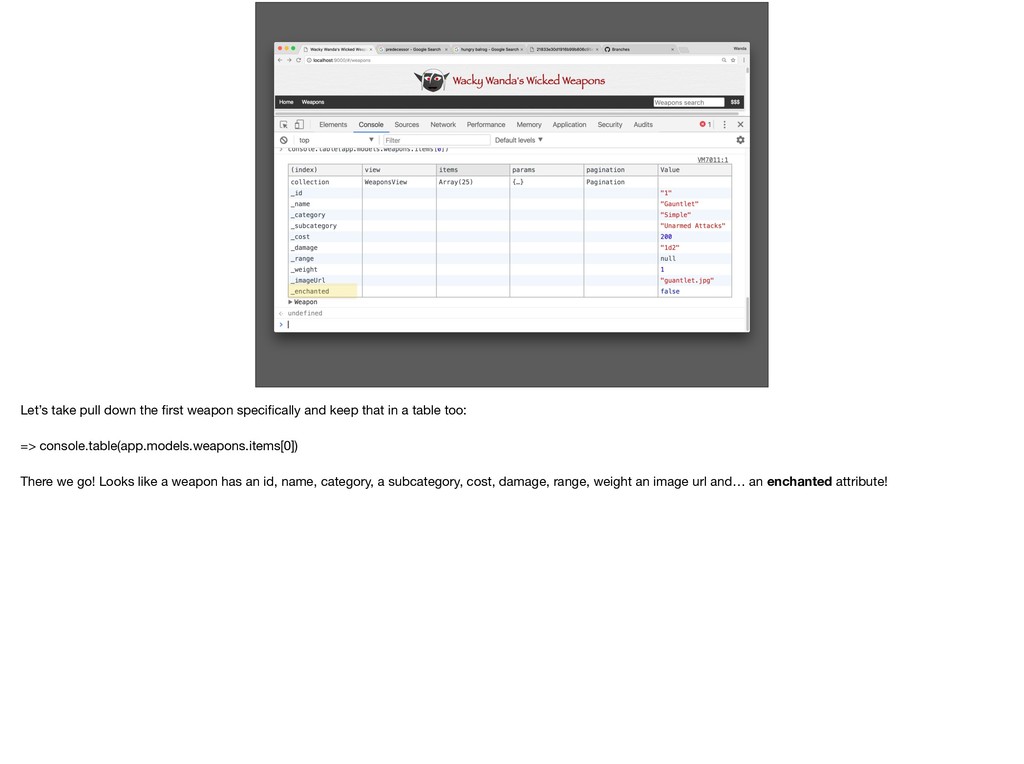
that in a table too: => console.table(app.models.weapons.items[0]) There we go! Looks like a weapon has an id, name, category, a subcategory, cost, damage, range, weight an image url and… an enchanted attribute!
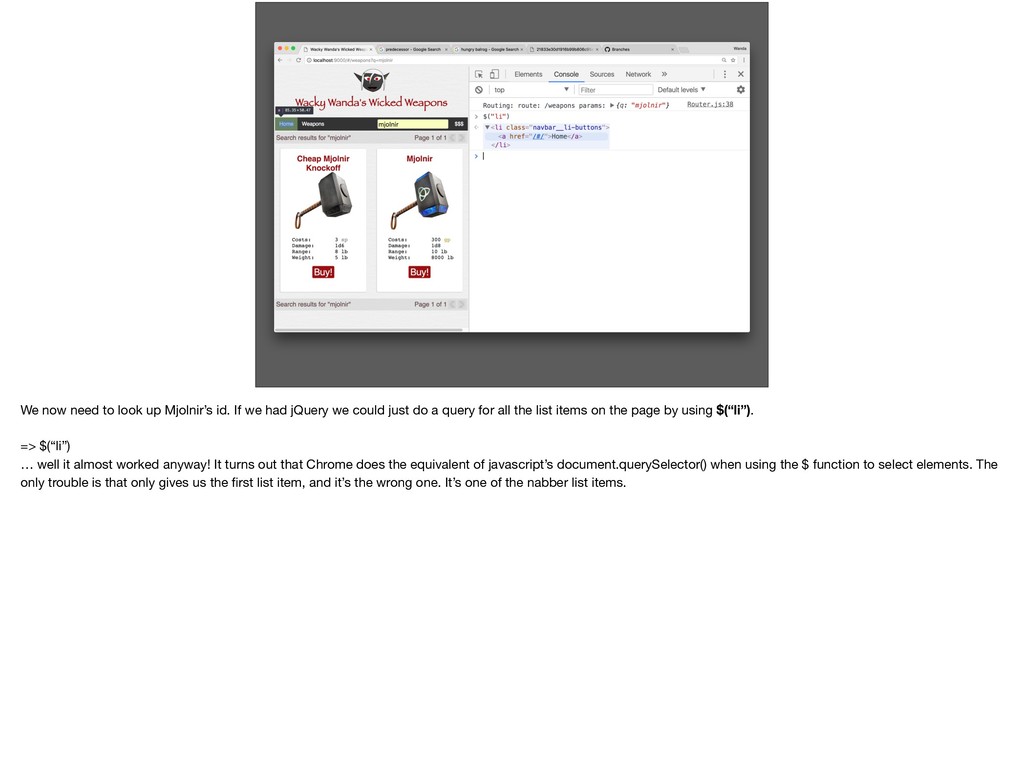
had jQuery we could just do a query for all the list items on the page by using $(“li”). => $(“li”) … well it almost worked anyway! It turns out that Chrome does the equivalent of javascript’s document.querySelector() when using the $ function to select elements. The only trouble is that only gives us the first list item, and it’s the wrong one. It’s one of the nabber list items.
a full array of list items back. If I open the array and hover the mouse over each item in turn it will highlight each element in turn on the page. Looks like Mjolnir is the final list item.
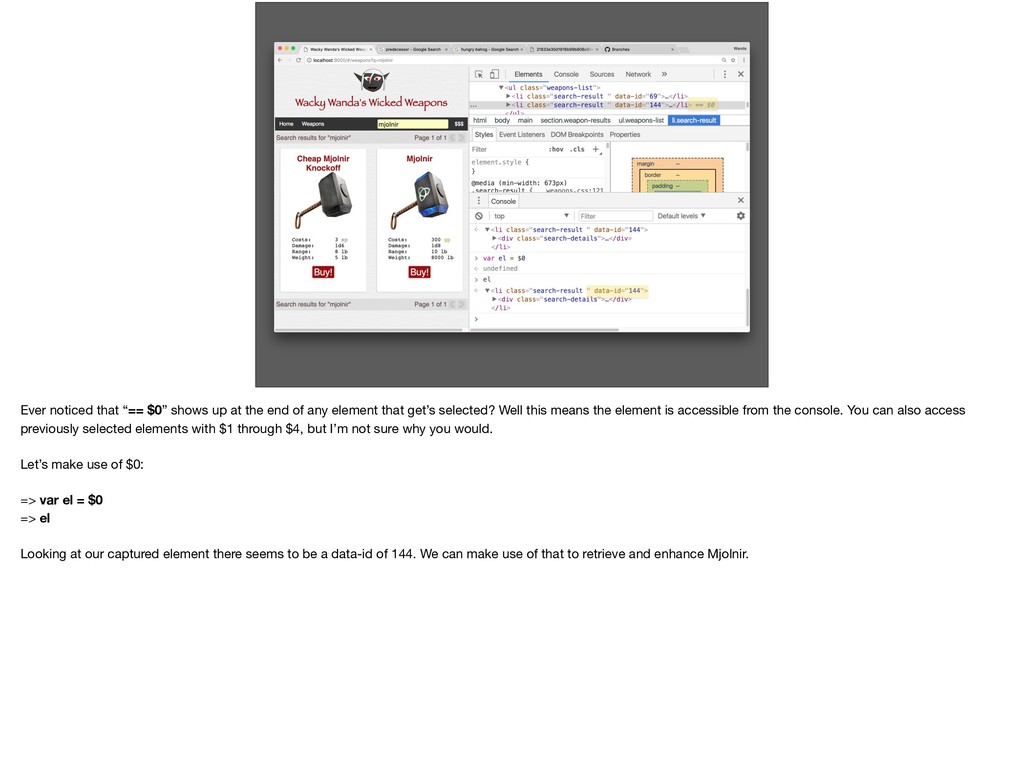
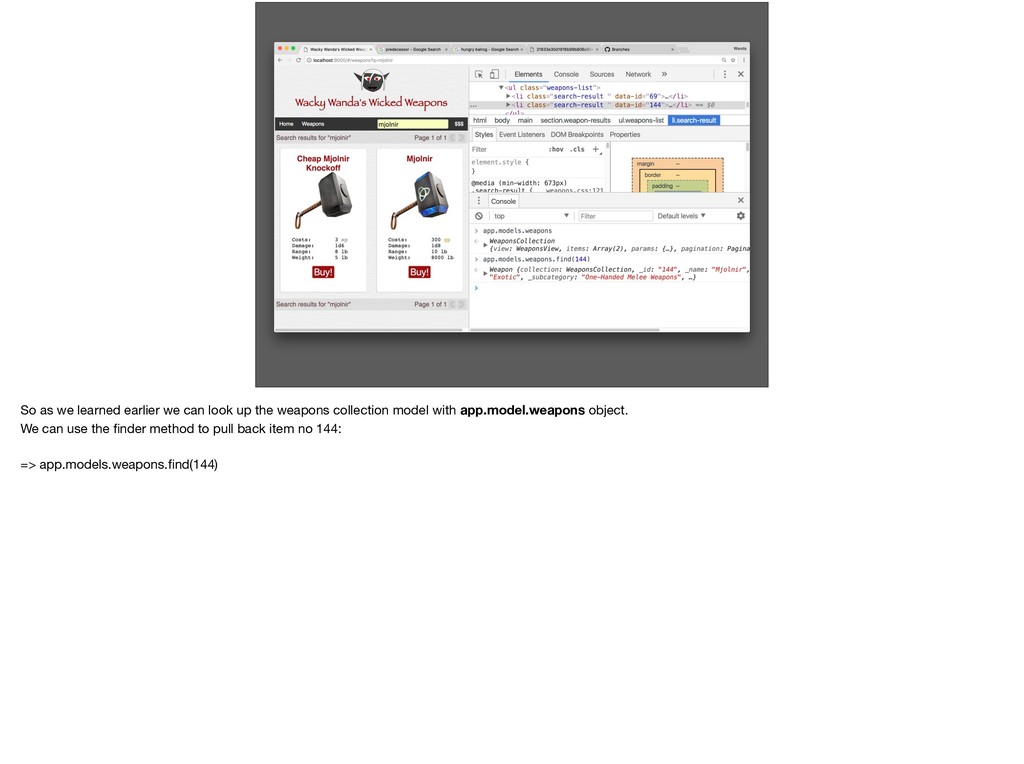
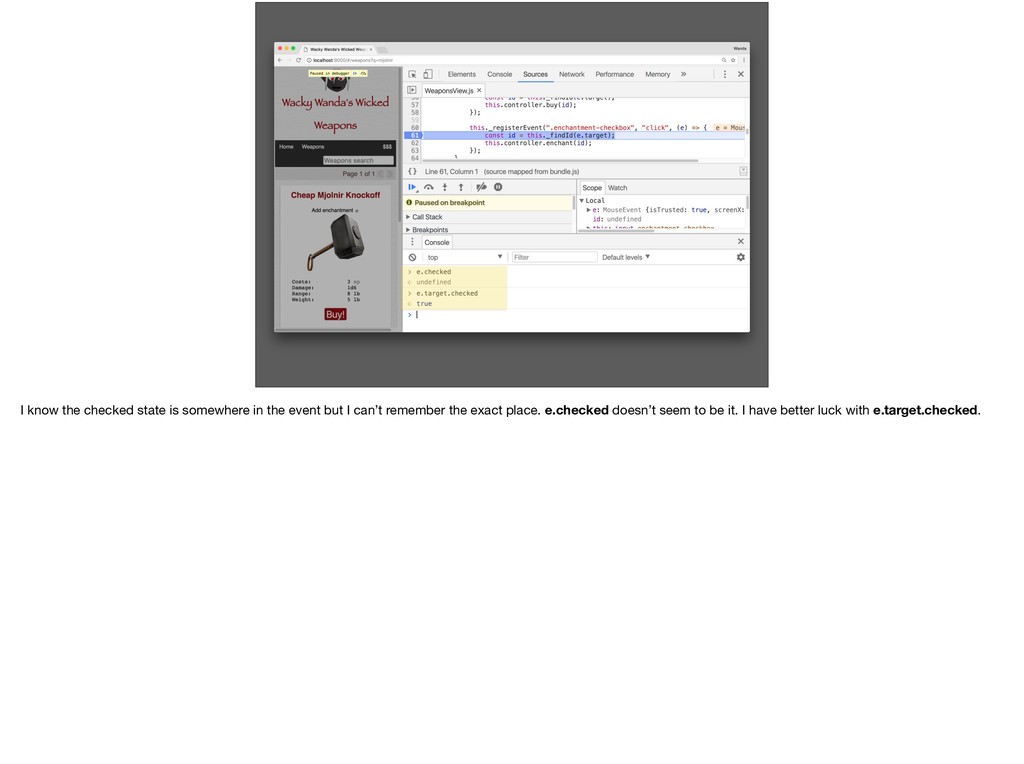
of any element that get’s selected? Well this means the element is accessible from the console. You can also access previously selected elements with $1 through $4, but I’m not sure why you would. Let’s make use of $0: => var el = $0 => el Looking at our captured element there seems to be a data-id of 144. We can make use of that to retrieve and enhance Mjolnir.
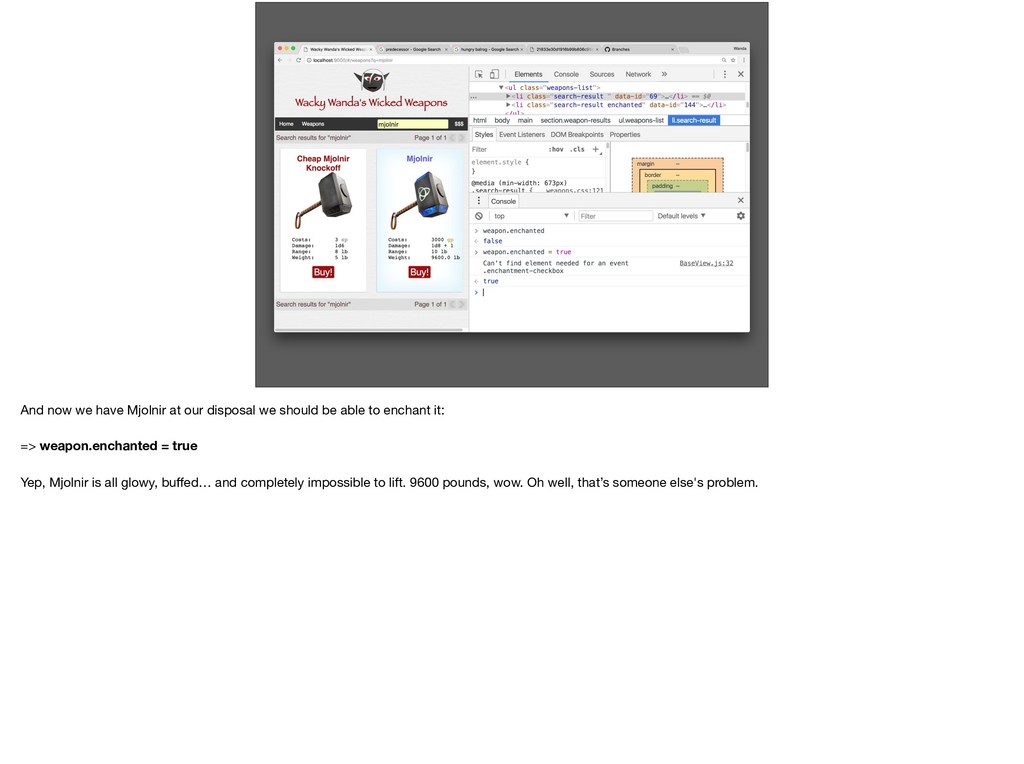
be able to enchant it: => weapon.enchanted = true Yep, Mjolnir is all glowy, buffed… and completely impossible to lift. 9600 pounds, wow. Oh well, that’s someone else's problem.
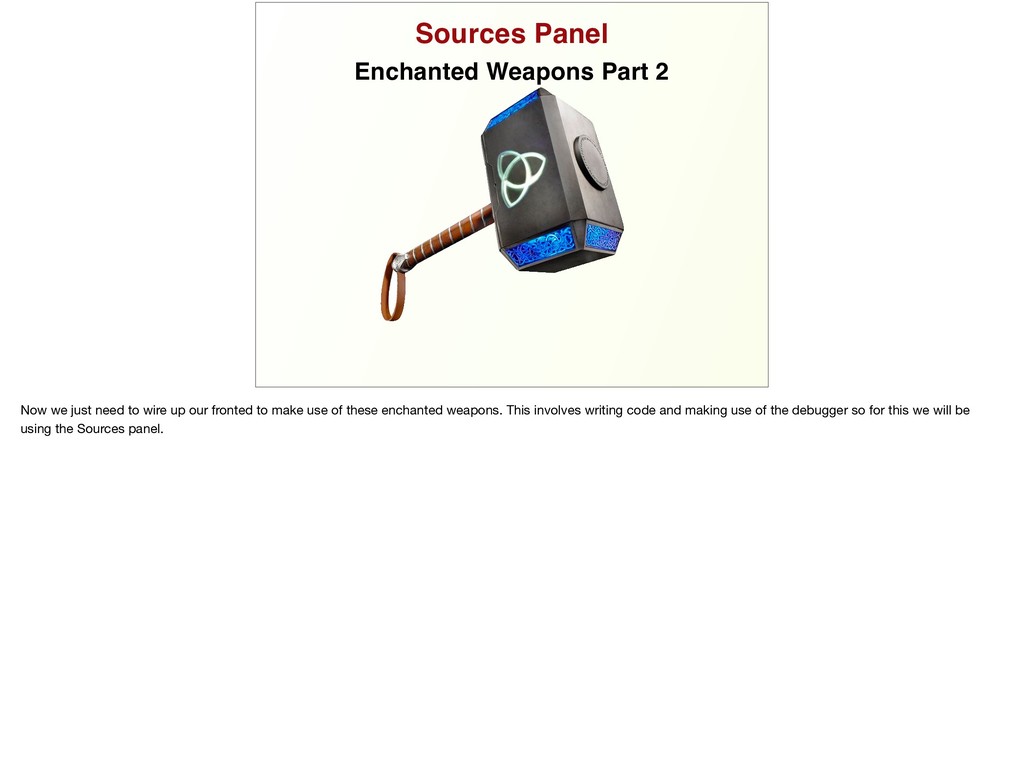
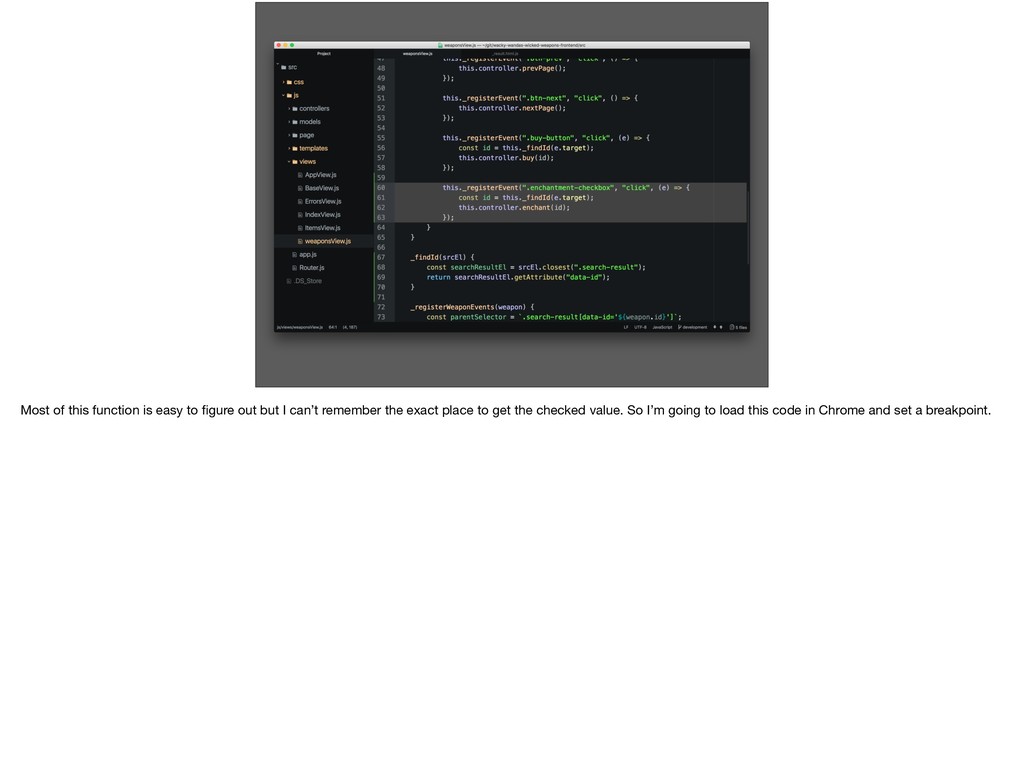
to wire up our fronted to make use of these enchanted weapons. This involves writing code and making use of the debugger so for this we will be using the Sources panel.
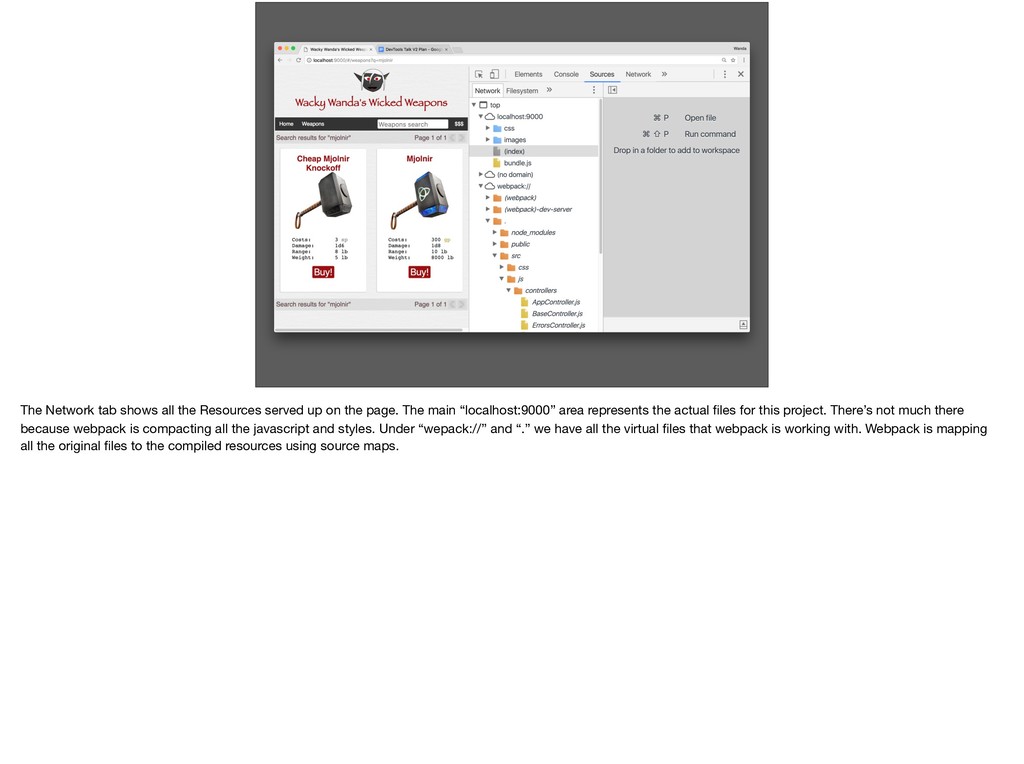
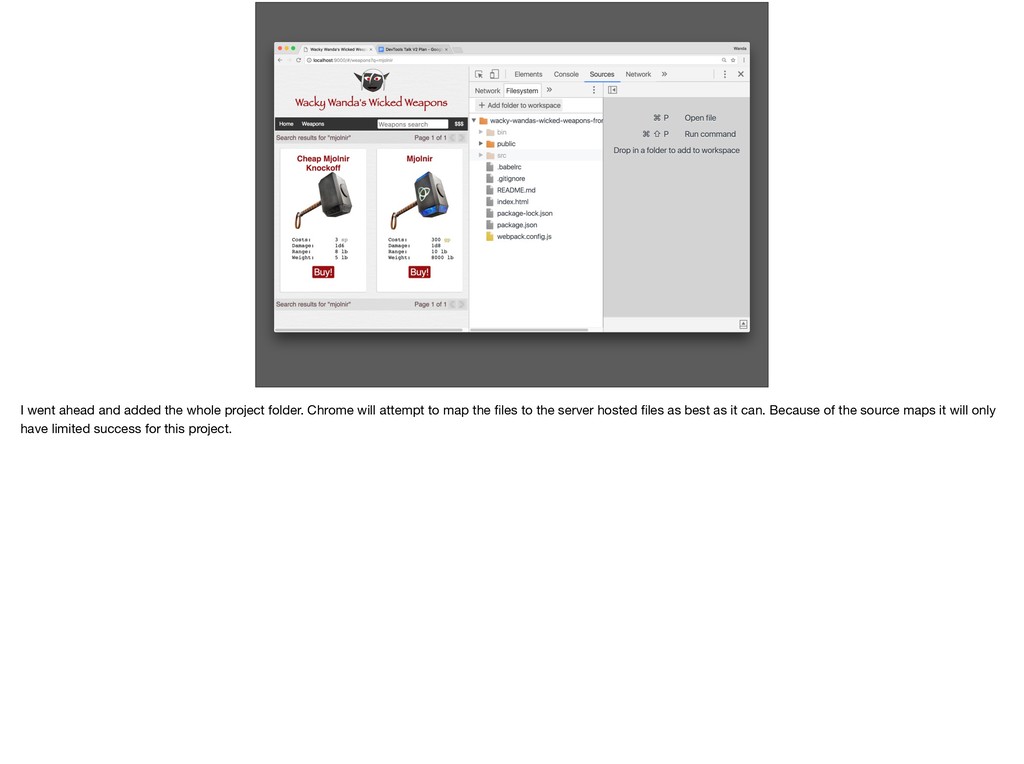
the page. The main “localhost:9000” area represents the actual files for this project. There’s not much there because webpack is compacting all the javascript and styles. Under “wepack://” and “.” we have all the virtual files that webpack is working with. Webpack is mapping all the original files to the compiled resources using source maps.
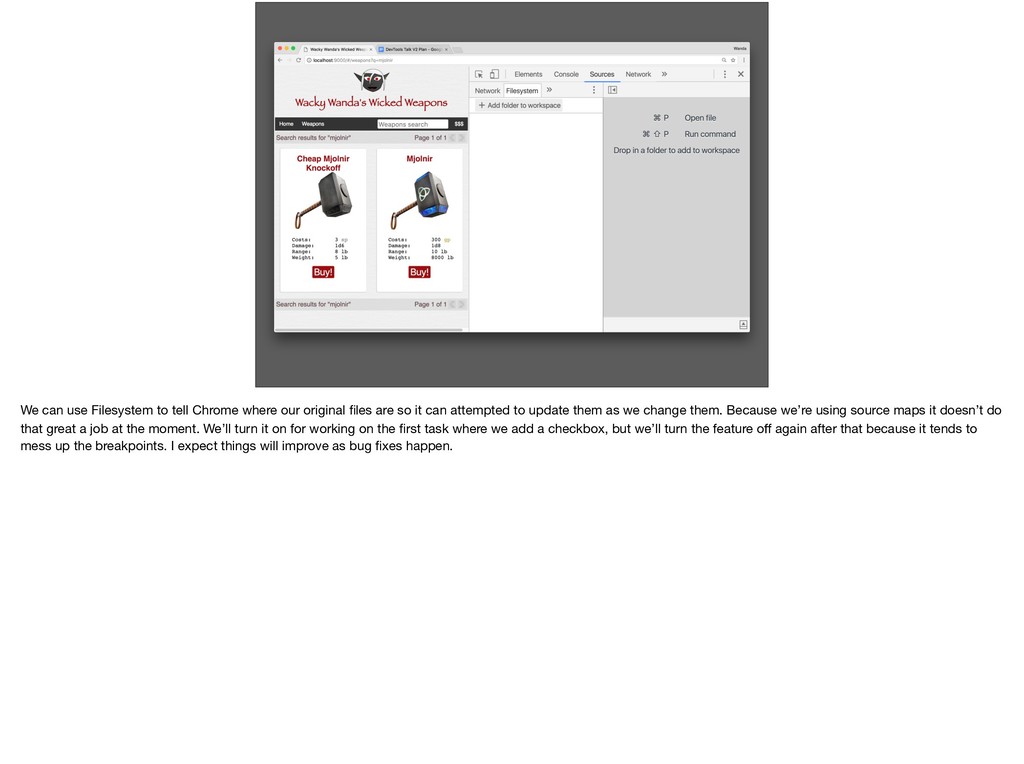
files are so it can attempted to update them as we change them. Because we’re using source maps it doesn’t do that great a job at the moment. We’ll turn it on for working on the first task where we add a checkbox, but we’ll turn the feature off again after that because it tends to mess up the breakpoints. I expect things will improve as bug fixes happen.
will attempt to map the files to the server hosted files as best as it can. Because of the source maps it will only have limited success for this project.
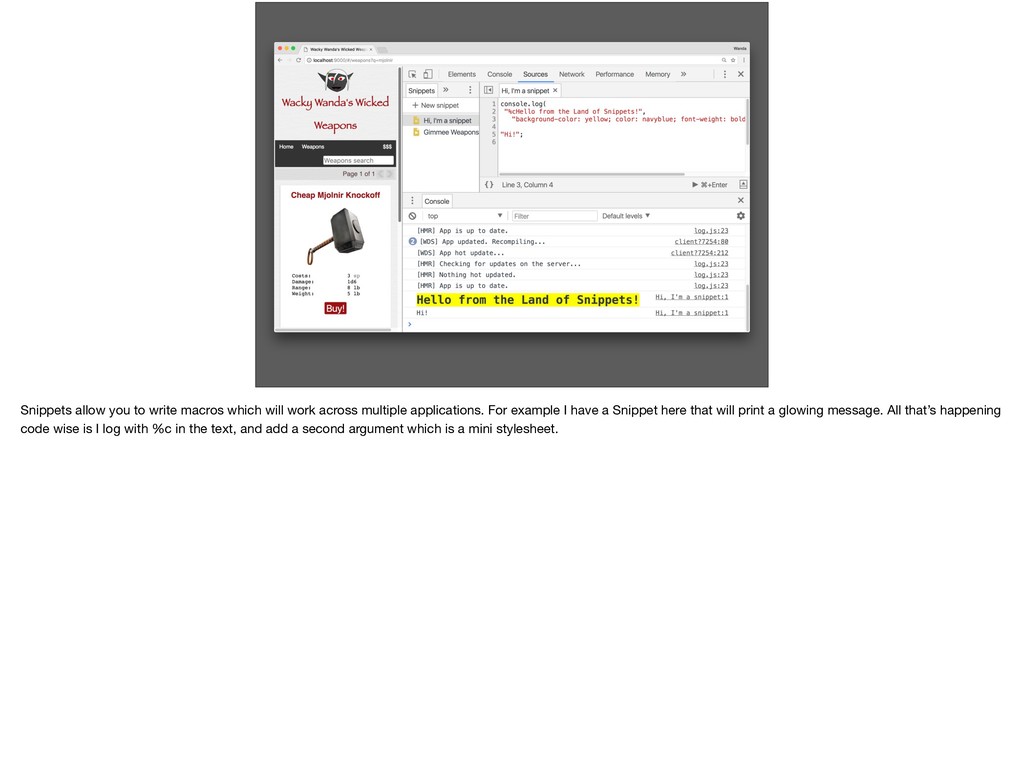
multiple applications. For example I have a Snippet here that will print a glowing message. All that’s happening code wise is I log with %c in the text, and add a second argument which is a mini stylesheet.
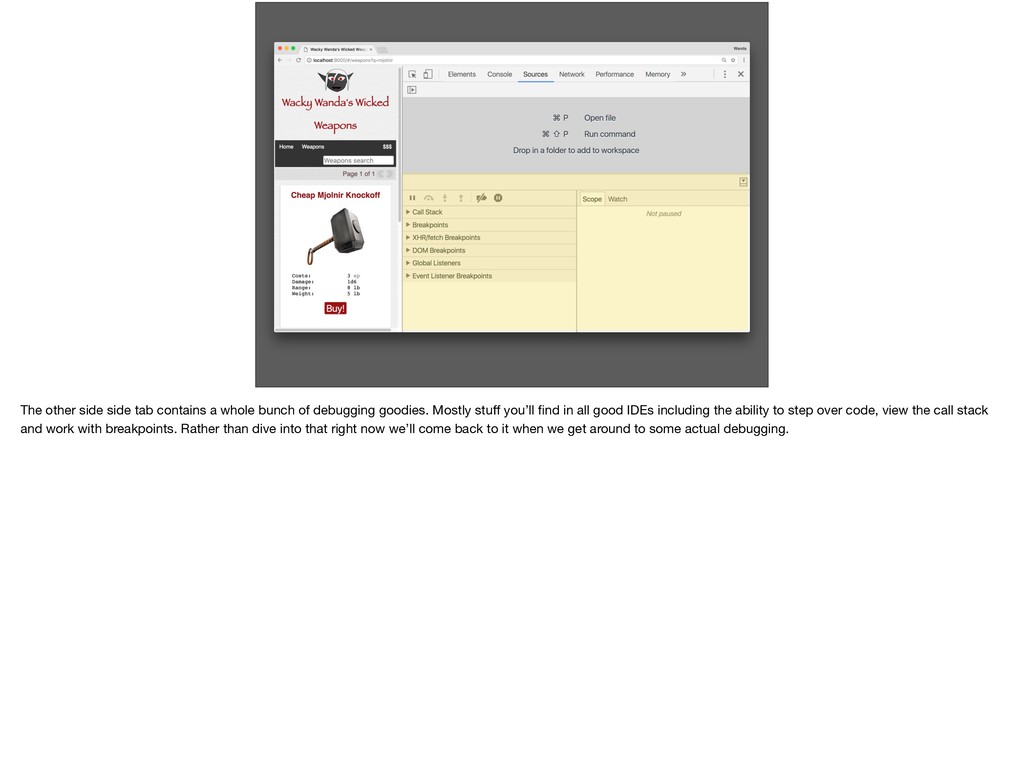
debugging goodies. Mostly stuff you’ll find in all good IDEs including the ability to step over code, view the call stack and work with breakpoints. Rather than dive into that right now we’ll come back to it when we get around to some actual debugging.
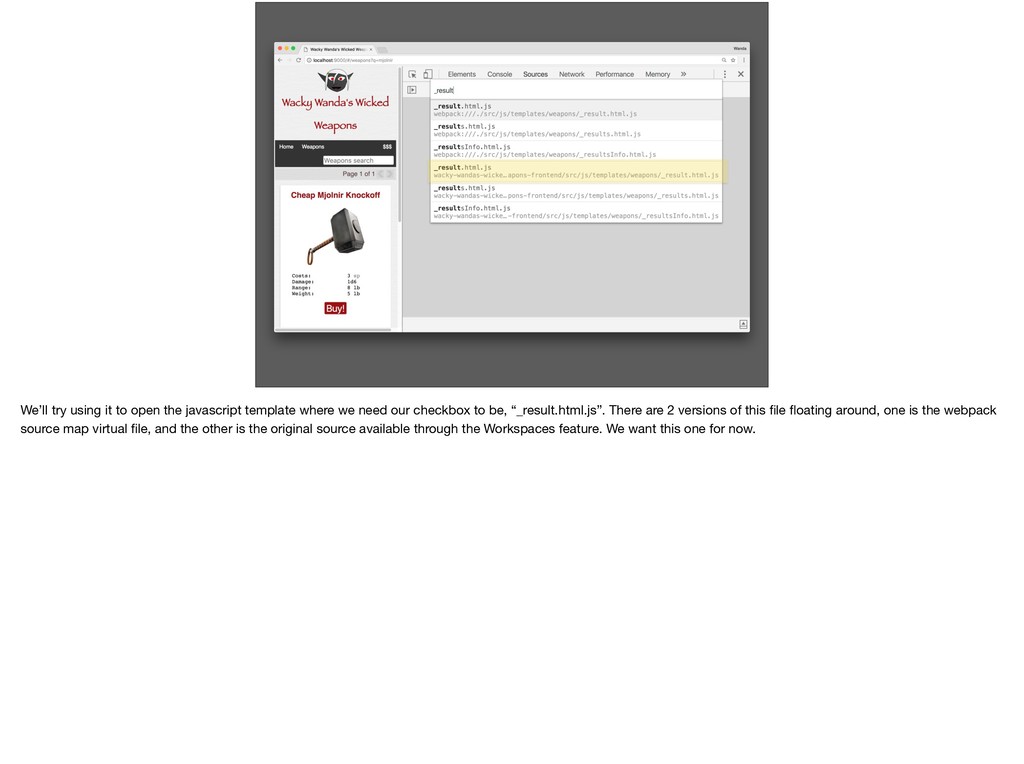
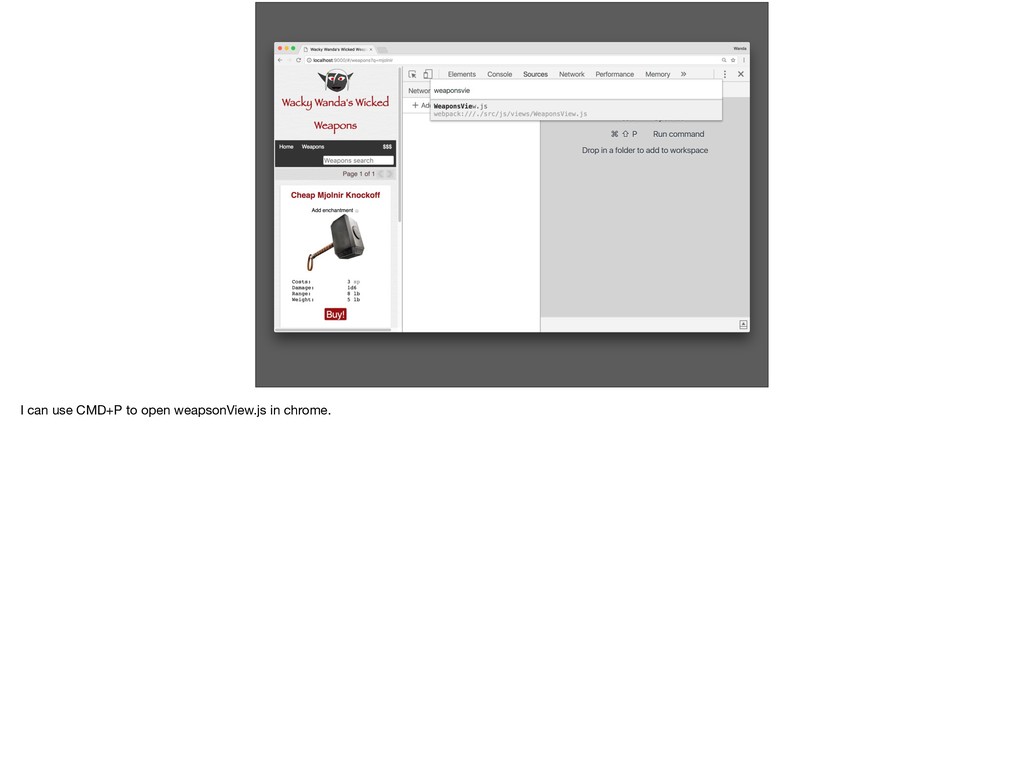
we need our checkbox to be, “_result.html.js”. There are 2 versions of this file floating around, one is the webpack source map virtual file, and the other is the original source available through the Workspaces feature. We want this one for now.
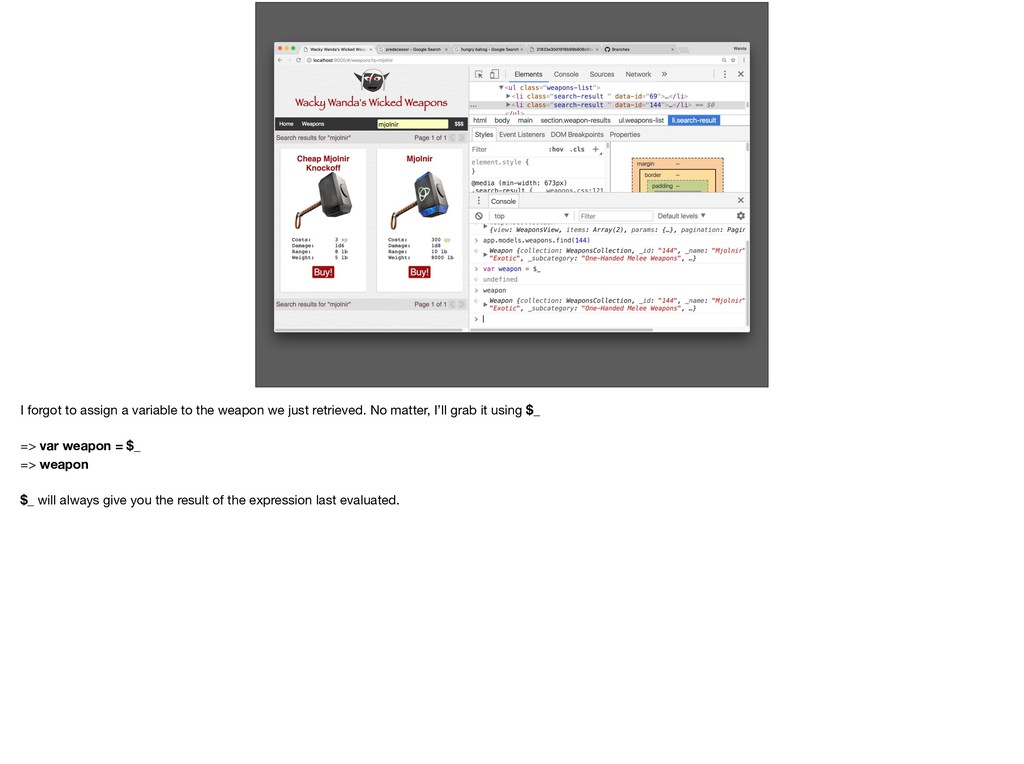
the console. Only problem is we don’t have them attached to a variable. Not a problem, we can use “$_” to attach it to a variable as it was the last evaluated expression.
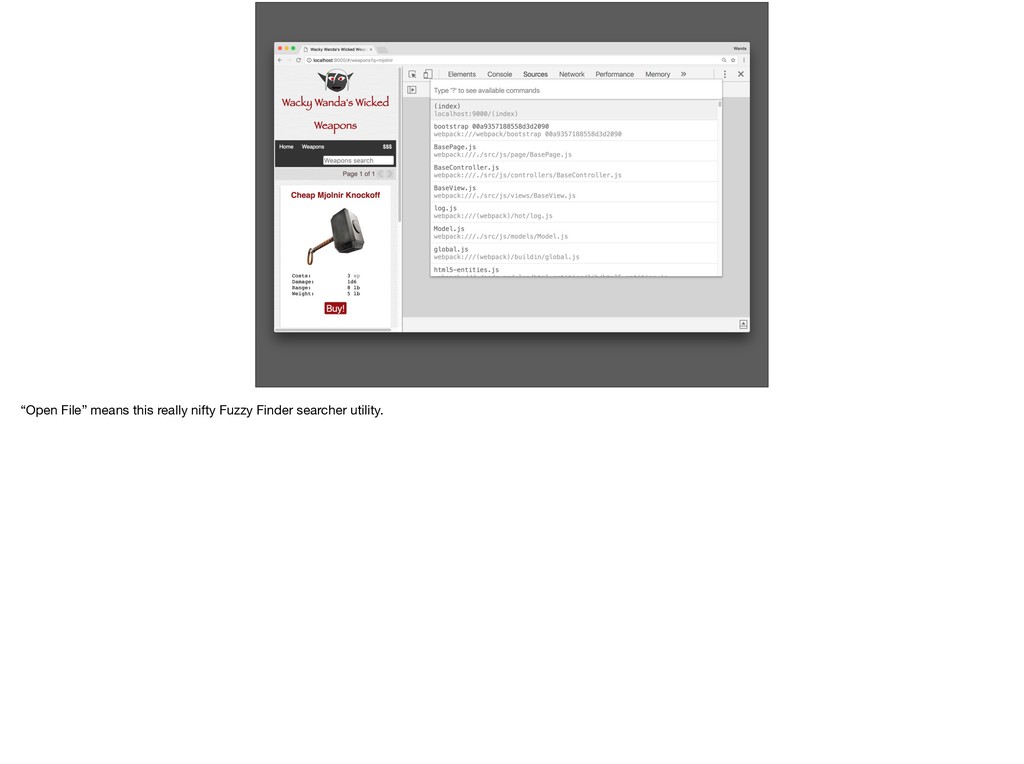
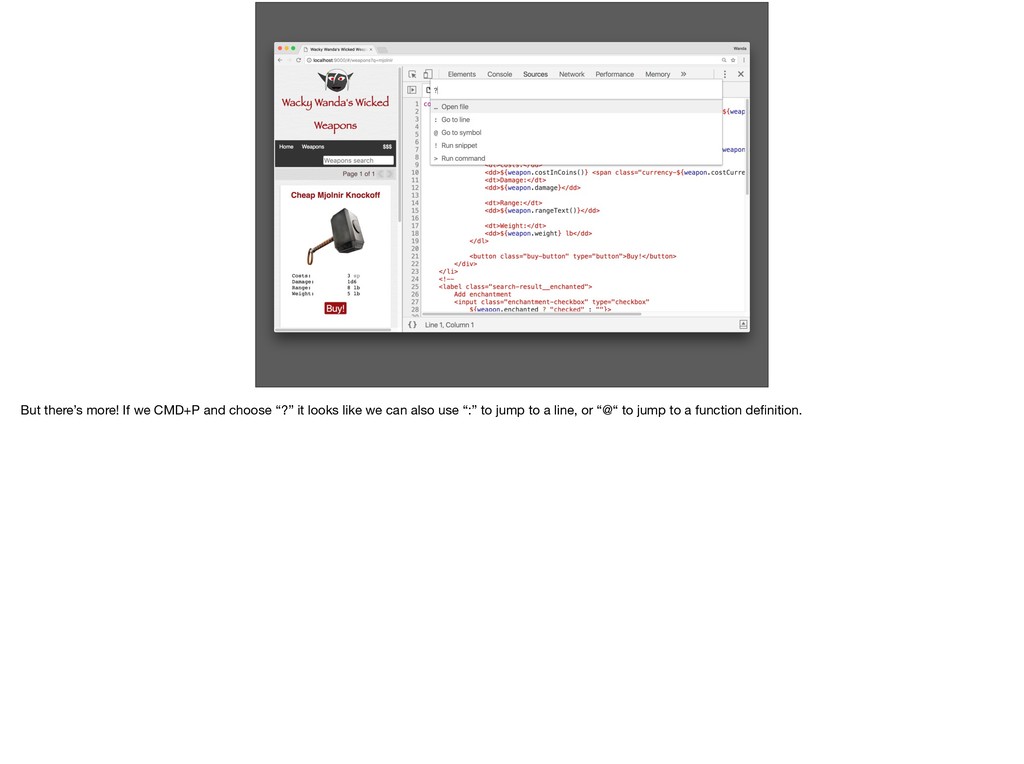
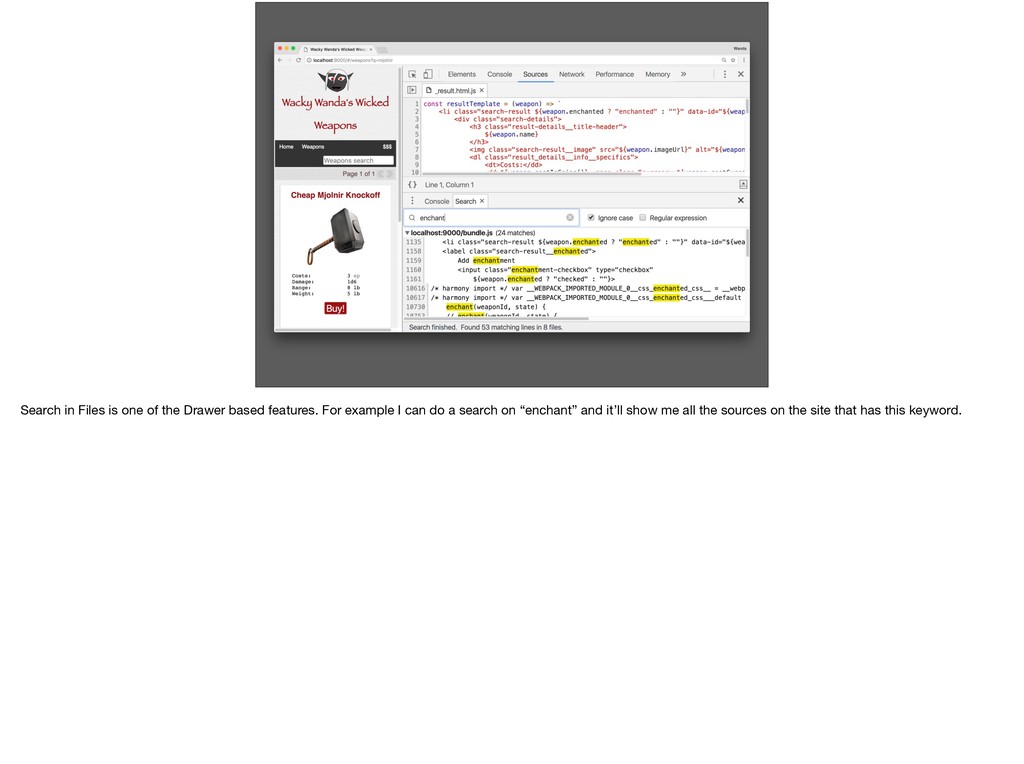
almost any console command. This can be really handy when you can’t remember how to reach a feature. For example I used to keep forgetting how to get to Search in Files. If I use this Run Command feature I just type Search and there it is!
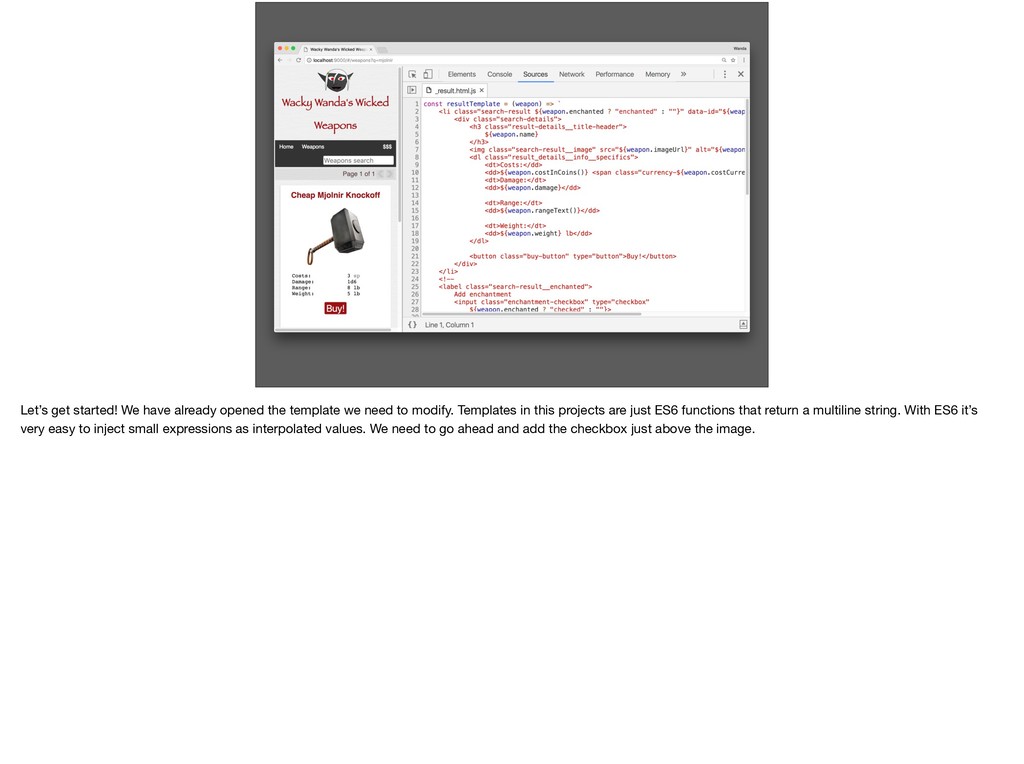
need to modify. Templates in this projects are just ES6 functions that return a multiline string. With ES6 it’s very easy to inject small expressions as interpolated values. We need to go ahead and add the checkbox just above the image.
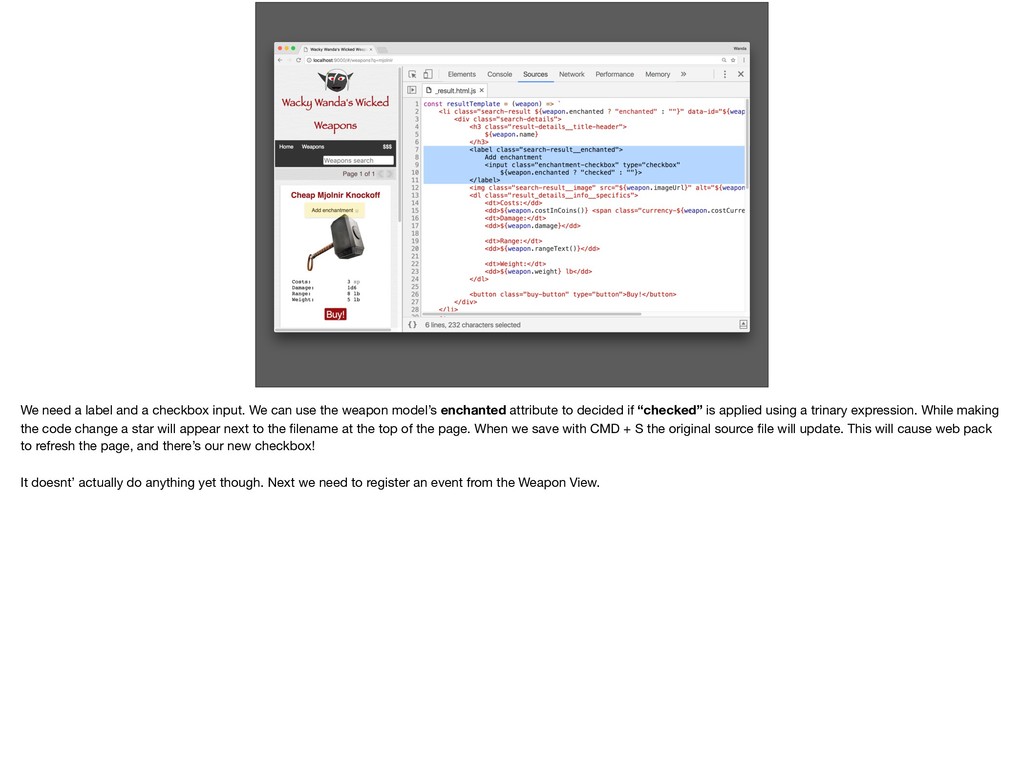
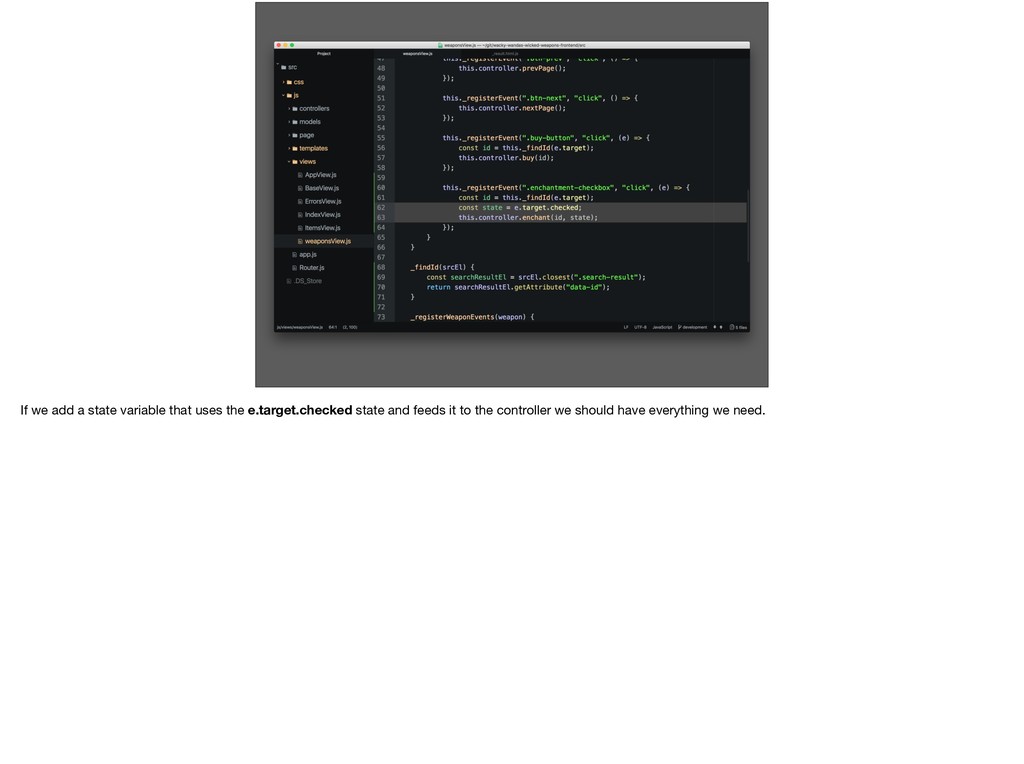
use the weapon model’s enchanted attribute to decided if “checked” is applied using a trinary expression. While making the code change a star will appear next to the filename at the top of the page. When we save with CMD + S the original source file will update. This will cause web pack to refresh the page, and there’s our new checkbox! It doesnt’ actually do anything yet though. Next we need to register an event from the Weapon View.
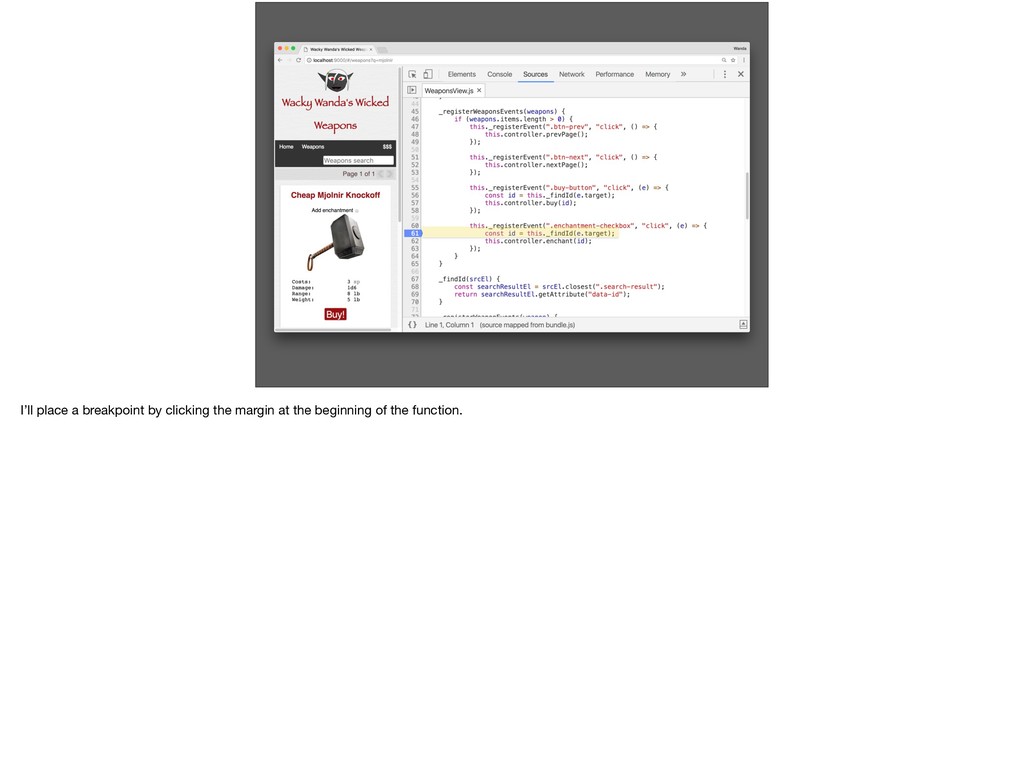
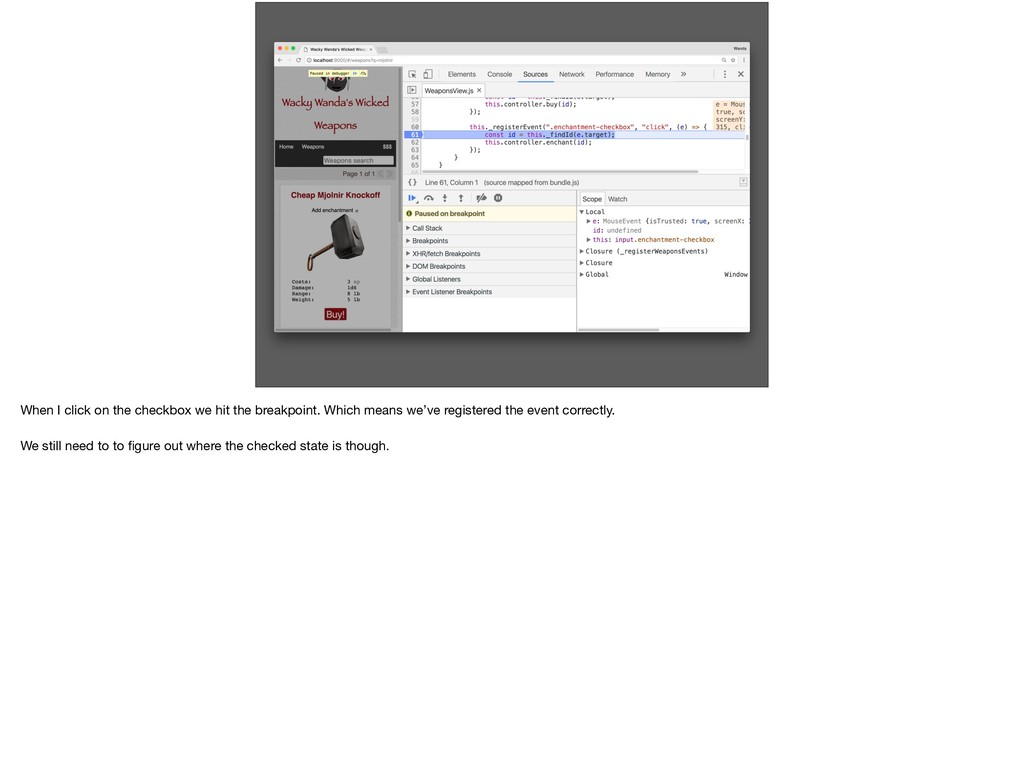
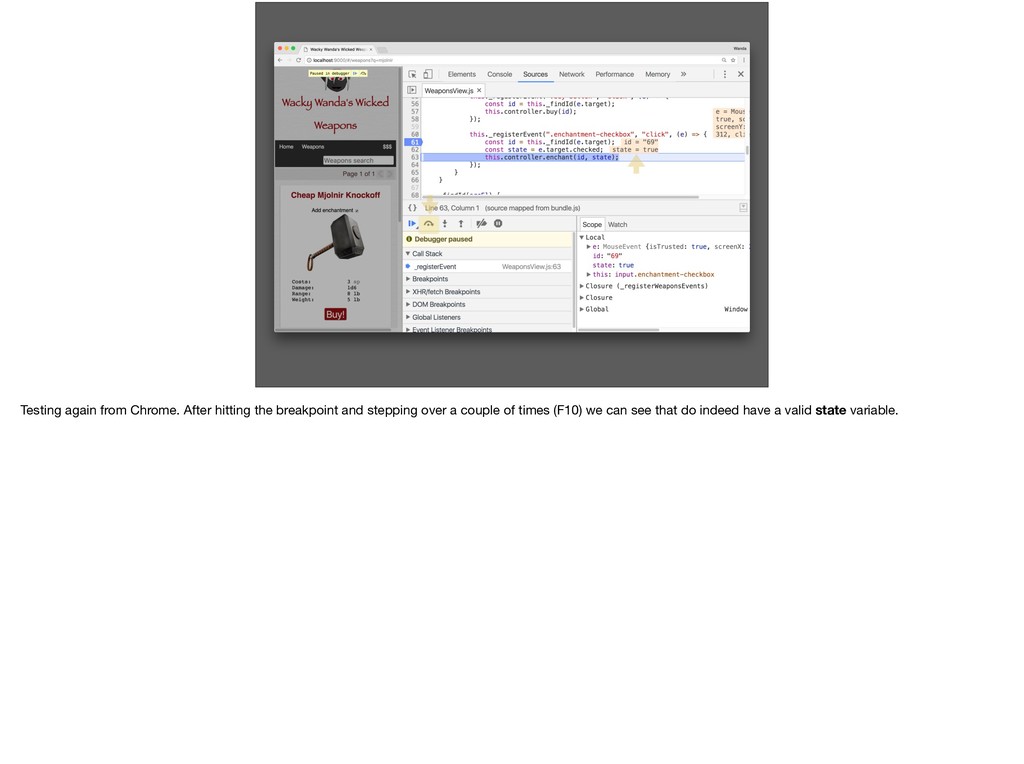
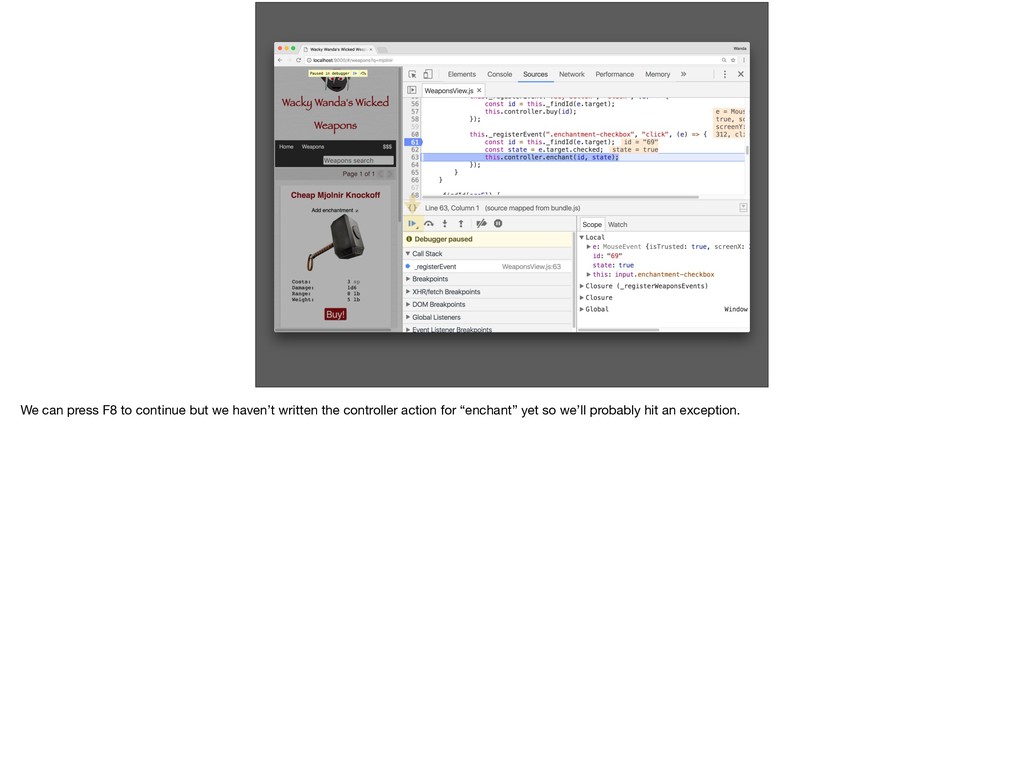
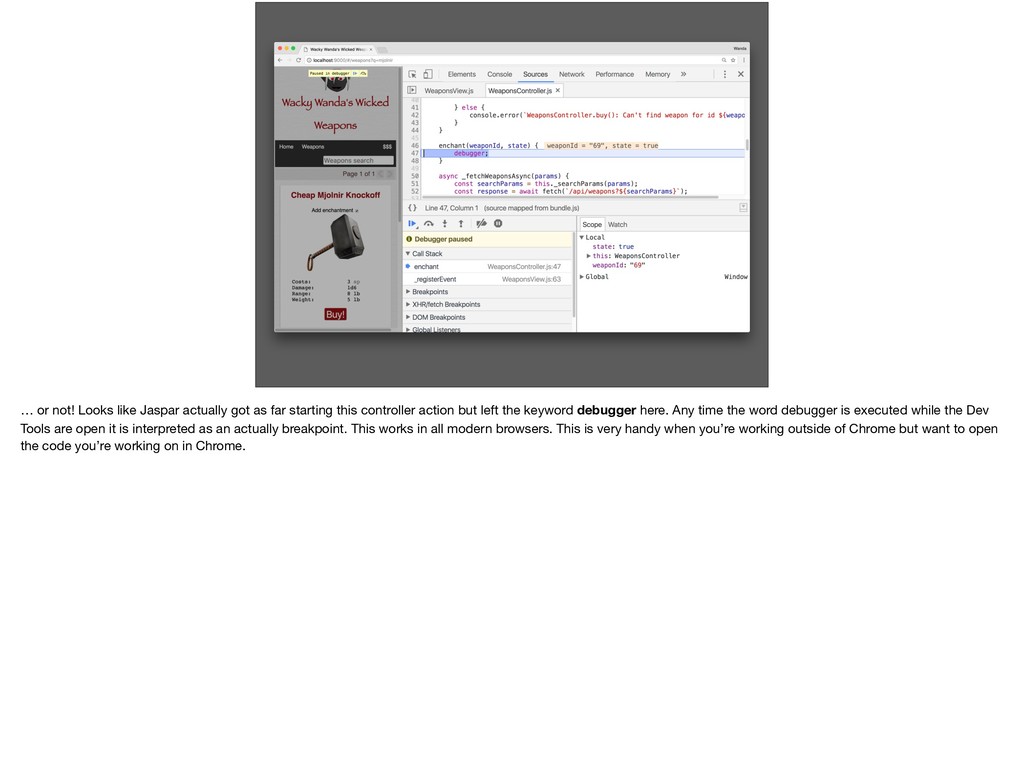
starting this controller action but left the keyword debugger here. Any time the word debugger is executed while the Dev Tools are open it is interpreted as an actually breakpoint. This works in all modern browsers. This is very handy when you’re working outside of Chrome but want to open the code you’re working on in Chrome.
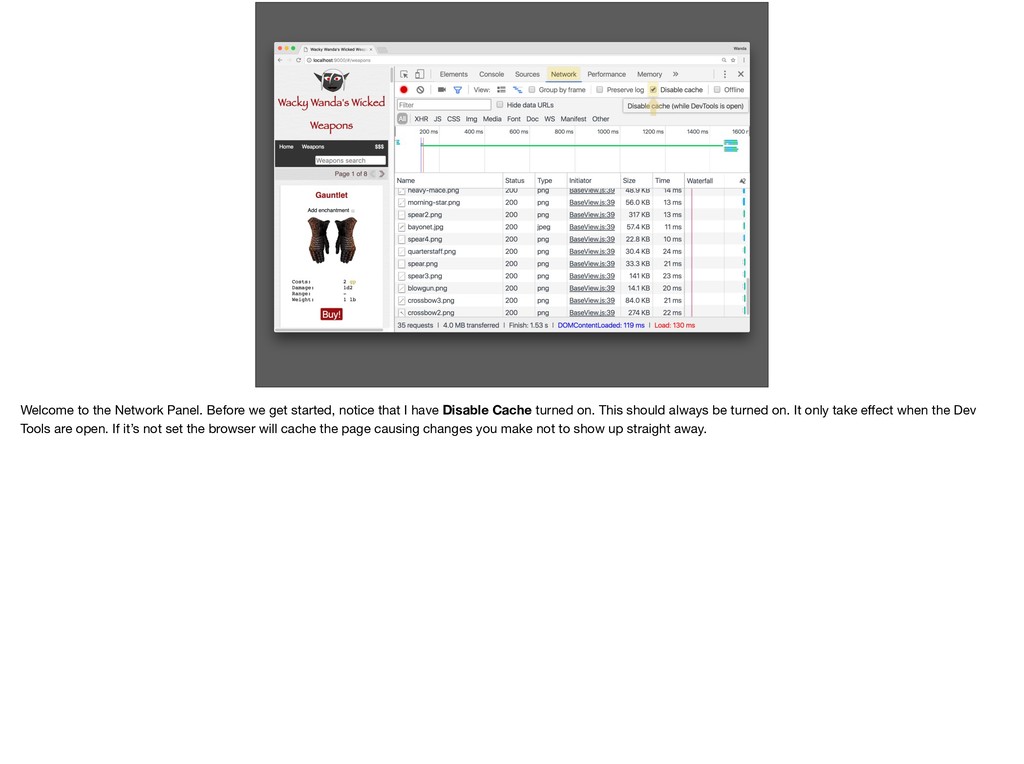
that I have Disable Cache turned on. This should always be turned on. It only take effect when the Dev Tools are open. If it’s not set the browser will cache the page causing changes you make not to show up straight away.
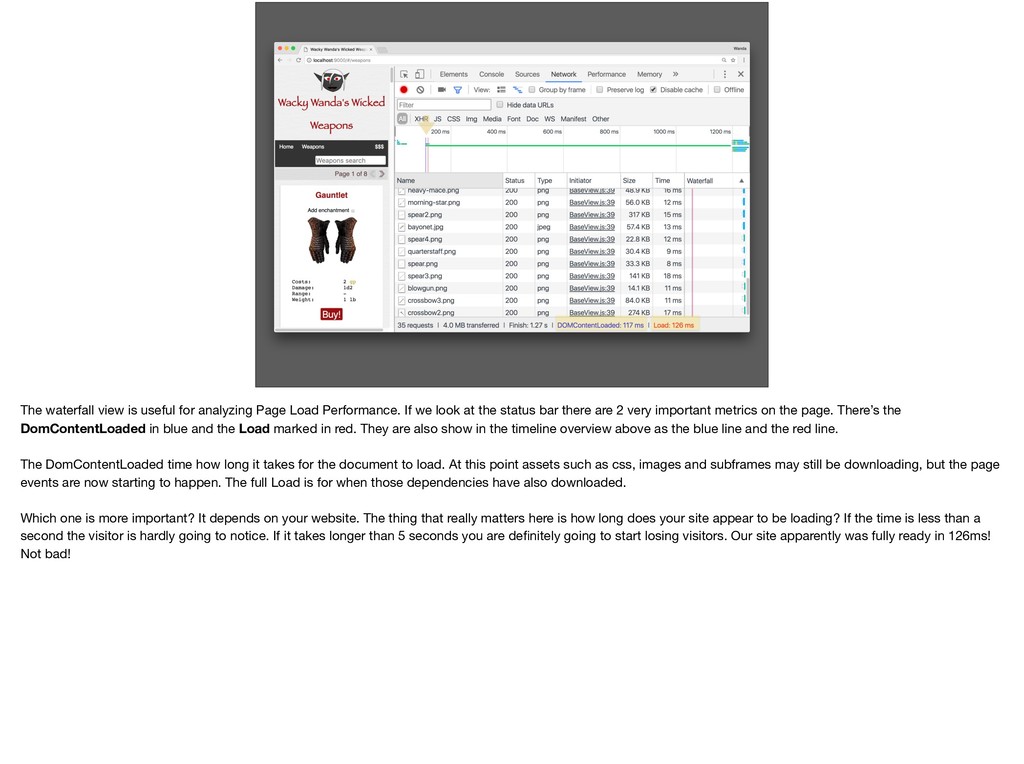
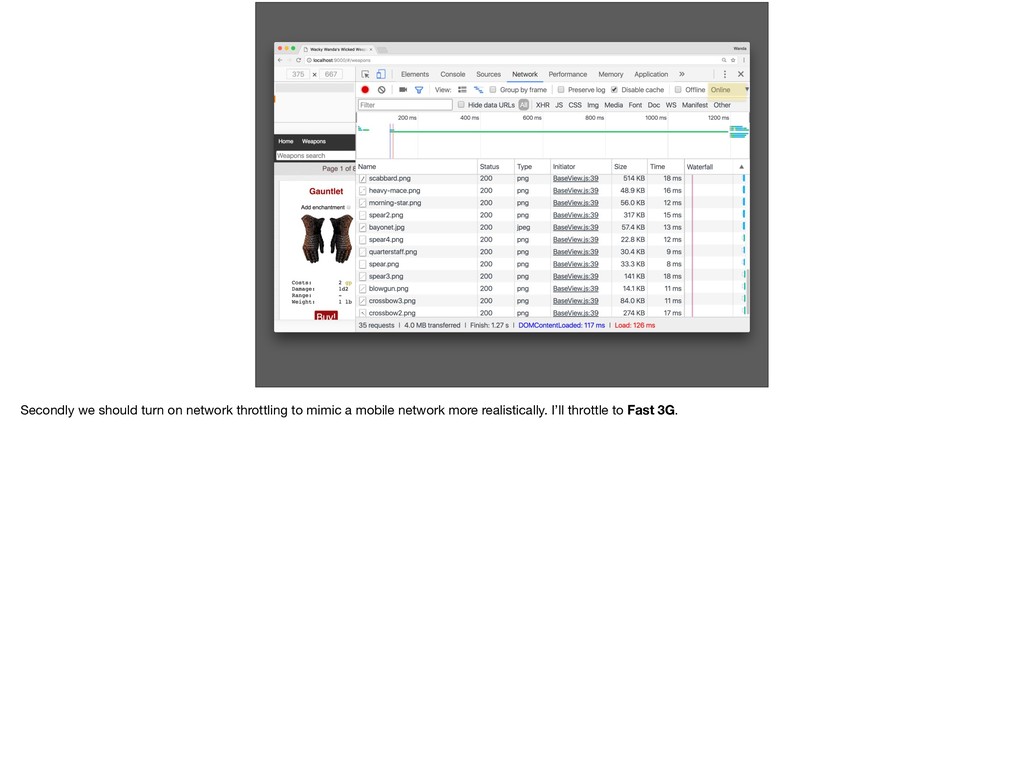
If we look at the status bar there are 2 very important metrics on the page. There’s the DomContentLoaded in blue and the Load marked in red. They are also show in the timeline overview above as the blue line and the red line. The DomContentLoaded time how long it takes for the document to load. At this point assets such as css, images and subframes may still be downloading, but the page events are now starting to happen. The full Load is for when those dependencies have also downloaded. Which one is more important? It depends on your website. The thing that really matters here is how long does your site appear to be loading? If the time is less than a second the visitor is hardly going to notice. If it takes longer than 5 seconds you are definitely going to start losing visitors. Our site apparently was fully ready in 126ms! Not bad!
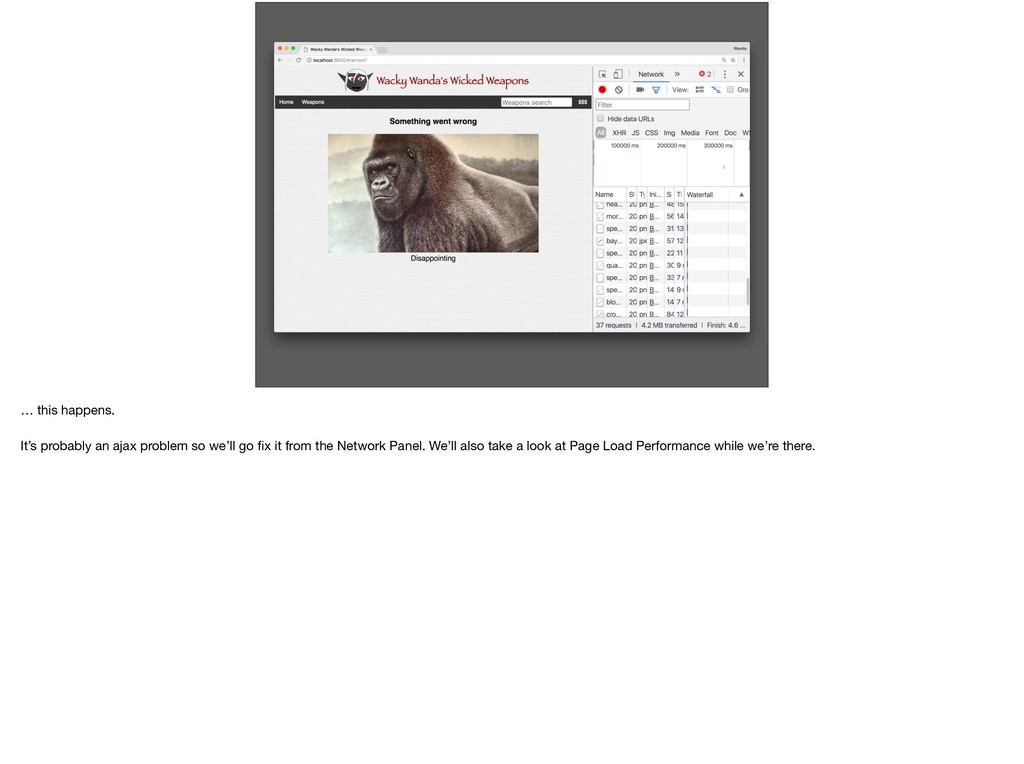
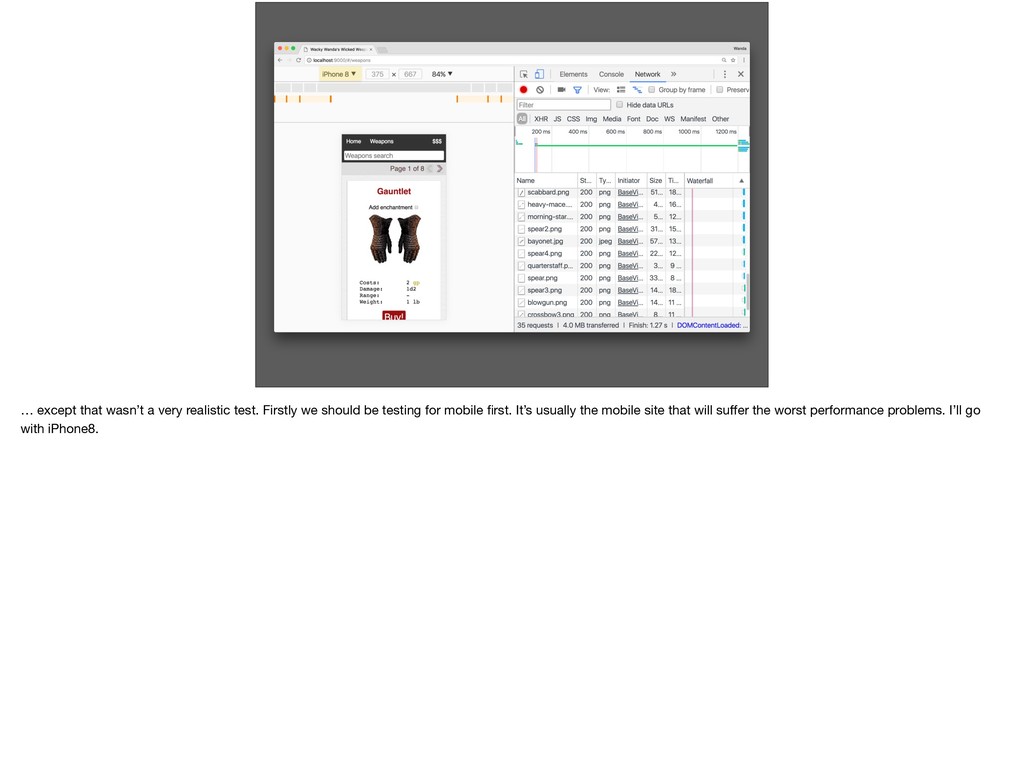
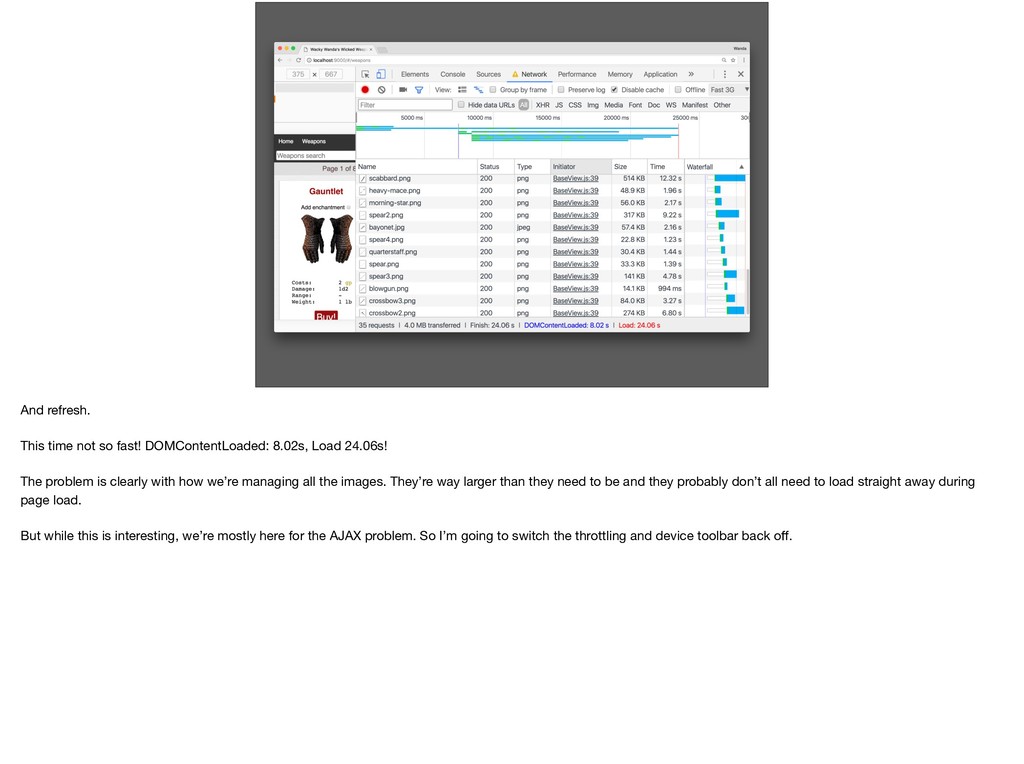
24.06s! The problem is clearly with how we’re managing all the images. They’re way larger than they need to be and they probably don’t all need to load straight away during page load. But while this is interesting, we’re mostly here for the AJAX problem. So I’m going to switch the throttling and device toolbar back off.
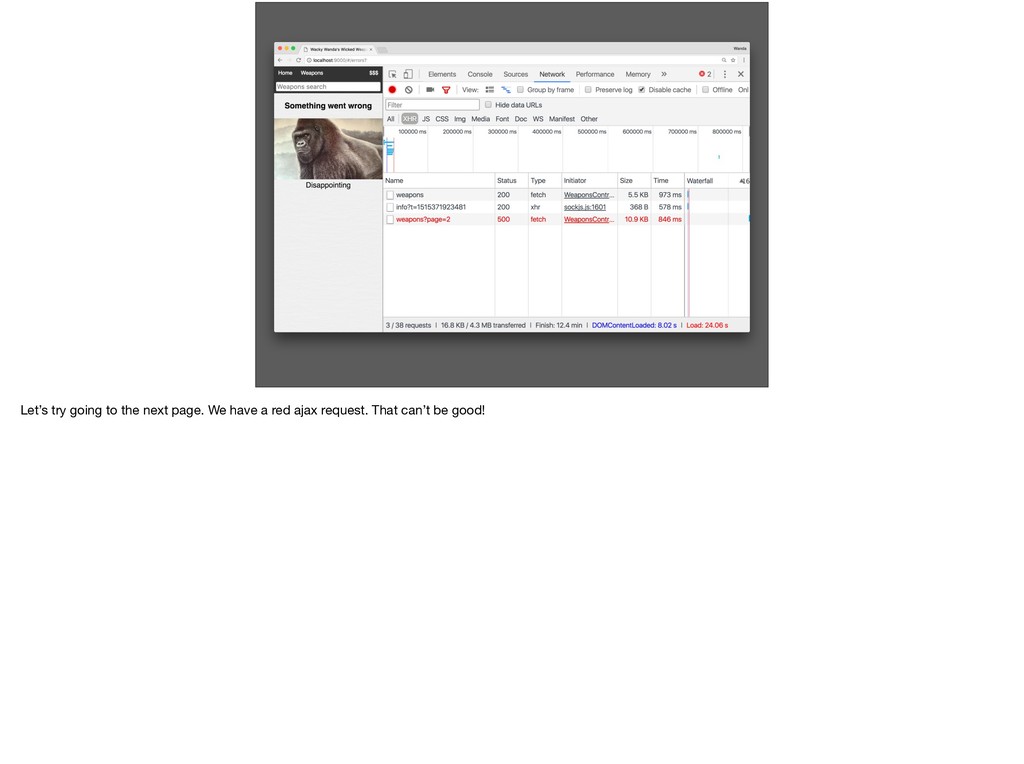
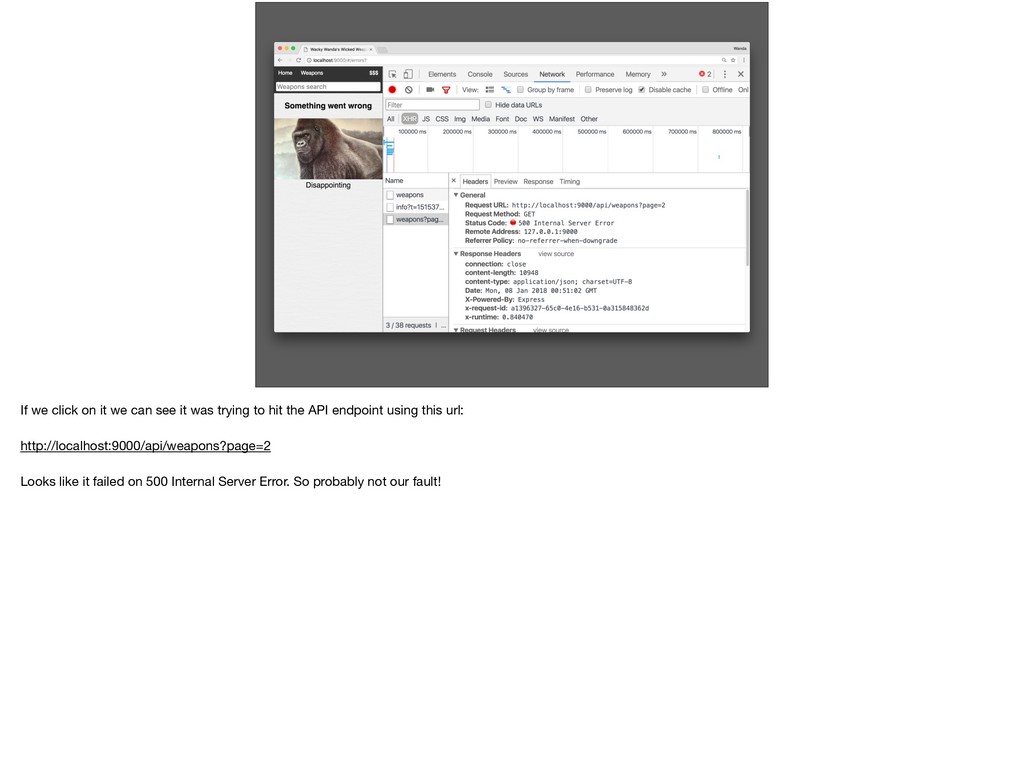
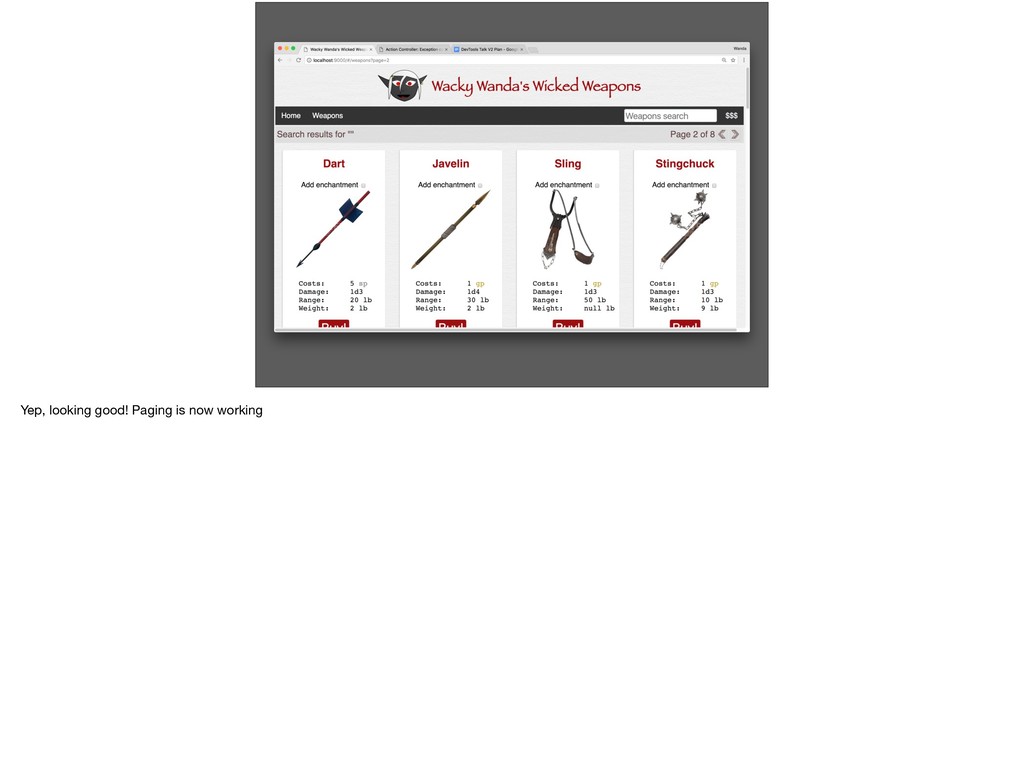
trying to hit the API endpoint using this url: http://localhost:9000/api/weapons?page=2 Looks like it failed on 500 Internal Server Error. So probably not our fault!
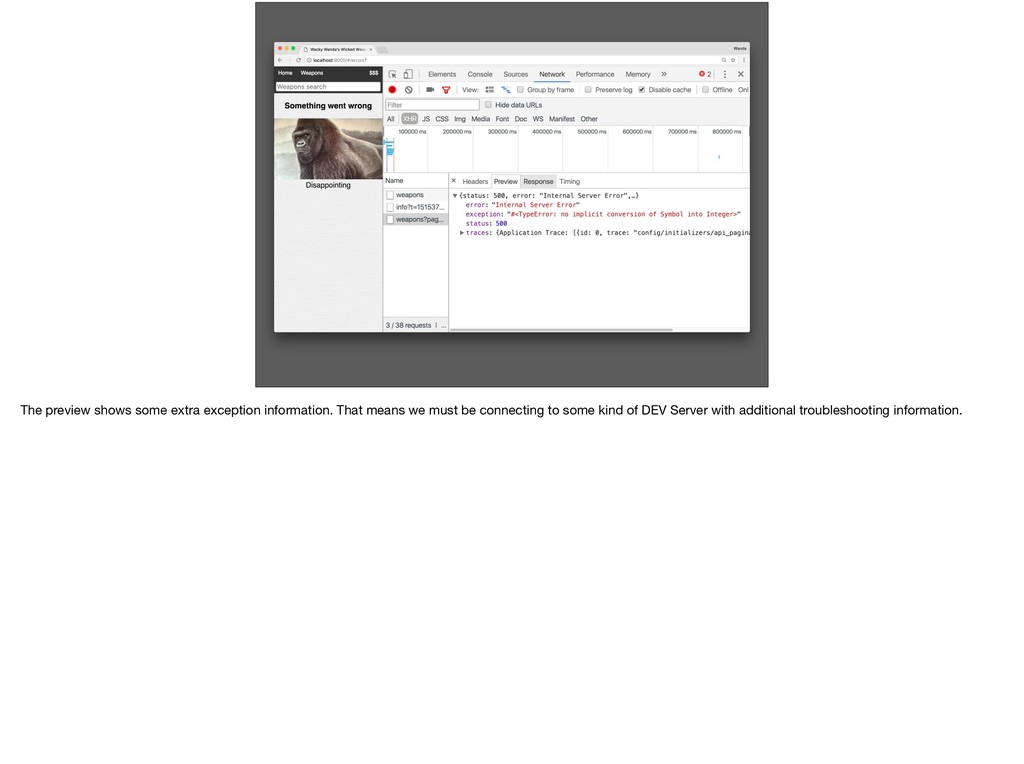
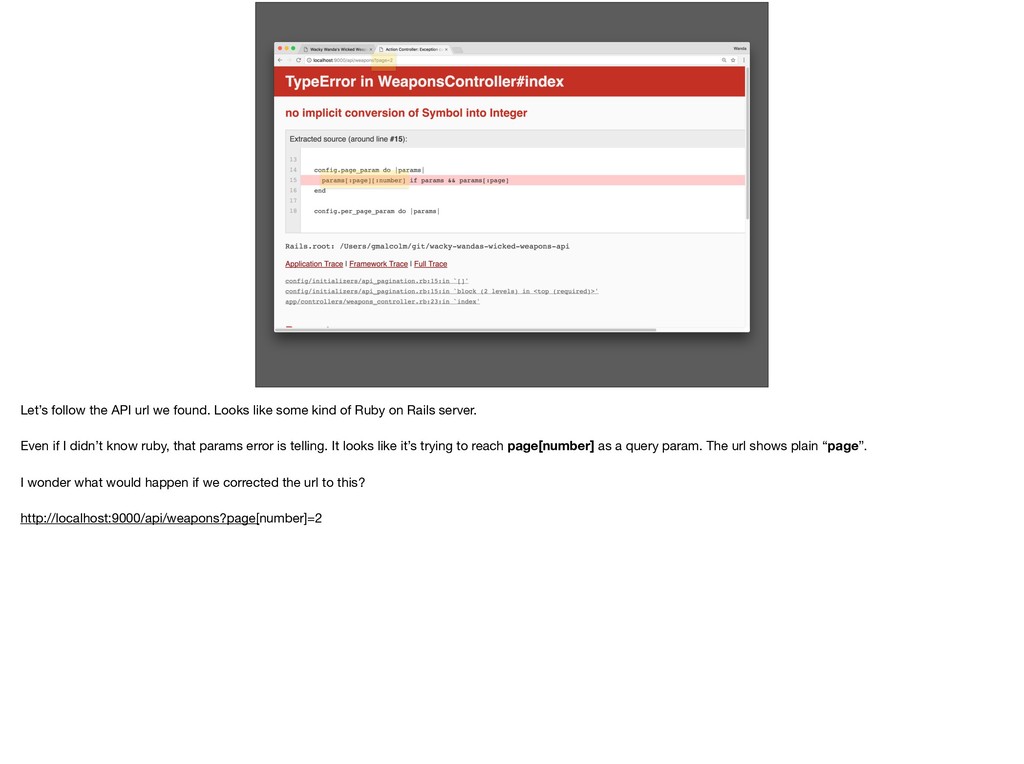
kind of Ruby on Rails server. Even if I didn’t know ruby, that params error is telling. It looks like it’s trying to reach page[number] as a query param. The url shows plain “page”. I wonder what would happen if we corrected the url to this? http://localhost:9000/api/weapons?page[number]=2
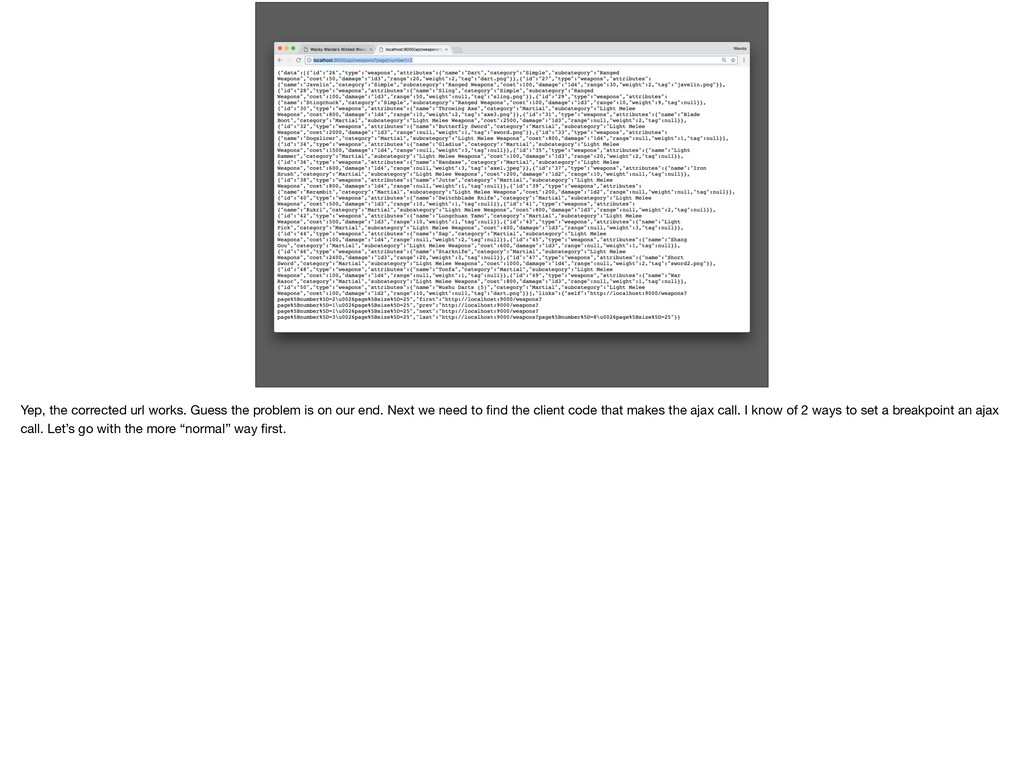
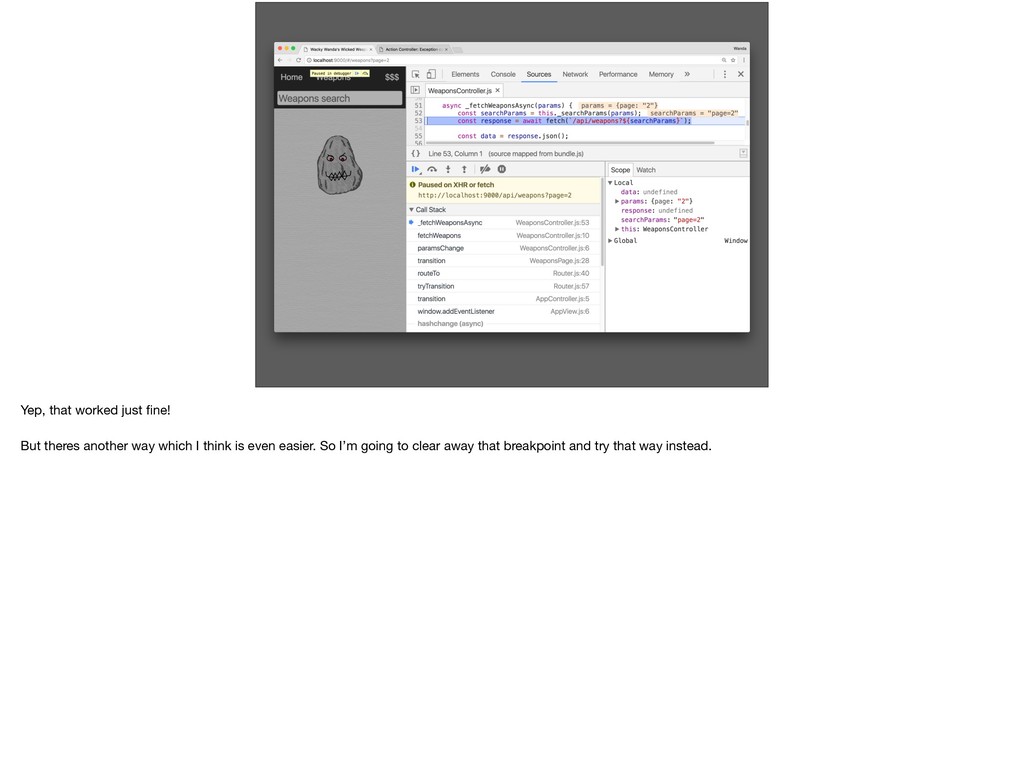
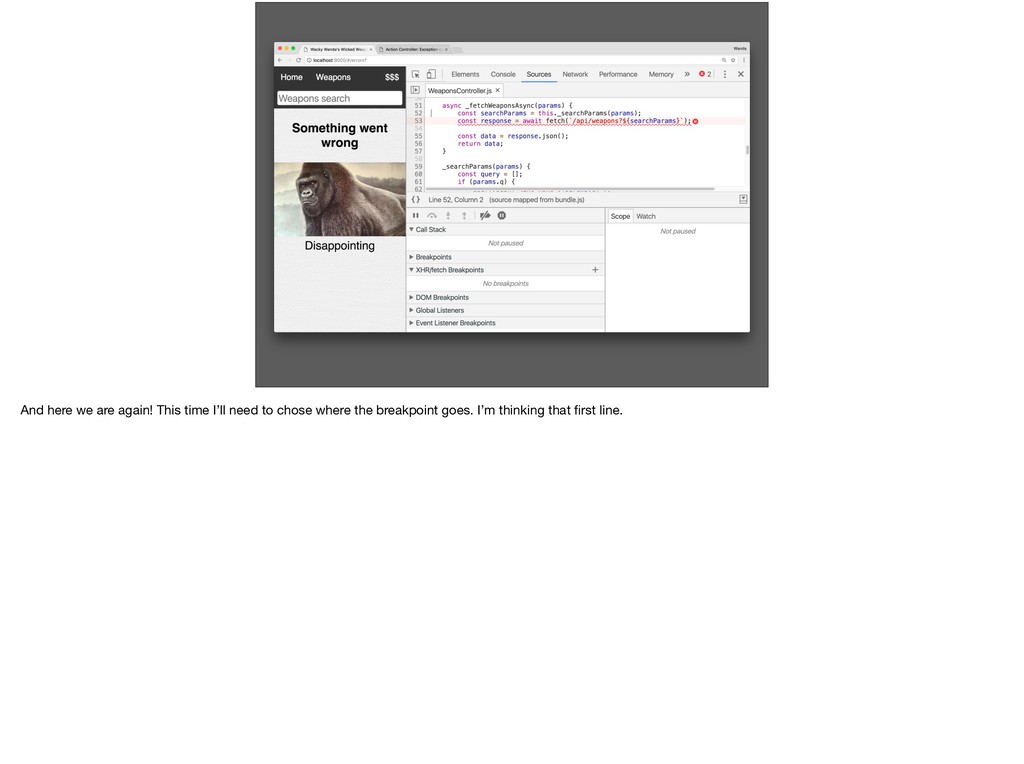
our end. Next we need to find the client code that makes the ajax call. I know of 2 ways to set a breakpoint an ajax call. Let’s go with the more “normal” way first.
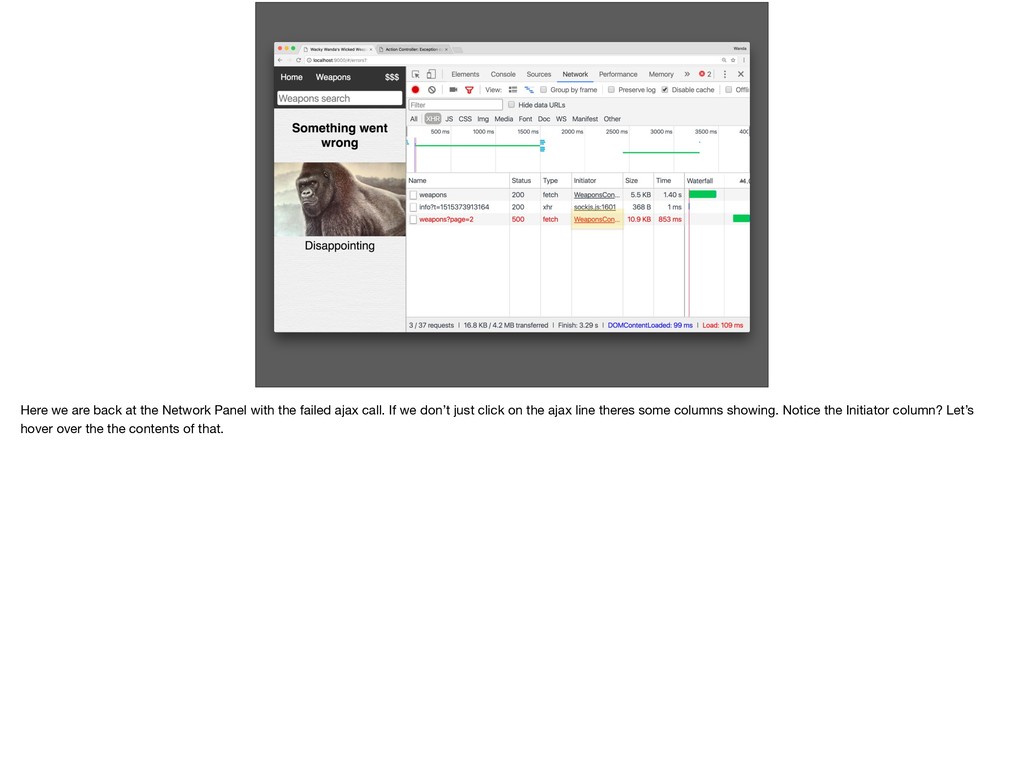
failed ajax call. If we don’t just click on the ajax line theres some columns showing. Notice the Initiator column? Let’s hover over the the contents of that.
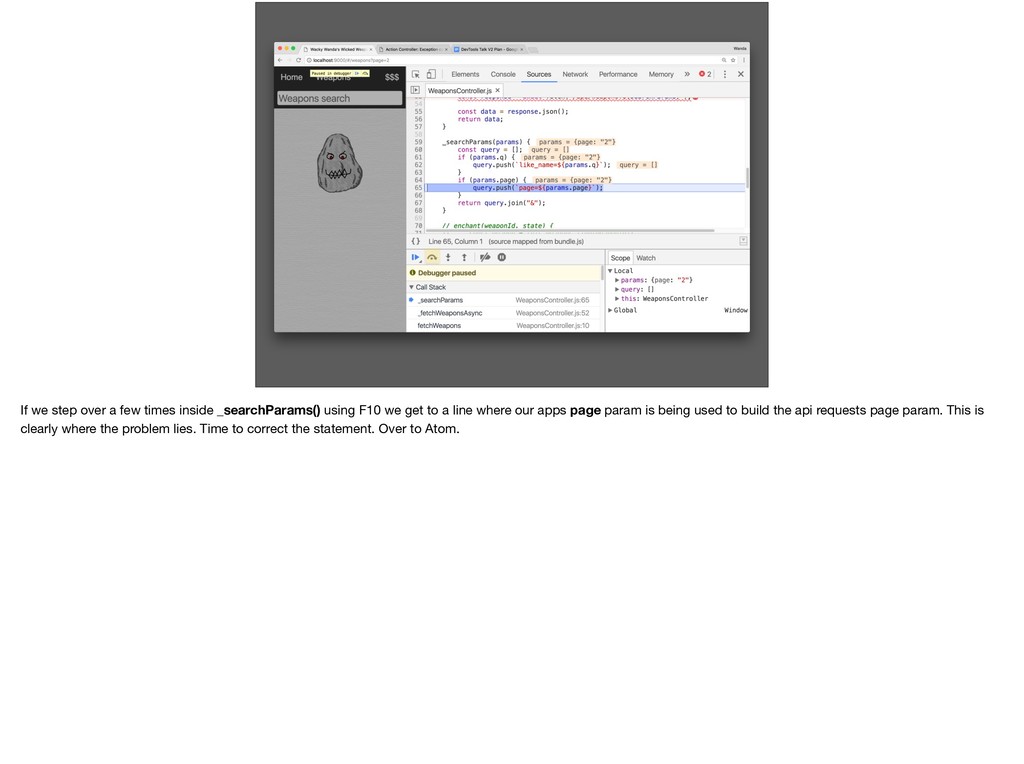
F10 we get to a line where our apps page param is being used to build the api requests page param. This is clearly where the problem lies. Time to correct the statement. Over to Atom.
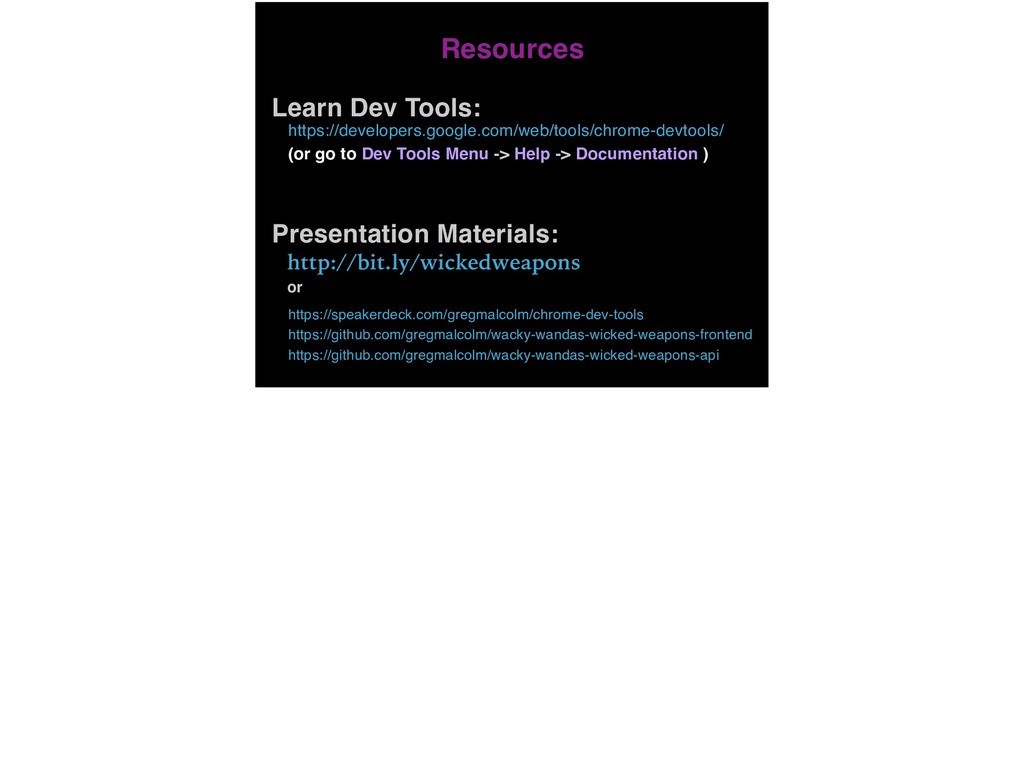
Menu -> Help -> Documentation ) Presentation Materials: https://speakerdeck.com/gregmalcolm/chrome-dev-tools https://github.com/gregmalcolm/wacky-wandas-wicked-weapons-frontend https://github.com/gregmalcolm/wacky-wandas-wicked-weapons-api http://bit.ly/wickedweapons or
![Insert “[number]”. Save. Remove breakpoints and refresh the browser.](https://files.speakerdeck.com/presentations/1d985cc387f046f8bb5d5dd89b776167/slide_115.jpg)