Charting the Digital Library Evaluation Domain with a Semantically Enhanced Mining Methodology
Afiontzi, Kazadeis, Papachristopoulos, Papatheodorou, Sfakakis, Tsakonas (2013) In Proceedings of the 13th ACM/IEEE-CS Joint Conference on Digital Libraries.
Mining Methodology S Eleni A ontzi,1 Giannis Kazadeis,1 Leonidas Papachristopoulos,2 Michalis Sfakakis,2 Giannis Tsakonas,2 Christos Papatheodorou2 13th ACM/IEEE Joint Conference on Digital Libraries, July 22-26, Indianapolis, IN, USA 1. Department of Informatics, Athens University of Economics & Business 2. Database & Information Systems Group, Department of Archives & Library Science, Ionian University
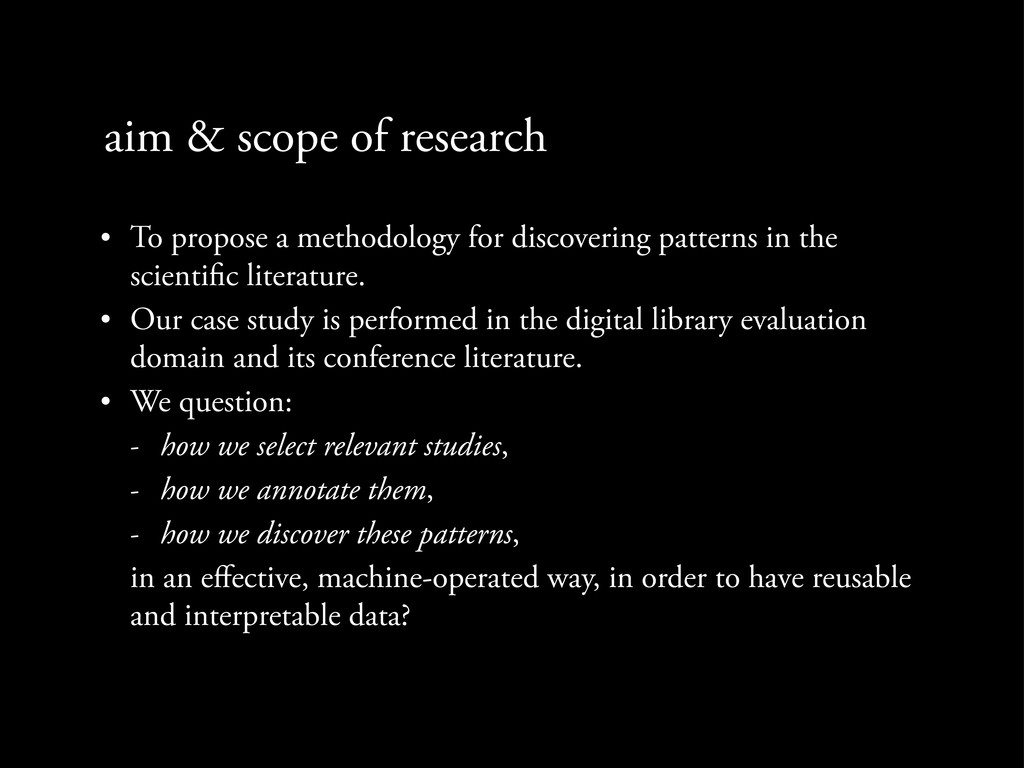
for discovering patterns in the scienti c literature. • Our case study is performed in the digital library evaluation domain and its conference literature.
for discovering patterns in the scienti c literature. • Our case study is performed in the digital library evaluation domain and its conference literature. • We question:
for discovering patterns in the scienti c literature. • Our case study is performed in the digital library evaluation domain and its conference literature. • We question: - how we select relevant studies,
for discovering patterns in the scienti c literature. • Our case study is performed in the digital library evaluation domain and its conference literature. • We question: - how we select relevant studies, - how we annotate them,
for discovering patterns in the scienti c literature. • Our case study is performed in the digital library evaluation domain and its conference literature. • We question: - how we select relevant studies, - how we annotate them, - how we discover these patterns,
for discovering patterns in the scienti c literature. • Our case study is performed in the digital library evaluation domain and its conference literature. • We question: - how we select relevant studies, - how we annotate them, - how we discover these patterns, in an effective, machine-operated way, in order to have reusable and interpretable data?
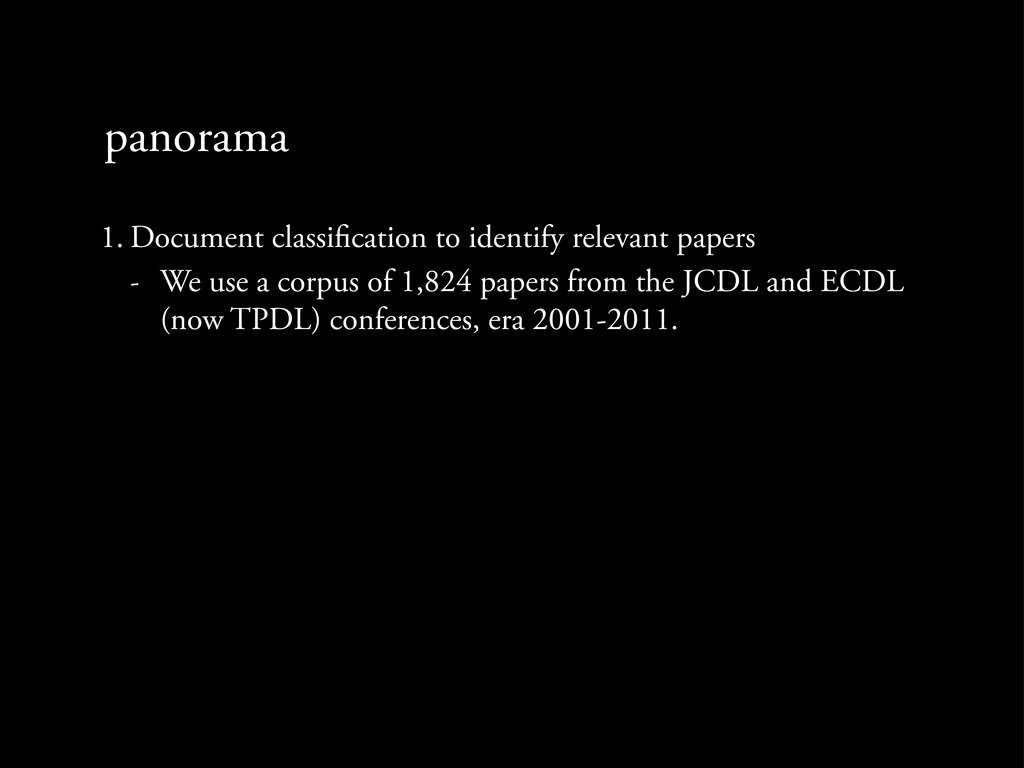
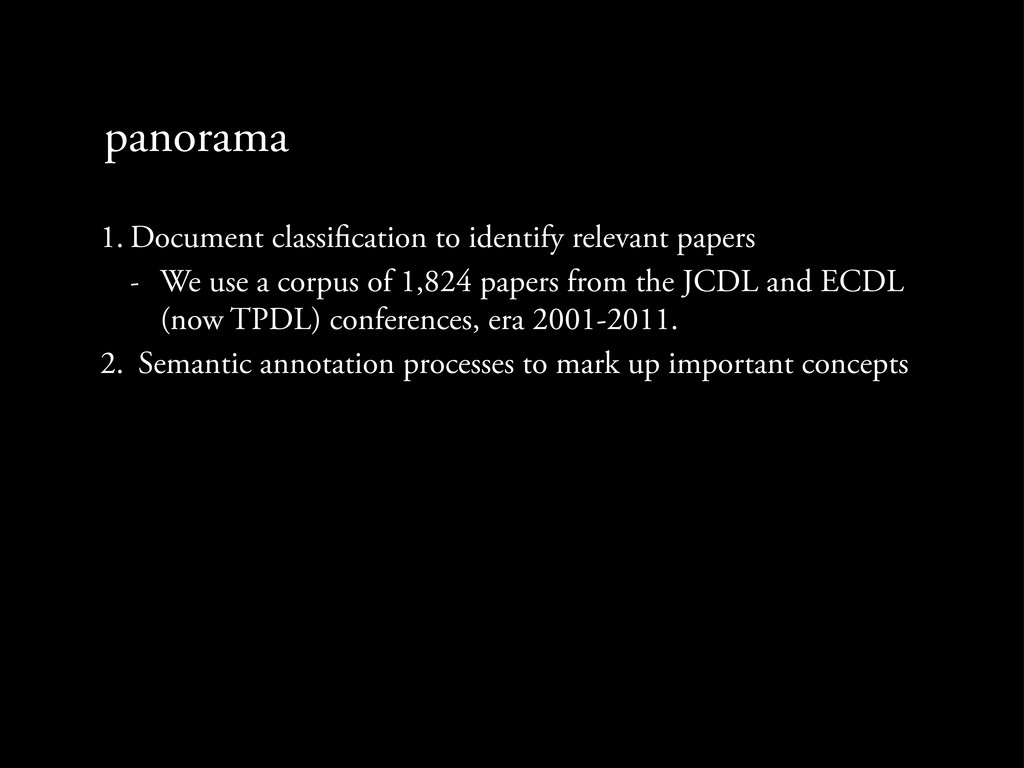
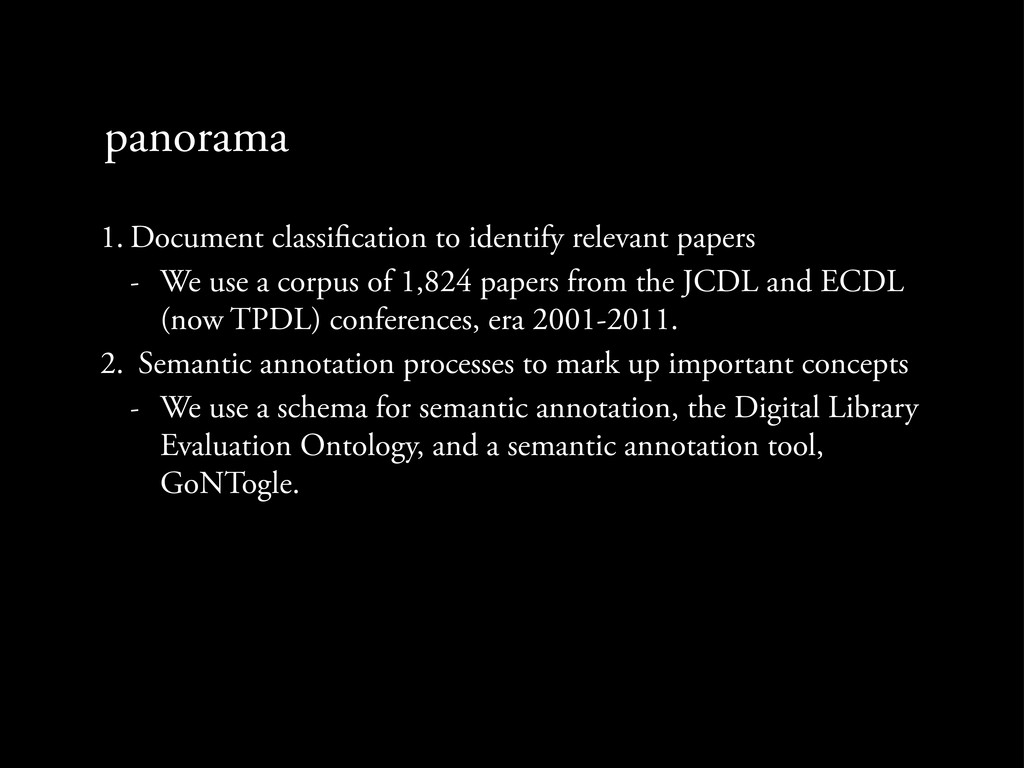
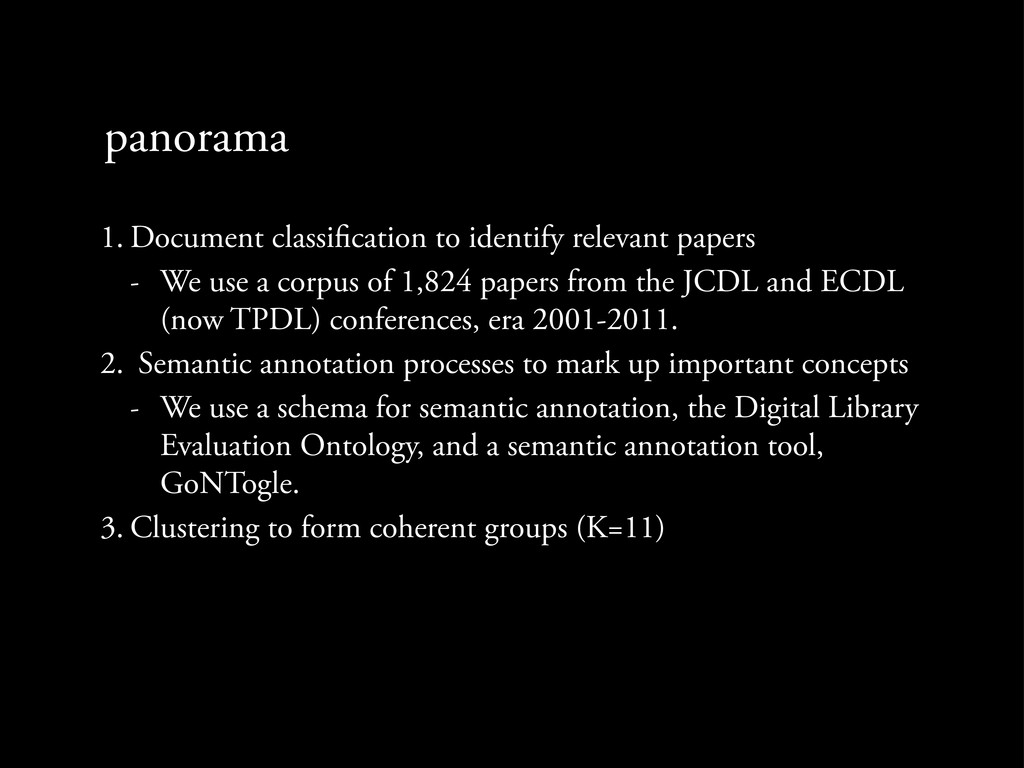
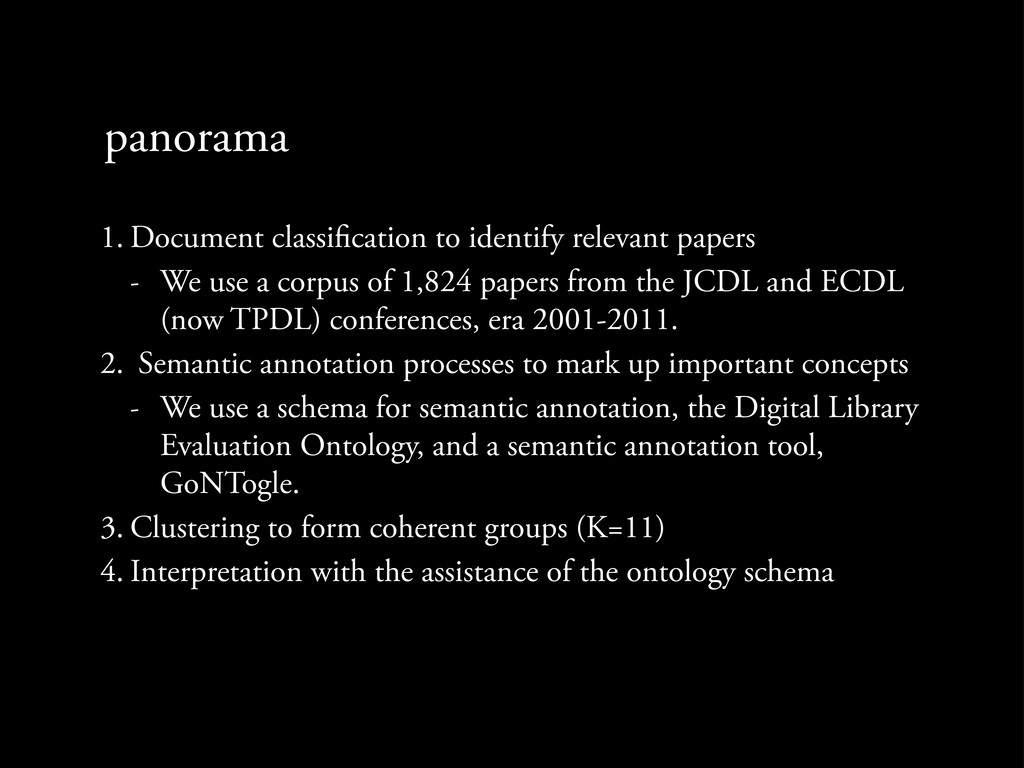
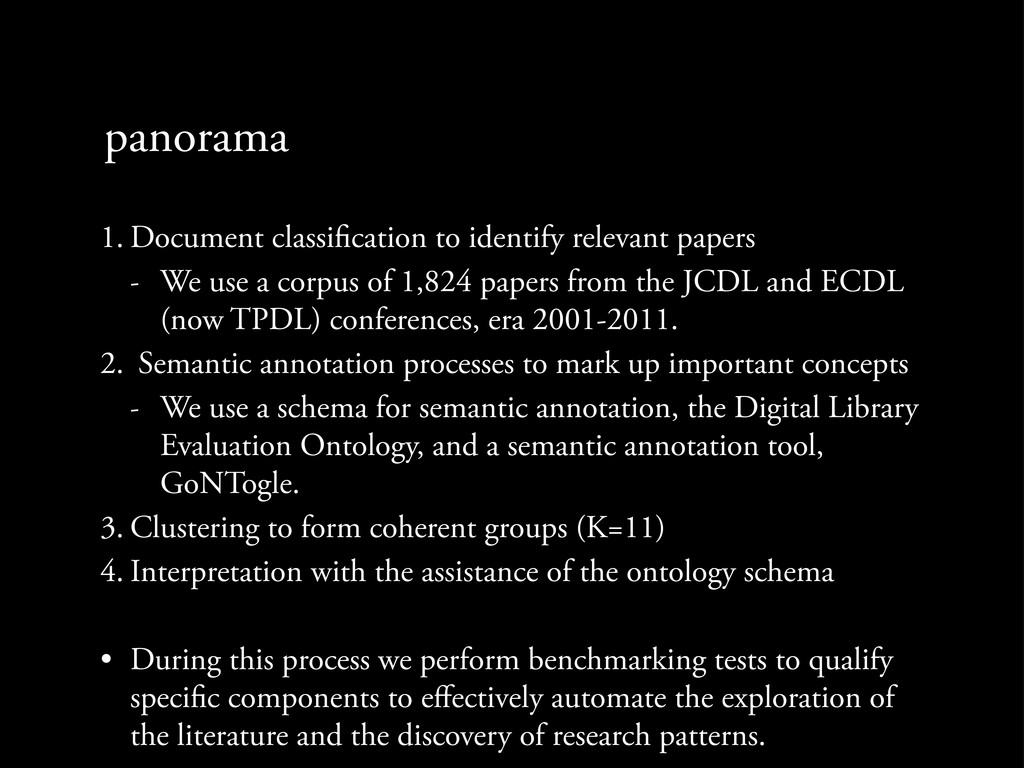
We use a corpus of 1,824 papers from the JCDL and ECDL (now TPDL) conferences, era 2001-2011. 2. Semantic annotation processes to mark up important concepts
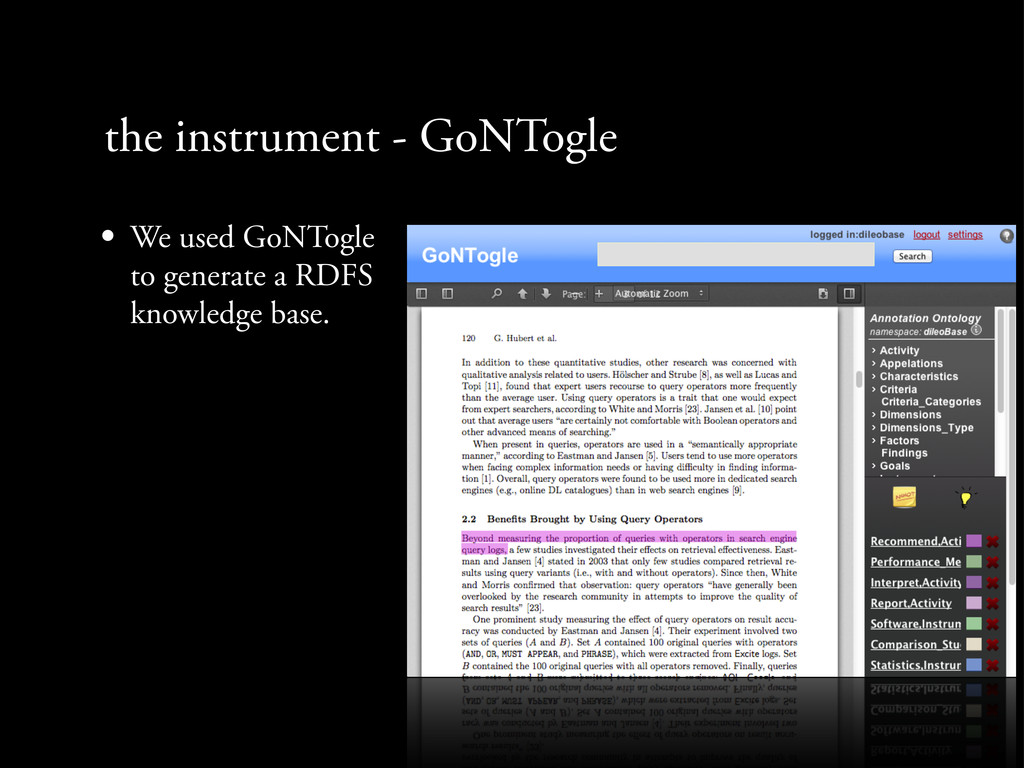
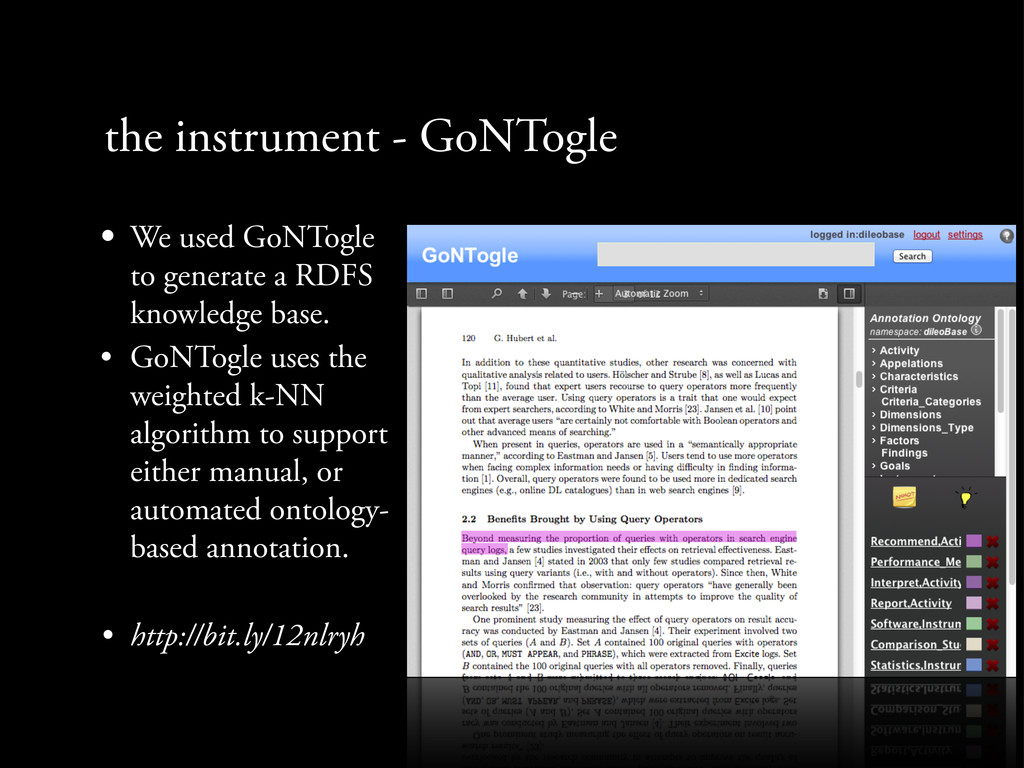
We use a corpus of 1,824 papers from the JCDL and ECDL (now TPDL) conferences, era 2001-2011. 2. Semantic annotation processes to mark up important concepts - We use a schema for semantic annotation, the Digital Library Evaluation Ontology, and a semantic annotation tool, GoNTogle.
We use a corpus of 1,824 papers from the JCDL and ECDL (now TPDL) conferences, era 2001-2011. 2. Semantic annotation processes to mark up important concepts - We use a schema for semantic annotation, the Digital Library Evaluation Ontology, and a semantic annotation tool, GoNTogle. 3. Clustering to form coherent groups (K=11)
We use a corpus of 1,824 papers from the JCDL and ECDL (now TPDL) conferences, era 2001-2011. 2. Semantic annotation processes to mark up important concepts - We use a schema for semantic annotation, the Digital Library Evaluation Ontology, and a semantic annotation tool, GoNTogle. 3. Clustering to form coherent groups (K=11) 4. Interpretation with the assistance of the ontology schema
We use a corpus of 1,824 papers from the JCDL and ECDL (now TPDL) conferences, era 2001-2011. 2. Semantic annotation processes to mark up important concepts - We use a schema for semantic annotation, the Digital Library Evaluation Ontology, and a semantic annotation tool, GoNTogle. 3. Clustering to form coherent groups (K=11) 4. Interpretation with the assistance of the ontology schema
We use a corpus of 1,824 papers from the JCDL and ECDL (now TPDL) conferences, era 2001-2011. 2. Semantic annotation processes to mark up important concepts - We use a schema for semantic annotation, the Digital Library Evaluation Ontology, and a semantic annotation tool, GoNTogle. 3. Clustering to form coherent groups (K=11) 4. Interpretation with the assistance of the ontology schema • During this process we perform benchmarking tests to qualify speci c components to effectively automate the exploration of the literature and the discovery of research patterns.
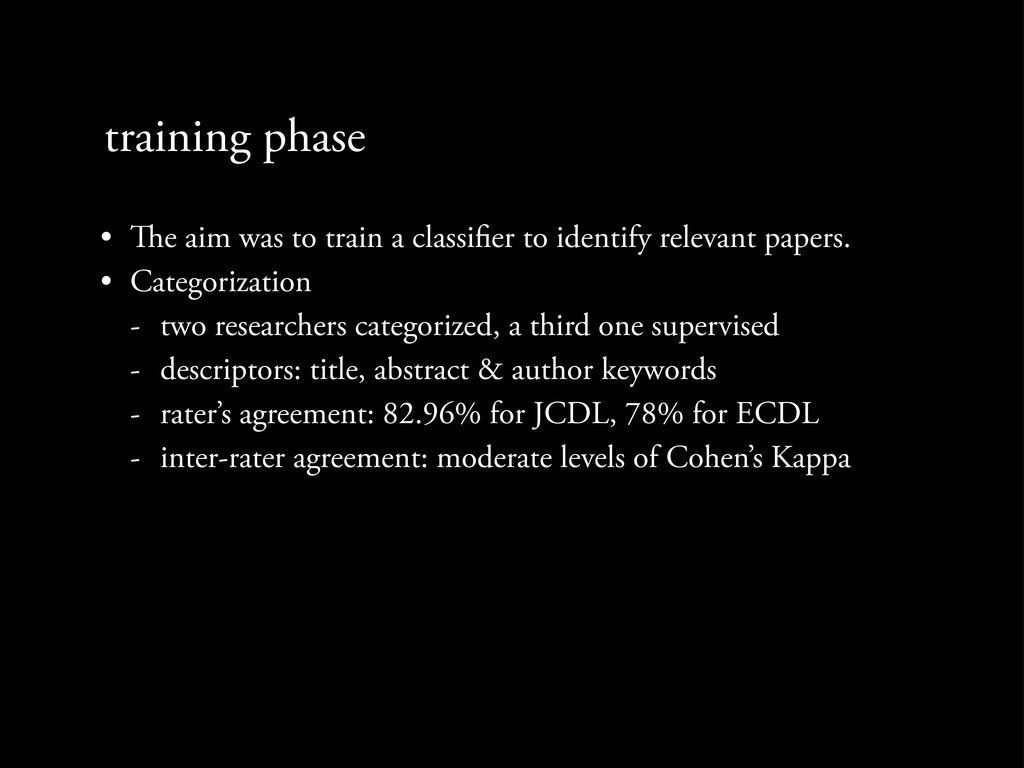
er to identify relevant papers. • Categorization - two researchers categorized, a third one supervised - descriptors: title, abstract & author keywords
er to identify relevant papers. • Categorization - two researchers categorized, a third one supervised - descriptors: title, abstract & author keywords - rater’s agreement: 82.96% for JCDL, 78% for ECDL
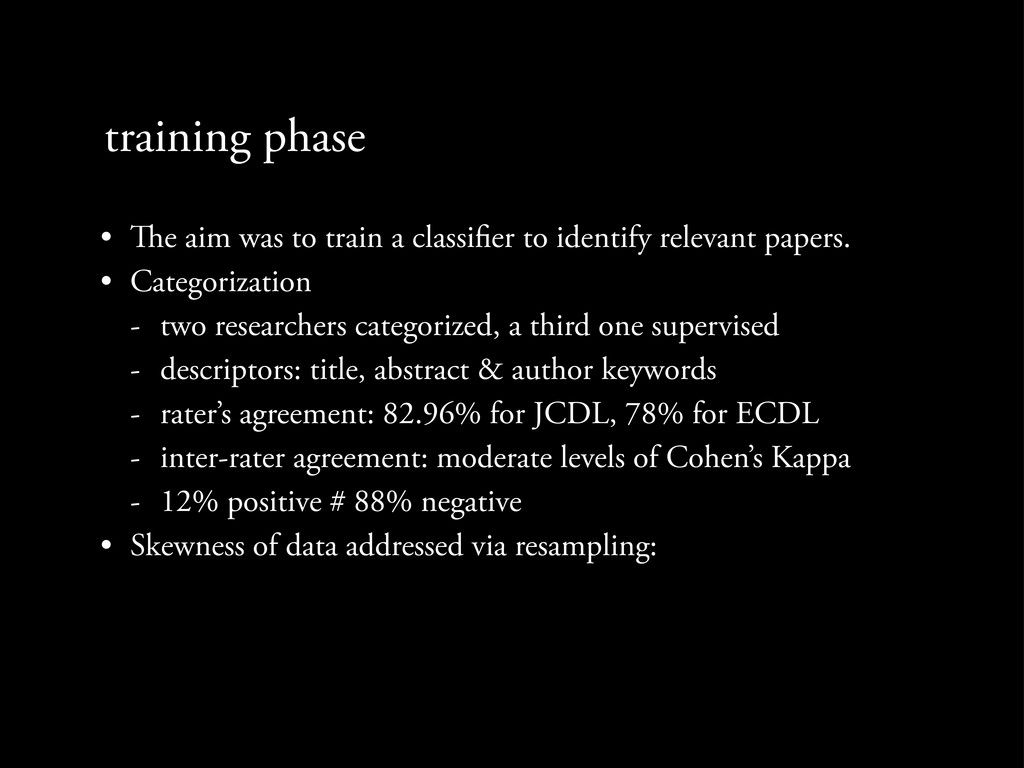
er to identify relevant papers. • Categorization - two researchers categorized, a third one supervised - descriptors: title, abstract & author keywords - rater’s agreement: 82.96% for JCDL, 78% for ECDL - inter-rater agreement: moderate levels of Cohen’s Kappa
er to identify relevant papers. • Categorization - two researchers categorized, a third one supervised - descriptors: title, abstract & author keywords - rater’s agreement: 82.96% for JCDL, 78% for ECDL - inter-rater agreement: moderate levels of Cohen’s Kappa - 12% positive # 88% negative
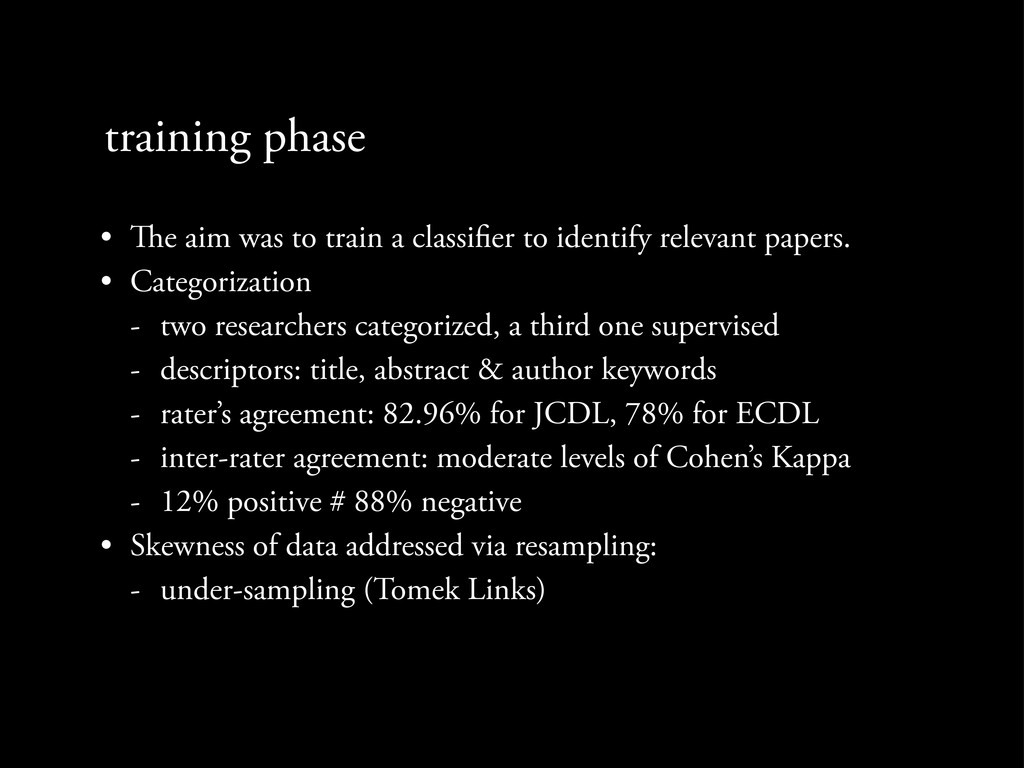
er to identify relevant papers. • Categorization - two researchers categorized, a third one supervised - descriptors: title, abstract & author keywords - rater’s agreement: 82.96% for JCDL, 78% for ECDL - inter-rater agreement: moderate levels of Cohen’s Kappa - 12% positive # 88% negative • Skewness of data addressed via resampling:
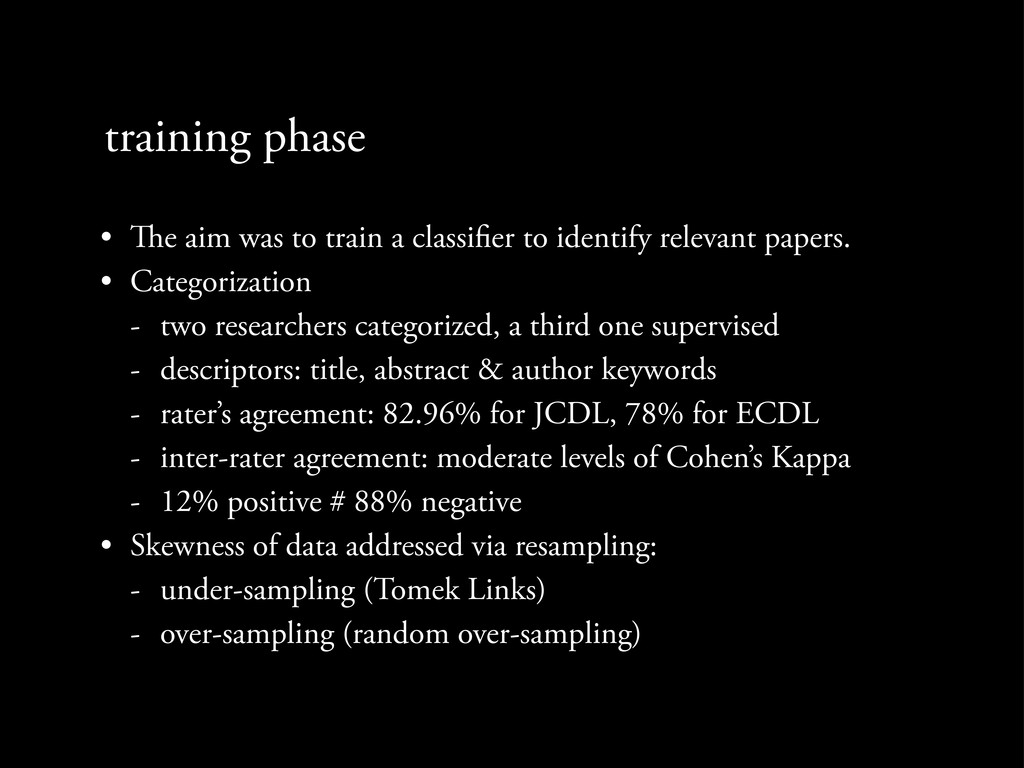
er to identify relevant papers. • Categorization - two researchers categorized, a third one supervised - descriptors: title, abstract & author keywords - rater’s agreement: 82.96% for JCDL, 78% for ECDL - inter-rater agreement: moderate levels of Cohen’s Kappa - 12% positive # 88% negative • Skewness of data addressed via resampling: - under-sampling (Tomek Links)
er to identify relevant papers. • Categorization - two researchers categorized, a third one supervised - descriptors: title, abstract & author keywords - rater’s agreement: 82.96% for JCDL, 78% for ECDL - inter-rater agreement: moderate levels of Cohen’s Kappa - 12% positive # 88% negative • Skewness of data addressed via resampling: - under-sampling (Tomek Links) - over-sampling (random over-sampling)
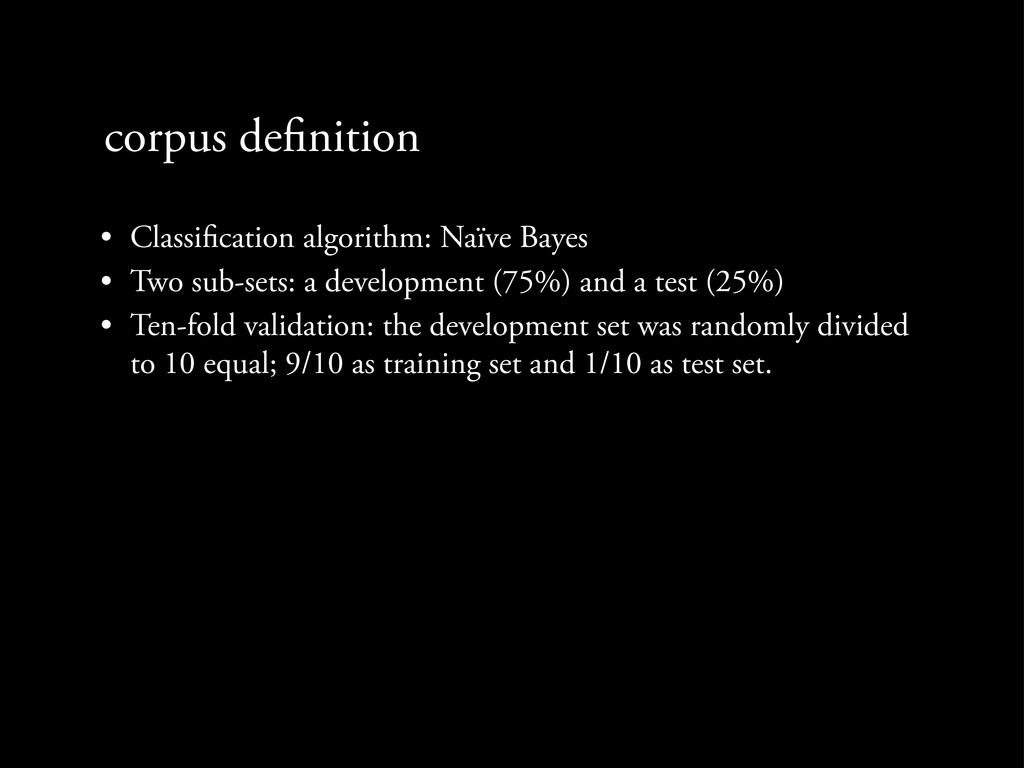
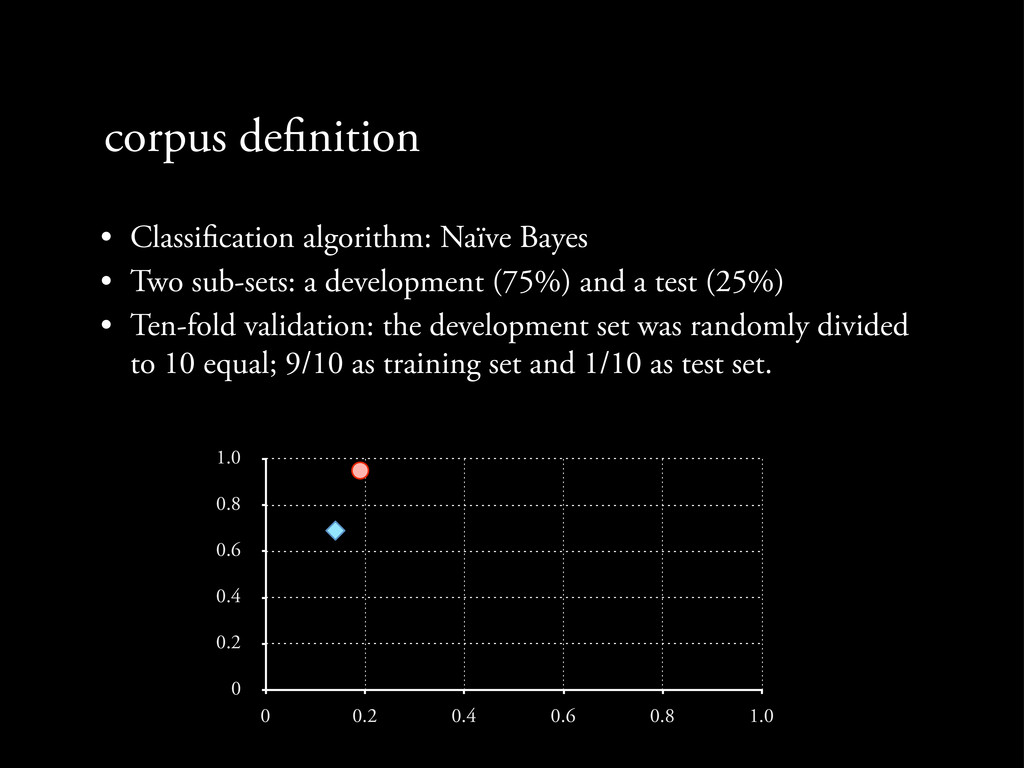
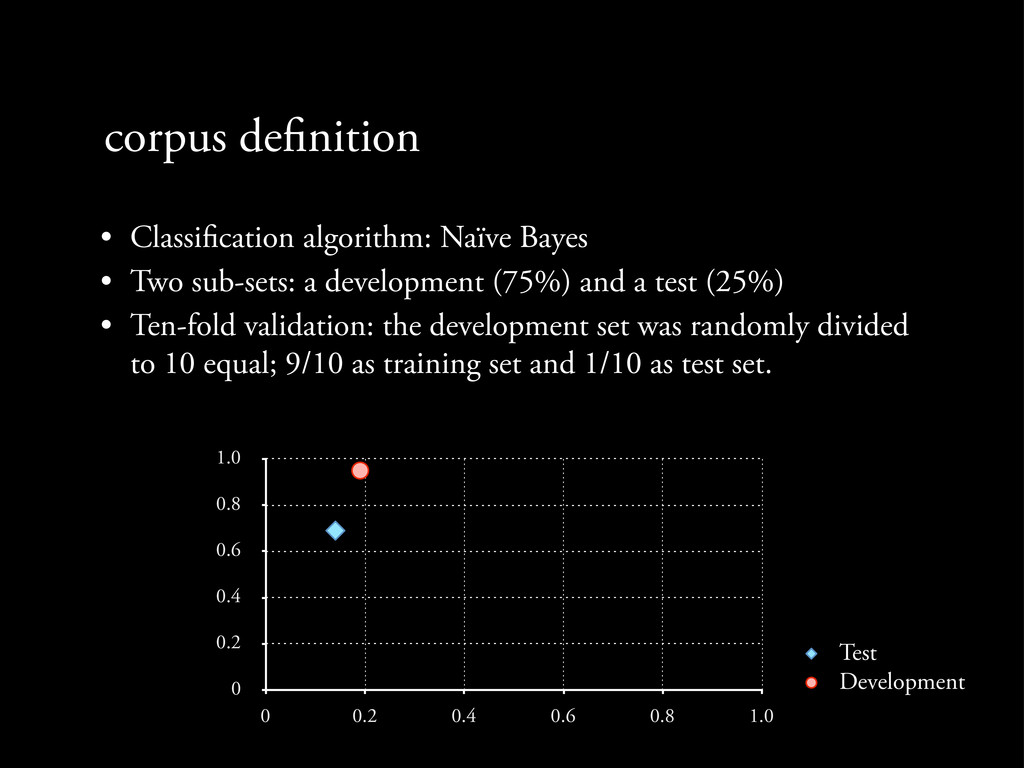
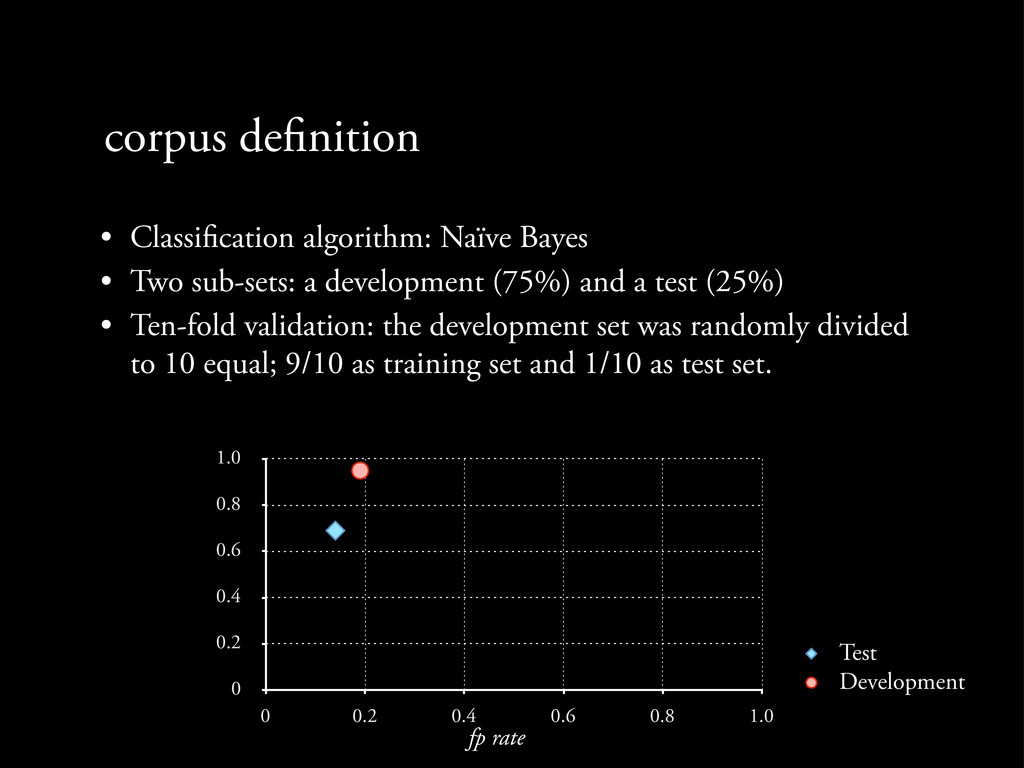
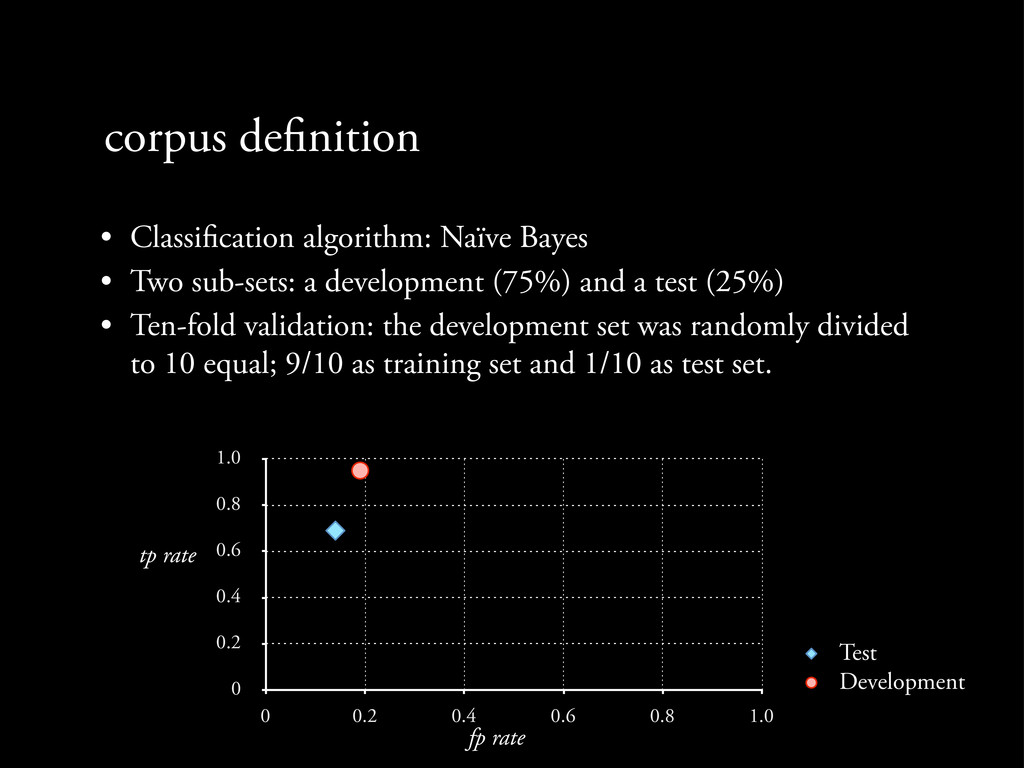
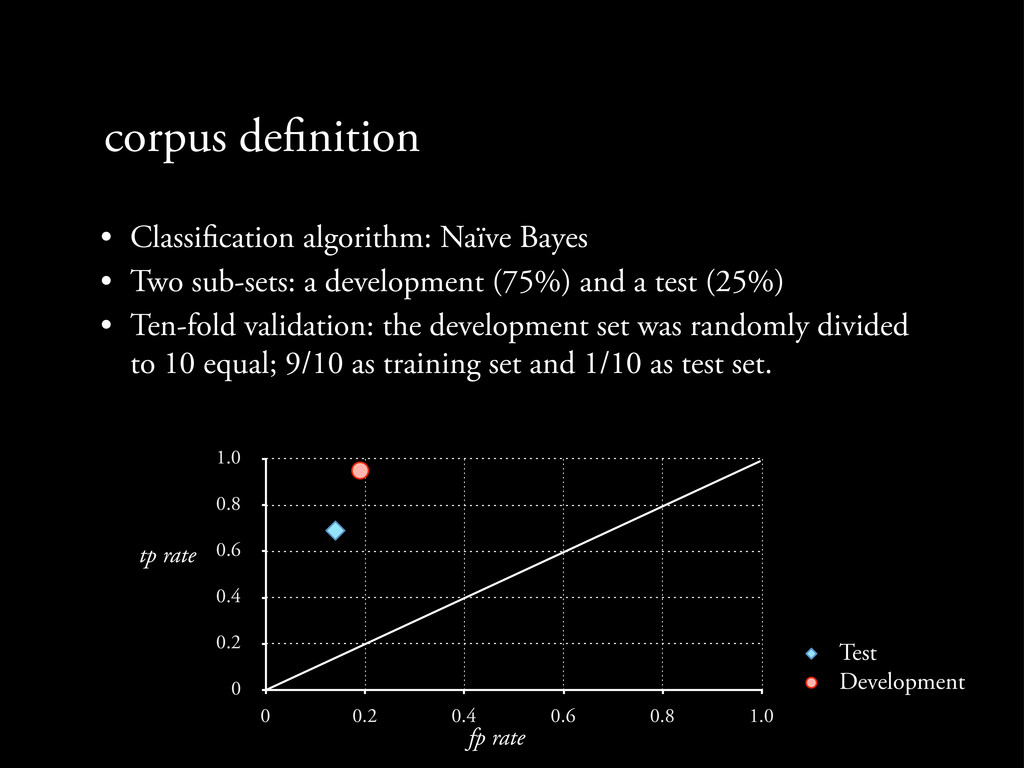
Two sub-sets: a development (75%) and a test (25%) • Ten-fold validation: the development set was randomly divided to 10 equal; 9/10 as training set and 1/10 as test set.
Two sub-sets: a development (75%) and a test (25%) • Ten-fold validation: the development set was randomly divided to 10 equal; 9/10 as training set and 1/10 as test set. 0 0.2 0.4 0.6 0.8 1.0 0 0.2 0.4 0.6 0.8 1.0
Two sub-sets: a development (75%) and a test (25%) • Ten-fold validation: the development set was randomly divided to 10 equal; 9/10 as training set and 1/10 as test set. 0 0.2 0.4 0.6 0.8 1.0 0 0.2 0.4 0.6 0.8 1.0 Test Development
Two sub-sets: a development (75%) and a test (25%) • Ten-fold validation: the development set was randomly divided to 10 equal; 9/10 as training set and 1/10 as test set. 0 0.2 0.4 0.6 0.8 1.0 0 0.2 0.4 0.6 0.8 1.0 Test Development fp rate
Two sub-sets: a development (75%) and a test (25%) • Ten-fold validation: the development set was randomly divided to 10 equal; 9/10 as training set and 1/10 as test set. 0 0.2 0.4 0.6 0.8 1.0 0 0.2 0.4 0.6 0.8 1.0 Test Development fp rate tp rate
Two sub-sets: a development (75%) and a test (25%) • Ten-fold validation: the development set was randomly divided to 10 equal; 9/10 as training set and 1/10 as test set. 0 0.2 0.4 0.6 0.8 1.0 0 0.2 0.4 0.6 0.8 1.0 Test Development fp rate tp rate
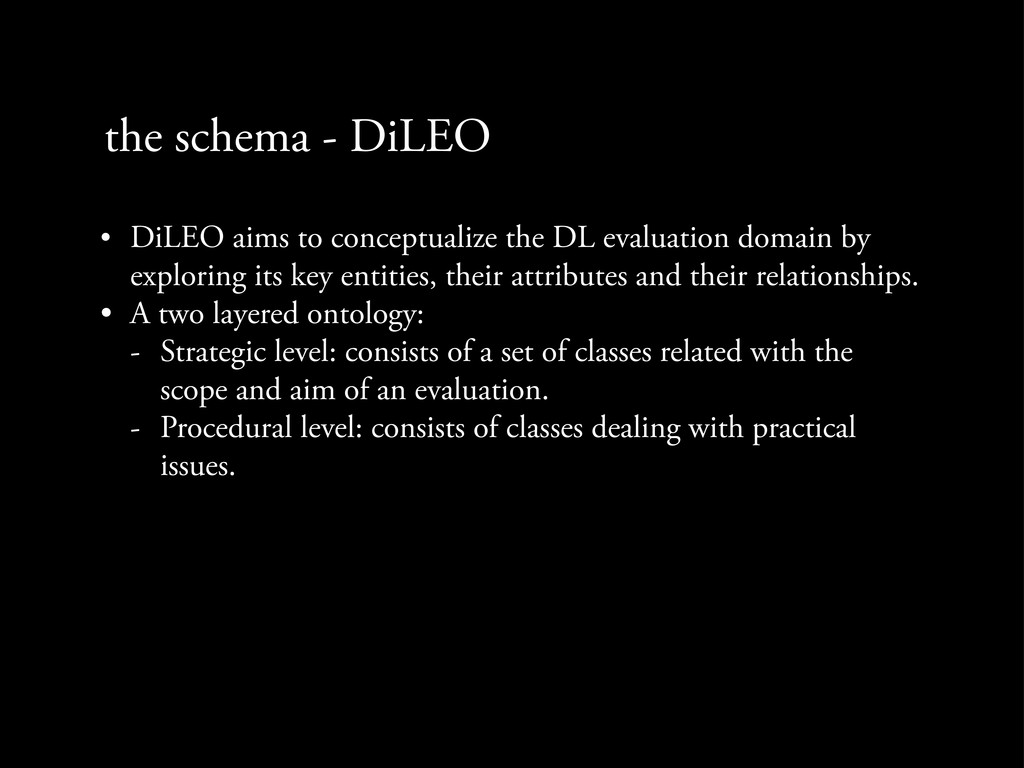
DL evaluation domain by exploring its key entities, their attributes and their relationships. • A two layered ontology: - Strategic level: consists of a set of classes related with the scope and aim of an evaluation.
DL evaluation domain by exploring its key entities, their attributes and their relationships. • A two layered ontology: - Strategic level: consists of a set of classes related with the scope and aim of an evaluation. - Procedural level: consists of classes dealing with practical issues.
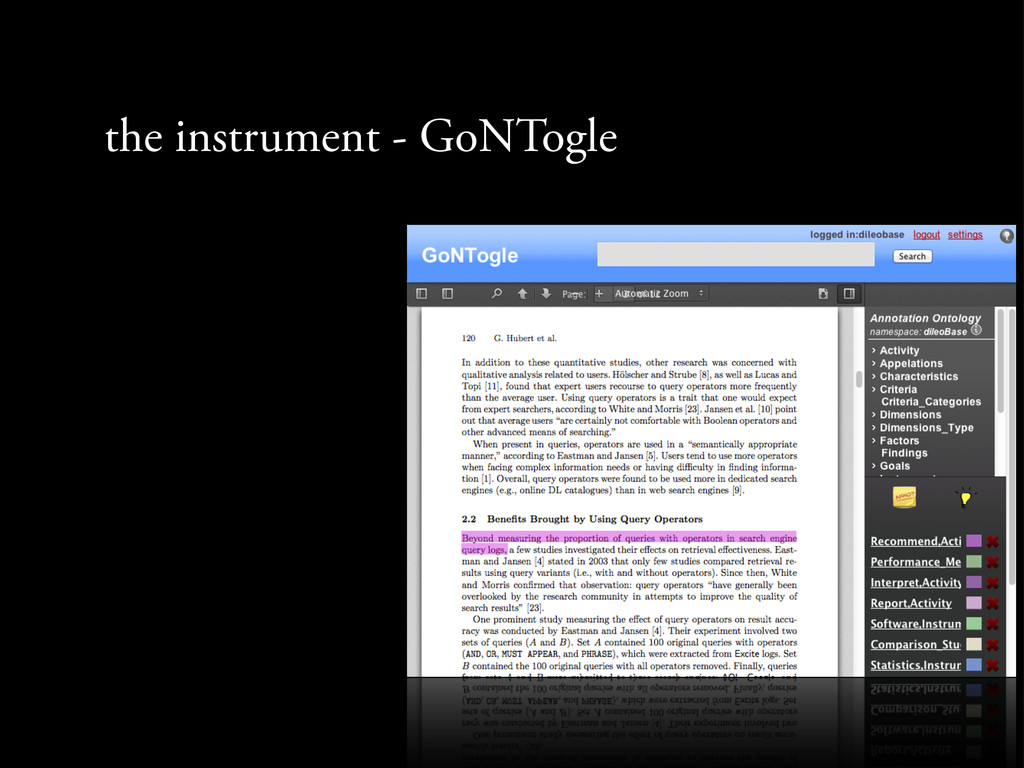
a RDFS knowledge base. • GoNTogle uses the weighted k-NN algorithm to support either manual, or automated ontology- based annotation. • http://bit.ly/12nlryh
each class/subclass, calculating its presence in the k nearest neighbors. • We set a score threshold above which a class is assigned to a new instance (optimal score: 0.18).
each class/subclass, calculating its presence in the k nearest neighbors. • We set a score threshold above which a class is assigned to a new instance (optimal score: 0.18). • e user is presented with a ranked list of the suggested classes/ subclasses and their score ranging from 0 to 1.
each class/subclass, calculating its presence in the k nearest neighbors. • We set a score threshold above which a class is assigned to a new instance (optimal score: 0.18). • e user is presented with a ranked list of the suggested classes/ subclasses and their score ranging from 0 to 1. • 2,672 annotations were manually generated.
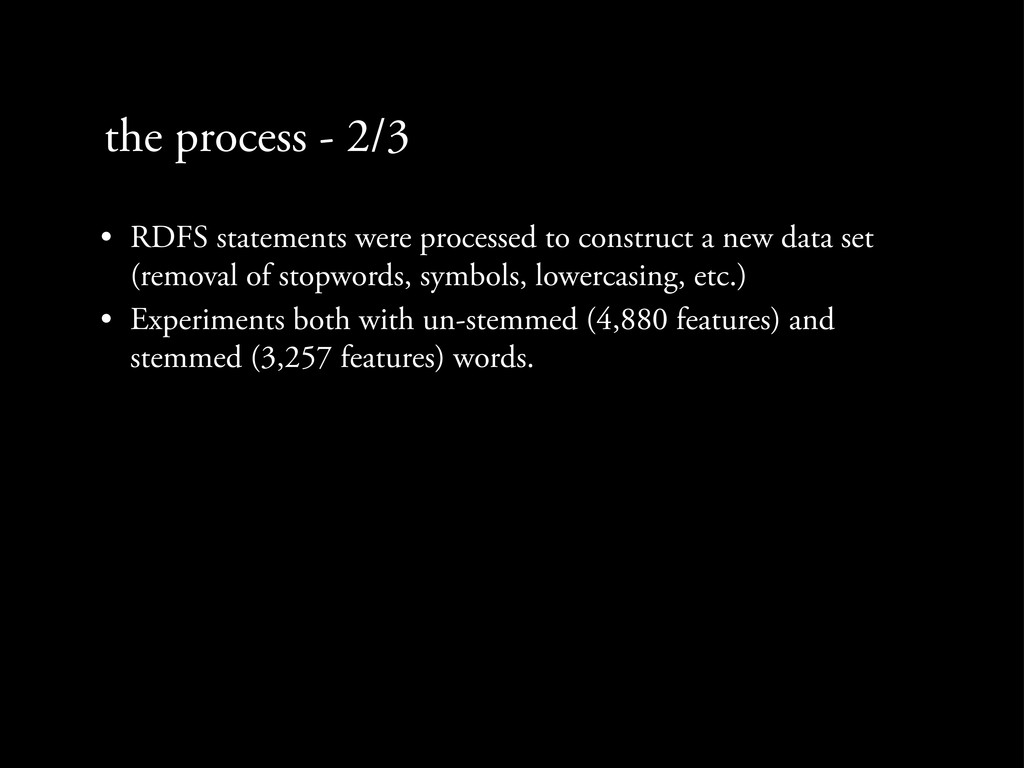
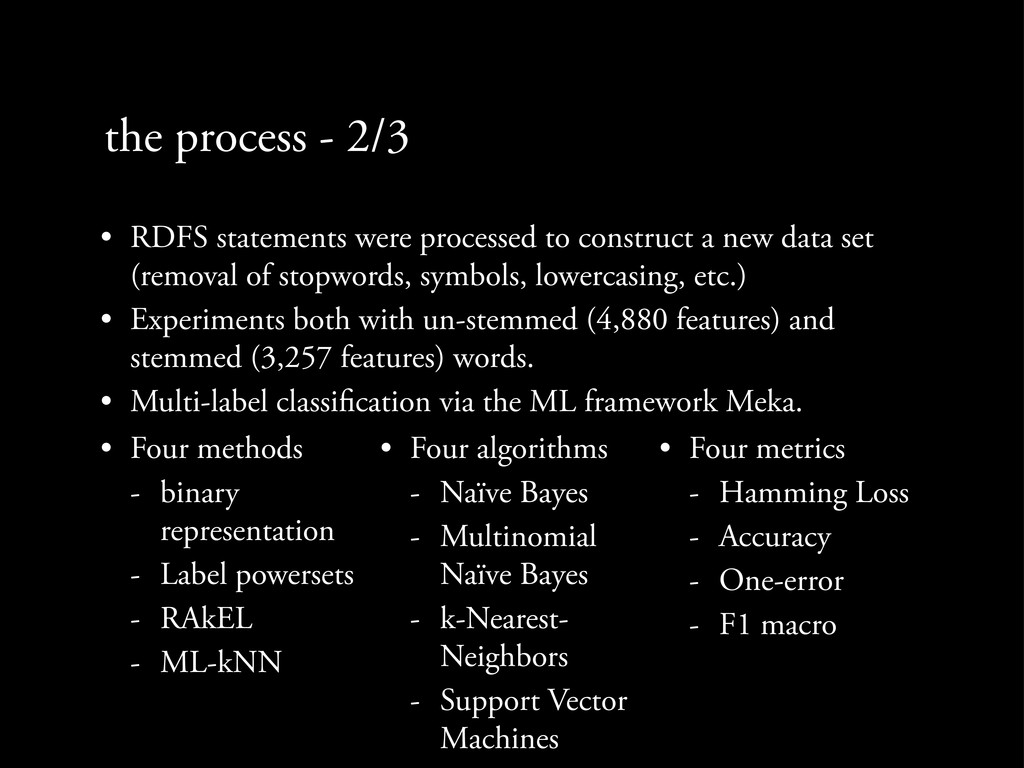
construct a new data set (removal of stopwords, symbols, lowercasing, etc.) • Experiments both with un-stemmed (4,880 features) and stemmed (3,257 features) words.
construct a new data set (removal of stopwords, symbols, lowercasing, etc.) • Experiments both with un-stemmed (4,880 features) and stemmed (3,257 features) words. • Multi-label classi cation via the ML framework Meka.
construct a new data set (removal of stopwords, symbols, lowercasing, etc.) • Experiments both with un-stemmed (4,880 features) and stemmed (3,257 features) words. • Multi-label classi cation via the ML framework Meka. • Four methods - binary representation - Label powersets - RAkEL - ML-kNN • Four algorithms - Naïve Bayes - Multinomial Naïve Bayes - k-Nearest- Neighbors - Support Vector Machines • Four metrics - Hamming Loss - Accuracy - One-error - F1 macro
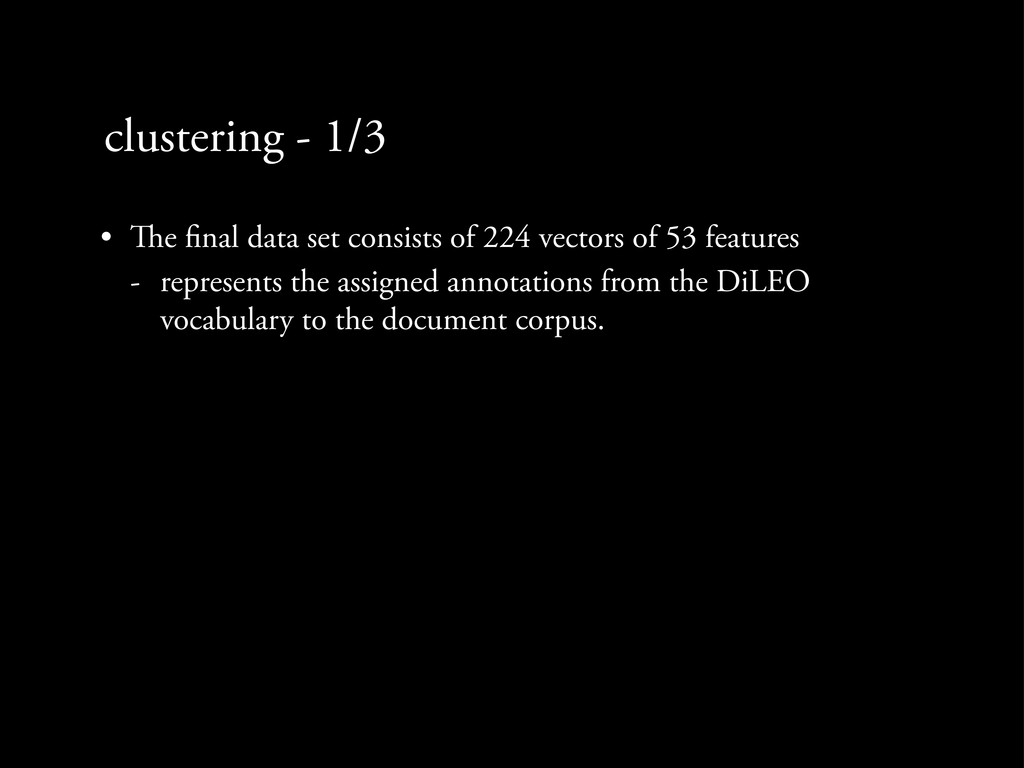
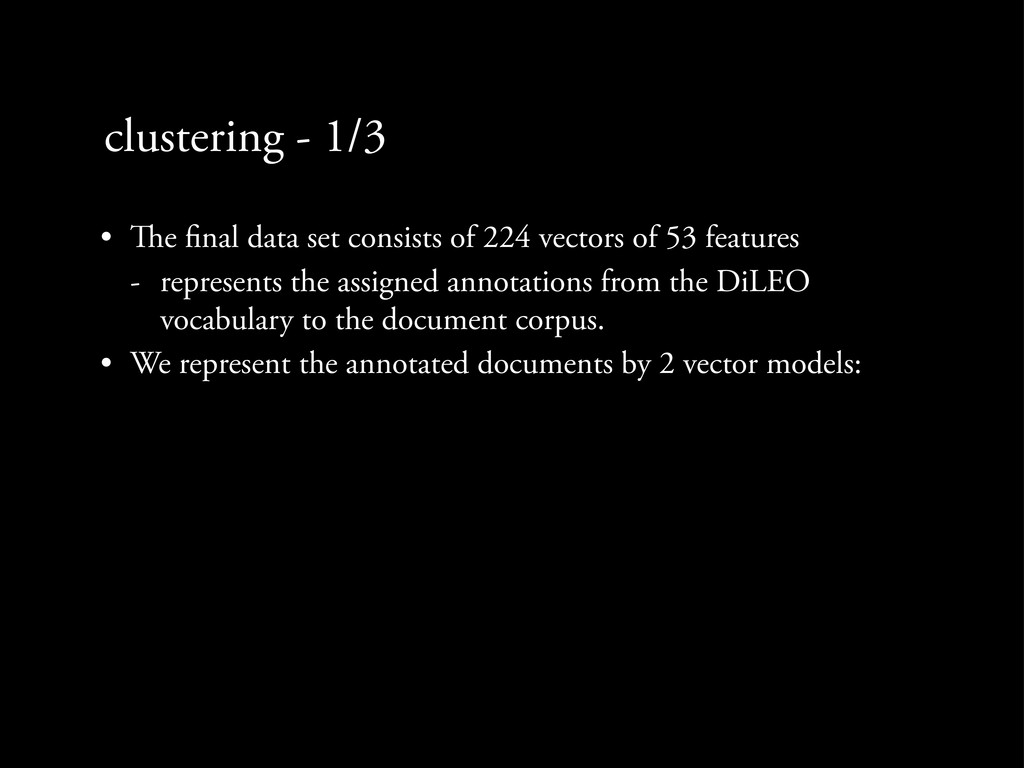
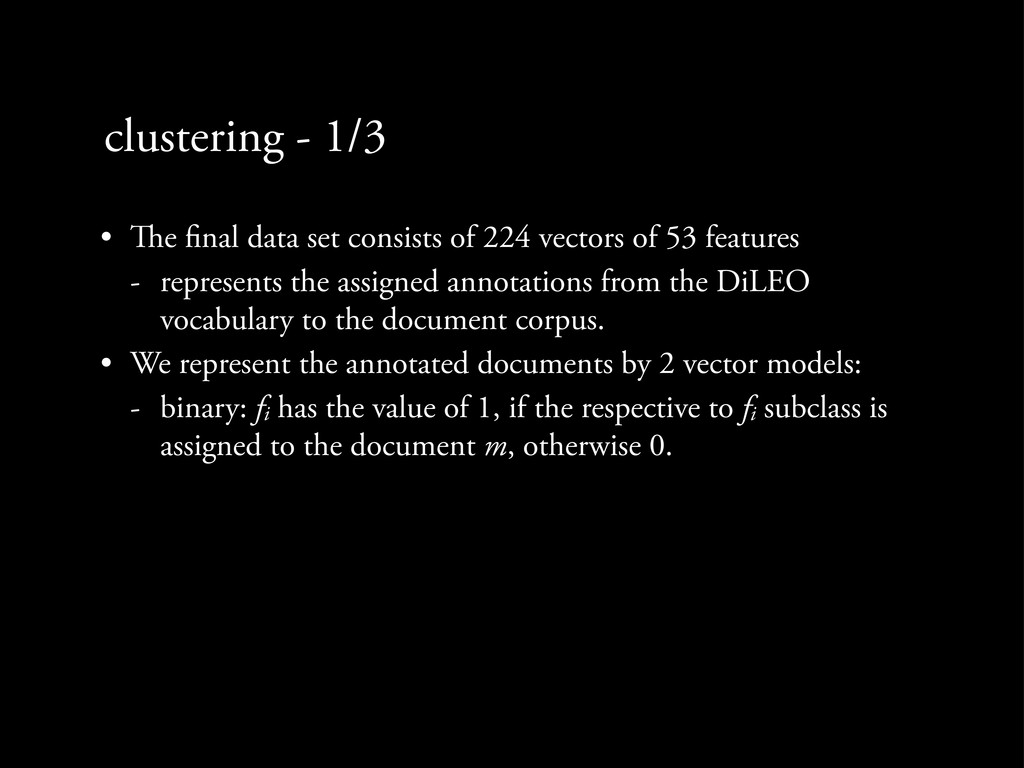
224 vectors of 53 features - represents the assigned annotations from the DiLEO vocabulary to the document corpus. • We represent the annotated documents by 2 vector models:
224 vectors of 53 features - represents the assigned annotations from the DiLEO vocabulary to the document corpus. • We represent the annotated documents by 2 vector models: - binary: fi has the value of 1, if the respective to fi subclass is assigned to the document m, otherwise 0.
224 vectors of 53 features - represents the assigned annotations from the DiLEO vocabulary to the document corpus. • We represent the annotated documents by 2 vector models: - binary: fi has the value of 1, if the respective to fi subclass is assigned to the document m, otherwise 0. - tf-idf: feature frequency ffi of fi in all vectors is equal to 1 when the respective subclass is annotated to the respective document m; idfi is the inverse document frequency of the feature i in documents M.
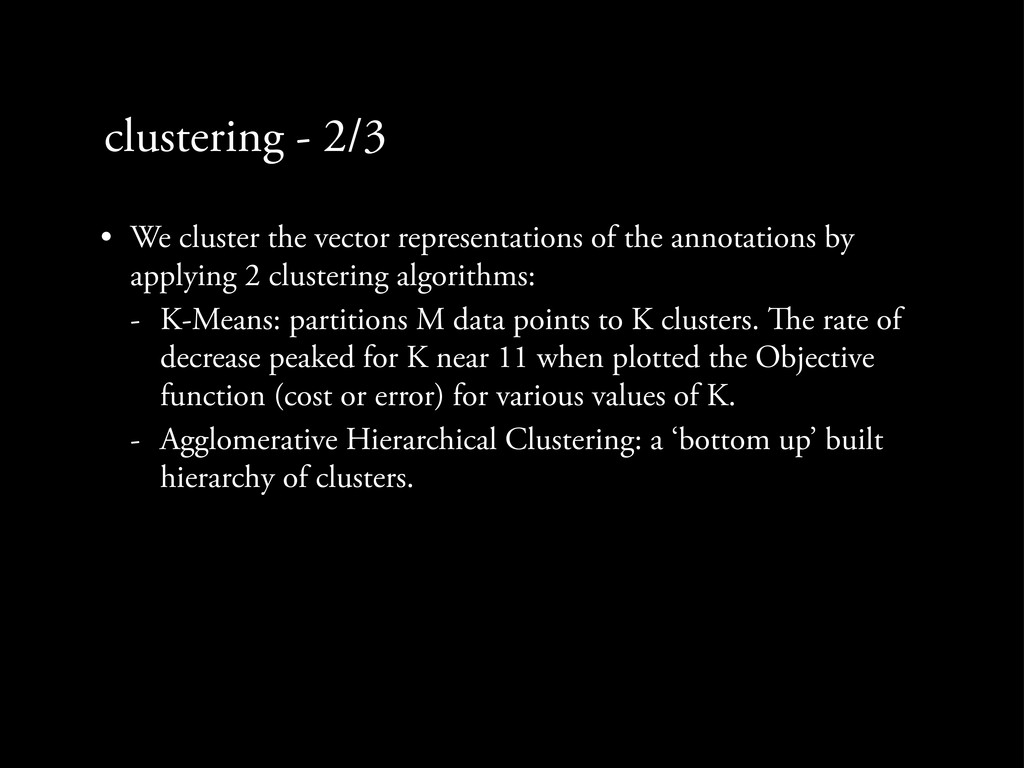
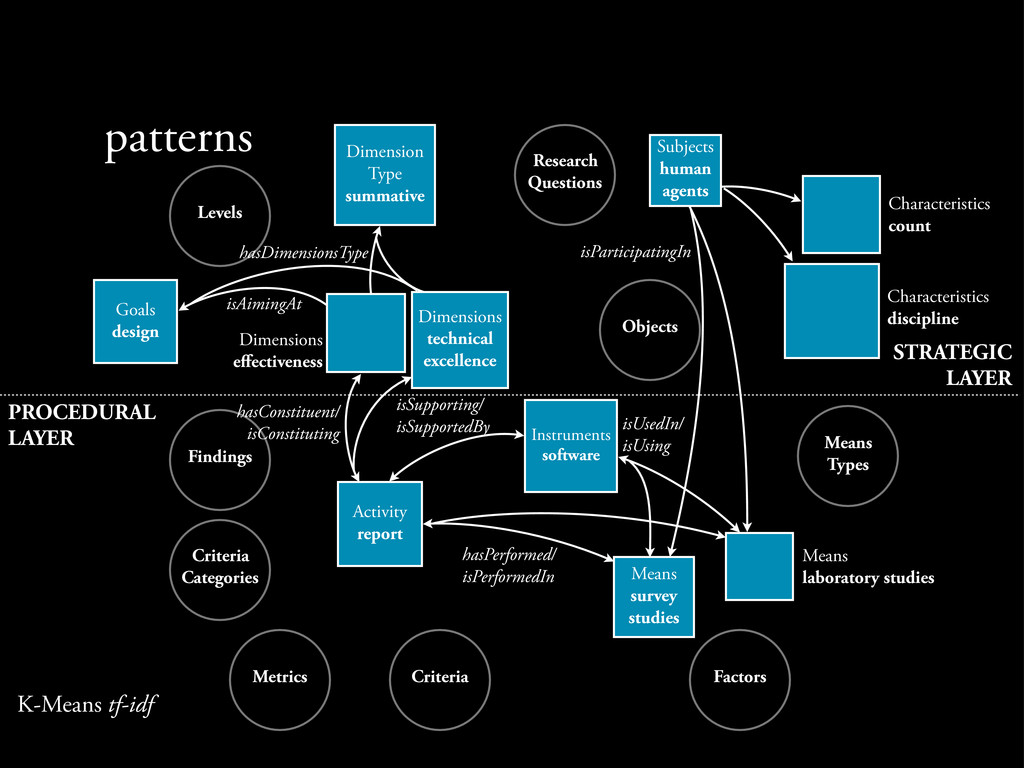
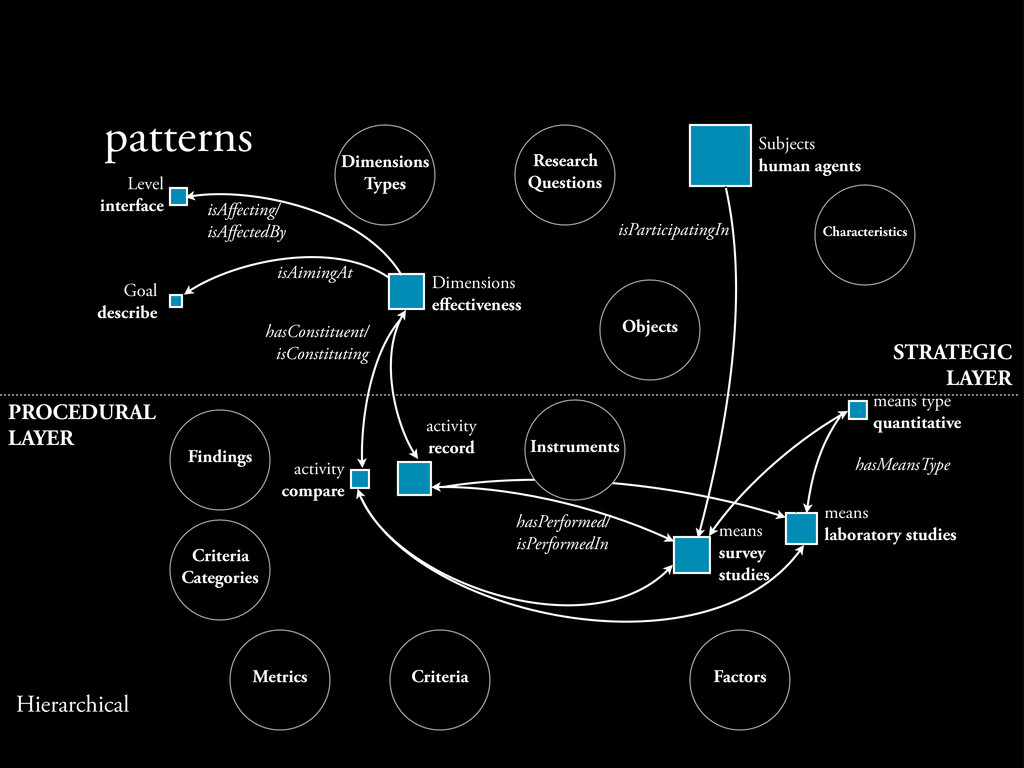
the annotations by applying 2 clustering algorithms: - K-Means: partitions M data points to K clusters. e rate of decrease peaked for K near 11 when plotted the Objective function (cost or error) for various values of K.
the annotations by applying 2 clustering algorithms: - K-Means: partitions M data points to K clusters. e rate of decrease peaked for K near 11 when plotted the Objective function (cost or error) for various values of K. - Agglomerative Hierarchical Clustering: a ‘bottom up’ built hierarchy of clusters.
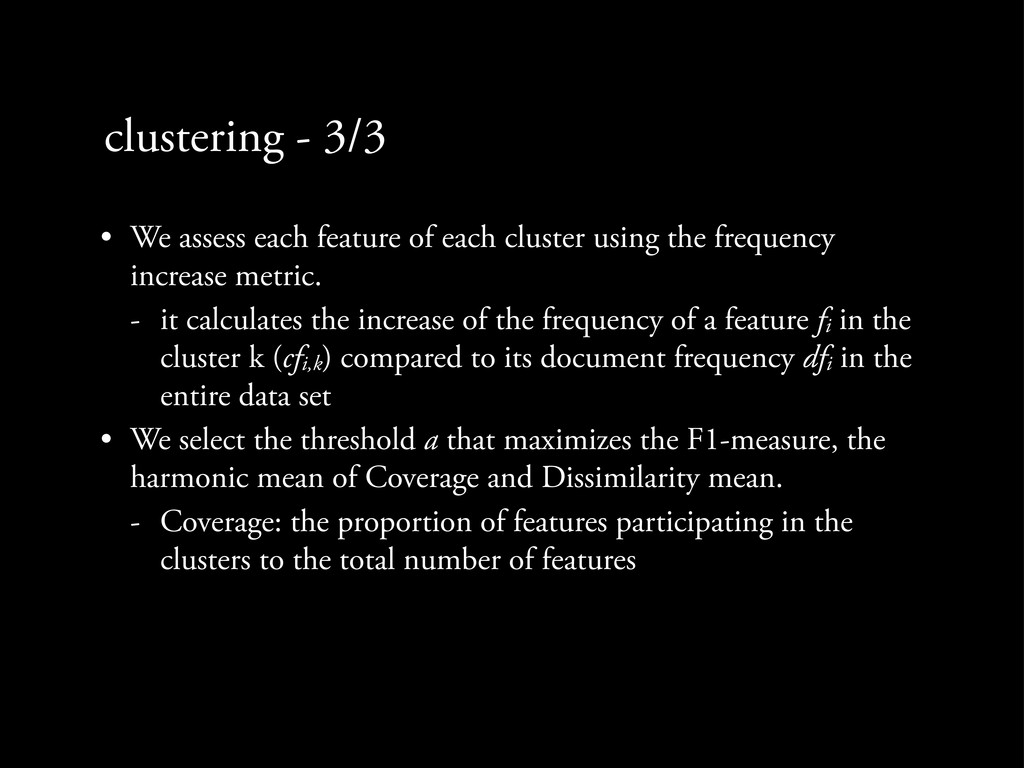
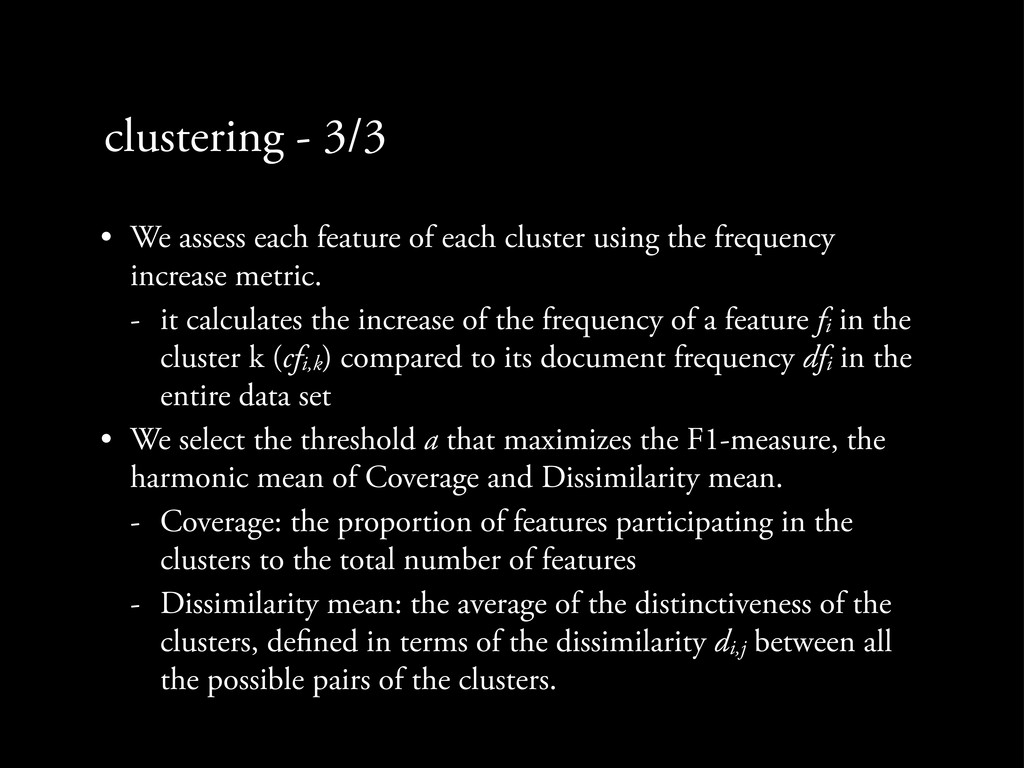
cluster using the frequency increase metric. - it calculates the increase of the frequency of a feature fi in the cluster k (cfi,k) compared to its document frequency dfi in the entire data set
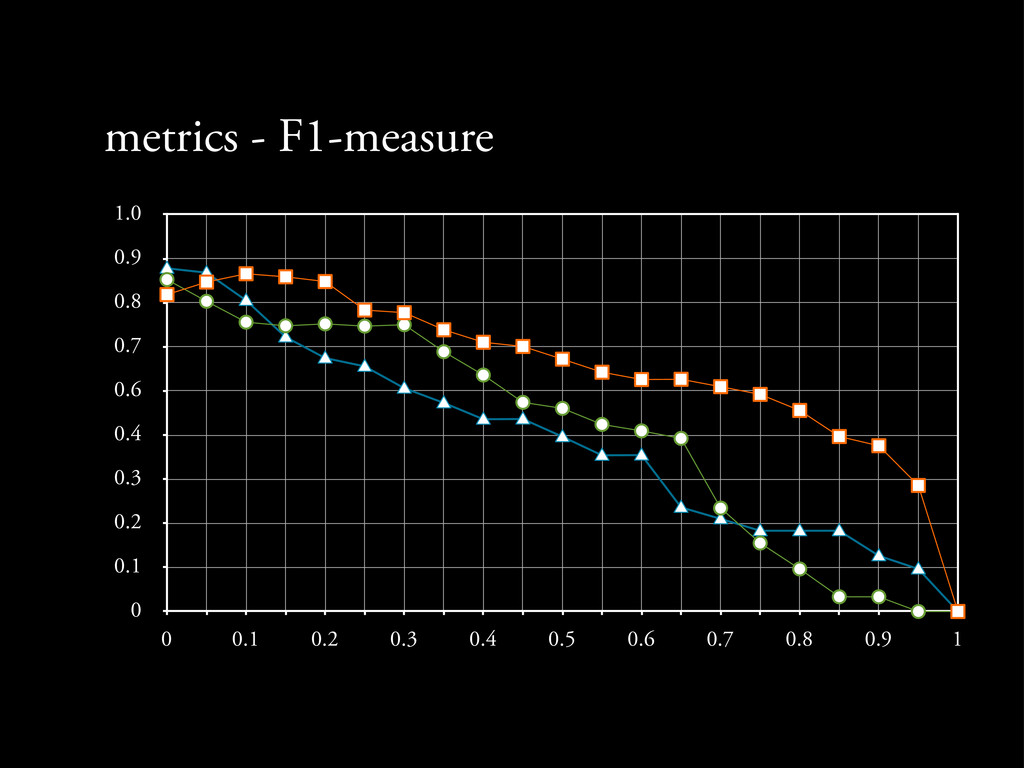
cluster using the frequency increase metric. - it calculates the increase of the frequency of a feature fi in the cluster k (cfi,k) compared to its document frequency dfi in the entire data set • We select the threshold a that maximizes the F1-measure, the harmonic mean of Coverage and Dissimilarity mean.
cluster using the frequency increase metric. - it calculates the increase of the frequency of a feature fi in the cluster k (cfi,k) compared to its document frequency dfi in the entire data set • We select the threshold a that maximizes the F1-measure, the harmonic mean of Coverage and Dissimilarity mean. - Coverage: the proportion of features participating in the clusters to the total number of features
cluster using the frequency increase metric. - it calculates the increase of the frequency of a feature fi in the cluster k (cfi,k) compared to its document frequency dfi in the entire data set • We select the threshold a that maximizes the F1-measure, the harmonic mean of Coverage and Dissimilarity mean. - Coverage: the proportion of features participating in the clusters to the total number of features - Dissimilarity mean: the average of the distinctiveness of the clusters, de ned in terms of the dissimilarity di,j between all the possible pairs of the clusters.
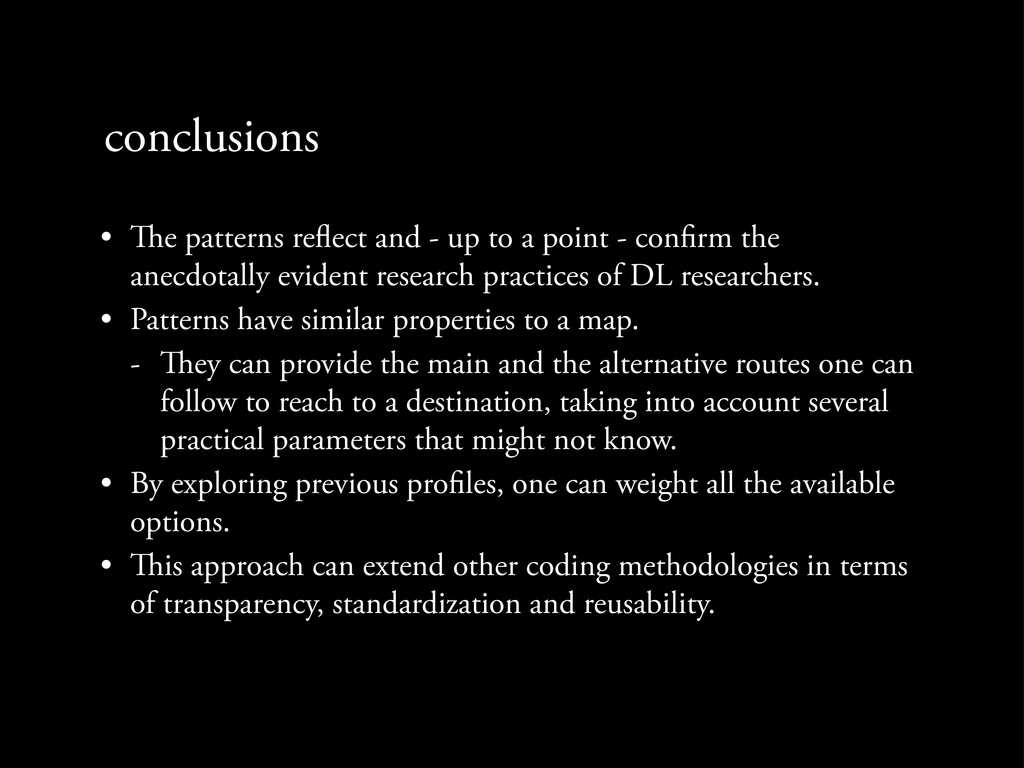
a point - con rm the anecdotally evident research practices of DL researchers. • Patterns have similar properties to a map. - ey can provide the main and the alternative routes one can follow to reach to a destination, taking into account several practical parameters that might not know.
a point - con rm the anecdotally evident research practices of DL researchers. • Patterns have similar properties to a map. - ey can provide the main and the alternative routes one can follow to reach to a destination, taking into account several practical parameters that might not know. • By exploring previous pro les, one can weight all the available options.
a point - con rm the anecdotally evident research practices of DL researchers. • Patterns have similar properties to a map. - ey can provide the main and the alternative routes one can follow to reach to a destination, taking into account several practical parameters that might not know. • By exploring previous pro les, one can weight all the available options. • is approach can extend other coding methodologies in terms of transparency, standardization and reusability.