Upgrade to Pro — share decks privately, control downloads, hide ads and more …

[ICLR'24] Towards Assessing and Benchmarking Risk-Return Tradeoff of OPE

Haruka Kiyohara
December 01, 2023

[ICLR'24] Towards Assessing and Benchmarking Risk-Return Tradeoff of OPE

Haruka Kiyohara

December 01, 2023
Tweet

More Decks by Haruka Kiyohara

Other Decks in Research

Transcript

  1. Towards Assessing and Benchmarking Risk-Return Tradeoff of Off-Policy Evaluation Haruka

    Kiyohara, Ren Kishimoto, Kosuke Kawakami, Ken Kobayashi, Kazuhide Nakata, Yuta Saito Haruka Kiyohara https://sites.google.com/view/harukakiyohara May 2024 Towards assessing risk-return tradeoff of OPE 1
  2. Real-world sequential decision making Example of sequential decision-making in healthcare

    We aim to optimize such decisions as a Reinforcement Learning (RL) problem. May 2024 Towards assessing risk-return tradeoff of OPE 2 Other applications include.. • Robotics • Education • Recommender systems • … Sequential decision-making is everywhere!
  3. Online and Offline Reinforcement Learning (RL) • Online RL –

    • learns a policy through interaction • may harm the real system with bad action choices • Offline RL – • learns and evaluate a policy solely from offline data • can be a safe alternative for online RL May 2024 Towards assessing risk-return tradeoff of OPE 3 Particularly focusing on Off-Policy Evaluation (OPE)
  4. Why is Off-Policy Evaluation (OPE) important? The performance of production

    policy heavily depends on the policy selection. May 2024 Towards assessing risk-return tradeoff of OPE 4 Off-Policy Evaluation (OPE) evaluates the performance of new policies using logged data, and is used for policy selection. (various hyperparams.) (various algorithms)
  5. Content • Introduction to Off-Policy Evaluation (OPE) of RL policies

    • Issues of the existing metrics of OPE • Our proposal: Evaluating the risk-return tradeoff of OPE via SharpeRatio@k • Case Study: Why should we use SharpeRatio@k? May 2024 Towards assessing risk-return tradeoff of OPE 5
  6. Preliminary: Markov Decision Process (MDP) May 2024 Towards assessing risk-return

    tradeoff of OPE 7 MDP is defined as . • : state • : action • : reward • : timestep • : state transition • : reward function • : discount ▼ our interest
  7. Estimation Target of OPE We aim to estimate the expected

    trajectory-wise reward (i.e., policy value): May 2024 Towards assessing risk-return tradeoff of OPE 8 OPE estimator logged data collected by a past (behavior) policy counterfactuals & distribution shift
  8. Example of OPE Estimators We will briefly review the following

    OPE estimators. • Direct Method (DM) • (Per-Decision) Importance Sampling (PDIS) • Doubly Robust (DR) • (State-action) Marginal Importance Sampling (MIS) • (State-action) Marginal Doubly Robust (MDR) May 2024 Towards assessing risk-return tradeoff of OPE 9 Note: we describe DR and MDR in detail in Appendix.
  9. Direct Method (DM) [Le+,19] DM trains a value predictor and

    estimates the policy value from the prediction. Pros: variance is small. Cons: bias can be large when ! 𝑄 is inaccurate. May 2024 Towards assessing risk-return tradeoff of OPE 10 value prediction estimating expected reward at future timesteps empirical average (𝑛 is the data size and 𝑖 is the index)
  10. Per-Decision Importance Sampling (PDIS) [Precup+,00] PDIS applies importance sampling to

    correct the distribution shift. Pros: unbiased (under the common support assumption: ). Cons: variance can be exponentially large as 𝑡 grows. May 2024 Towards assessing risk-return tradeoff of OPE 11 importance weight = product of step-wise iimportance weights
  11. State-action Marginal IS (MIS) [Uehara+,20] To alleviate variance, MIS considers

    IS on the (state-action) marginal distribution. Pros: unbiased when $ 𝜌 is correct and reduces variance compared to PDIS. Cons: accurate estimation of $ 𝜌 is often challenging, resulting in some bias. May 2024 Towards assessing risk-return tradeoff of OPE 12 (estimated) marginal importance weight state-action visitation probability
  12. Summary of OPE • Off-Policy Evaluation (OPE) aims to evaluate

    the expected performance of a policy using only offline logged data. • However, counterfactual estimation and distribution shift between 𝜋 and 𝜋𝑏 causes either bias or variance issues. In the following, we discuss.. “How to assess OPE estimators for a reliable policy selection in practice?” May 2024 Towards assessing risk-return tradeoff of OPE 13
  13. Summary of OPE • Off-Policy Evaluation (OPE) aims to evaluate

    the expected performance of a policy using only offline logged data. • However, counterfactual estimation and distribution shift between 𝜋 and 𝜋𝑏 causes either bias or variance issues. In the following, we discuss.. “How to assess OPE estimators for a reliable policy selection in practice?” May 2024 Towards assessing risk-return tradeoff of OPE 14 We discuss the RL settings, but the same idea is applicable to contextual bandits as well.
  14. Issues of the existing metrics of OPE May 2024 Towards

    assessing risk-return tradeoff of OPE 15
  15. Conventional metrics focus on “accuracy” There are three metrics used

    to assess the accuracy of OPE and policy selection. • Mean squared error (MSE) – “accuracy” of policy evaluation • Rank correlation (RankCorr) – “accuracy” of policy alignment • Regret – “accuracy” of policy selection May 2024 Towards assessing risk-return tradeoff of OPE 16
  16. Conventional metrics focus on “accuracy” There are three metrics used

    to assess the accuracy of OPE and policy selection. • Mean squared error (MSE) – “accuracy” of policy evaluation [Voloshin+,21] May 2024 Towards assessing risk-return tradeoff of OPE 17 estimation true value
  17. Conventional metrics focus on “accuracy” There are three metrics used

    to assess the accuracy of OPE and policy selection. • Rank correlation (RankCorr) – “accuracy” of policy alignment [Fu+,21] May 2024 Towards assessing risk-return tradeoff of OPE 18 1 2 3 4 5 6 7 estimation true ranking
  18. Conventional metrics focus on “accuracy” There are three metrics used

    to assess the accuracy of OPE and policy selection. • Regret – “accuracy” of policy selection [Doroudi+,18] May 2024 Towards assessing risk-return tradeoff of OPE 19 performance of the true best policy performance of the estimated best policy
  19. Existing metrics are suitable for the top-1 selection Three metrics

    can assess how likely an OPE estimator chooses a near-best policy. May 2024 Towards assessing risk-return tradeoff of OPE 20 directly chooses the production policy via OPE low MSE high RankCorr low Regret near-best production policy ? ✔ ✔ assessment of OPE
  20. Existing metrics are suitable for the top-1 selection Three metrics

    can assess how likely an OPE estimator chooses a near-best policy. .. but in practice, we cannot sorely rely on the OPE result. May 2024 Towards assessing risk-return tradeoff of OPE 21 directly chooses the production policy via OPE low MSE high RankCorr low Regret near-best production policy ? ✔ ✔ assessment of OPE
  21. Research question: How to assess the top-𝑘 selection? We consider

    the following two-stage policy selection for practical application: May 2024 Towards assessing risk-return tradeoff of OPE 22 OPE as a screening process combine A/B test results for policy selection ・Are existing metrics enough to assess the top-𝑘 policy selection? ・How should we assess OPE estimators accounting safety during A/B tests? …
  22. Existing metrics fail to distinguish two estimators (1/2) Three existing

    metrics report almost the same values for the estimators X and Y. Existing metrics fail to distinguish underestimation vs. overestimation. May 2024 Towards assessing risk-return tradeoff of OPE 23 estimator X estimator Y MSE 11.3 11.3 RankCorr 0.413 0.413 Regret 0.0 0.0 Top-3 policy portfolio is very different from each other.
  23. Existing metrics fail to distinguish two estimators (2/2) Three existing

    metrics report almost the same values for the estimators W and Z. Existing metrics fail to distinguish conservative vs. high-stakes. May 2024 Towards assessing risk-return tradeoff of OPE 24 estimator W estimator Z MSE 60.1 58.6 RankCorr 0.079 0.023 Regret 9.0 9.0 estimator Z is uniform random and thus is riskier.
  24. Summary of the existing metrics • Existing metrics focus on

    “accuracy” of OPE or the downstream policy selection. • However, they are not quite suitable for the practical top-𝑘 policy selection. • Existing metrics cannot take the risk of deploying poor policies into account. • Existing metrics fail to distinguish very different OPE estimators: • (overestimation vs. underestimation) and (conservative vs. high-stakes) How to assess OPE estimators for the top-𝒌 policy selection? May 2024 Towards assessing risk-return tradeoff of OPE 25
  25. Our proposal: Evaluating the risk-return tradeoff of OPE via SharpeRatio@k

    May 2024 Towards assessing risk-return tradeoff of OPE 26
  26. What is the desirable property of the top-𝑘 metric? Existing

    metrics did not consider: the risk of deploying poor performing policies in online A/B tests A new metric should tell: whether an OPE estimator is efficient wrt the risk-return tradeoff May 2024 Towards assessing risk-return tradeoff of OPE 27 + after the A/B test + during the A/B test risk and safety performance of the chosen policy What matters?
  27. Proposed metric: SharpeRatio@k Inspired by the portfolio management in finance,

    we define SharpeRatio in OPE. May 2024 Towards assessing risk-return tradeoff of OPE 28 The best policy performance among the top-𝑘 policies. Standard deviation among the top-𝑘 policies.
  28. Proposed metric: SharpeRatio@k Inspired by the portfolio management in finance,

    we define SharpeRatio in OPE. May 2024 Towards assessing risk-return tradeoff of OPE 29 measures the return over the risk-free baseline. measures the risk experienced during online A/B tests.
  29. Example: Calculating SharpeRatio@3 Let’s consider the case of performing top-3

    policy selection. May 2024 Towards assessing risk-return tradeoff of OPE 30 policy value estimated by OPE true value of the policy behavior 𝜋𝑏 - 1.0 candidate 1 1.8 ? candidate 2 1.2 ? candidate 3 1.0 ? candidate 4 0.8 ? candidate 5 0.5 ?
  30. Example: Calculating SharpeRatio@3 Let’s consider the case of performing top-3

    policy selection. May 2024 Towards assessing risk-return tradeoff of OPE 31 policy value estimated by OPE true value of the policy behavior 𝜋𝑏 - 1.0 candidate 1 1.8 ? candidate 2 1.2 ? candidate 3 1.0 ? candidate 4 0.8 ? candidate 5 0.5 ? A/B test
  31. Example: Calculating SharpeRatio@3 Let’s consider the case of performing top-3

    policy selection. May 2024 Towards assessing risk-return tradeoff of OPE 32 policy value estimated by OPE true value of the policy behavior 𝜋𝑏 - 1.0 candidate 1 1.8 2.0 candidate 2 1.2 0.5 candidate 3 1.0 1.2 candidate 4 0.8 ? candidate 5 0.5 ? denominator = best@𝑘 - 𝐽(𝜋𝑏 ) = 2.0 ‒ 1.0 = 1.0
  32. Let’s consider the case of performing top-3 policy selection. Example:

    Calculating SharpeRatio@3 May 2024 Towards assessing risk-return tradeoff of OPE 33 policy value estimated by OPE true value of the policy behavior 𝜋𝑏 - 1.0 candidate 1 1.8 2.0 candidate 2 1.2 0.5 candidate 3 1.0 1.2 candidate 4 0.8 ? candidate 5 0.5 ? numerator = std@𝑘 = 1/𝑘 ∑#$% & 𝐽 𝜋𝑖 − mean@𝑘 2 = 0.75 denominator = best@𝑘 - 𝐽(𝜋𝑏 ) = 2.0 ‒ 1.0 = 1.0
  33. Let’s consider the case of performing top-3 policy selection. Example:

    Calculating SharpeRatio@3 May 2024 Towards assessing risk-return tradeoff of OPE 34 policy value estimated by OPE true value of the policy behavior 𝜋𝑏 - 1.0 candidate 1 1.8 2.0 candidate 2 1.2 0.5 candidate 3 1.0 1.2 candidate 4 0.8 ? candidate 5 0.5 ? numerator = std@𝑘 = 1/𝑘 ∑#$% & 𝐽 𝜋𝑖 − mean@𝑘 2 = 0.75 denominator = best@𝑘 - 𝐽(𝜋𝑏 ) = 2.0 ‒ 1.0 = 1.0 SharpeRatio = 1.0 / 0.75 = 1.33..
  34. Let’s consider the case of performing top-3 policy selection. Example:

    Calculating SharpeRatio@3 May 2024 Towards assessing risk-return tradeoff of OPE 35 SharpeRatio = 1.33.. policy value estimated by OPE true value of the policy behavior 𝜋𝑏 - 1.0 candidate 1 1.8 2.0 candidate 2 0.8 ? candidate 3 1.0 1.2 candidate 4 1.2 1.0 candidate 5 0.5 ? policy value estimated by OPE true value of the policy behavior 𝜋𝑏 - 1.0 candidate 1 1.8 2.0 candidate 2 1.2 0.5 candidate 3 1.0 1.2 candidate 4 0.8 ? candidate 5 0.5 ? SharpeRatio = 1.92..
  35. Let’s consider the case of performing top-3 policy selection. Example:

    Calculating SharpeRatio@3 May 2024 Towards assessing risk-return tradeoff of OPE 36 SharpeRatio = 1.33.. policy value estimated by OPE true value of the policy behavior 𝜋𝑏 - 1.0 candidate 1 1.8 2.0 candidate 2 0.8 ? candidate 3 1.0 1.2 candidate 4 1.2 1.0 candidate 5 0.5 ? policy value estimated by OPE true value of the policy behavior 𝜋𝑏 - 1.0 candidate 1 1.8 2.0 candidate 2 1.2 0.5 candidate 3 1.0 1.2 candidate 4 0.8 ? candidate 5 0.5 ? SharpeRatio = 1.92.. Lower risk of deploying detrimental policies!
  36. SharpeRatio enables informative assessments (1/2) Let’s compare the case where

    the existing metrics failed to distinguish the two. Can SharpeRatio tell the difference in underestimation vs. overestimation? May 2024 Towards assessing risk-return tradeoff of OPE 38 estimator X estimator Y MSE 11.3 11.3 RankCorr 0.413 0.413 Regret 0.0 0.0 Top-3 policy portfolio is very different from each other.
  37. SharpeRatio enables informative assessments (1/2) Let’s compare the case where

    the existing metrics failed to distinguish the two. SharpeRatio values the safer estimator more than the riskier estimator. May 2024 Towards assessing risk-return tradeoff of OPE 39
  38. SharpeRatio enables informative assessments (2/2) Three existing metrics reports almost

    the same values for the estimators W and Z. Can SharpeRatio tell the difference in conservative vs. high-stakes? May 2024 Towards assessing risk-return tradeoff of OPE 40 estimator W estimator Z MSE 60.1 58.6 RankCorr 0.079 0.023 Regret 9.0 9.0 estimator Z is uniform random and thus is riskier.
  39. SharpeRatio enables informative assessments (1/2) Let’s compare the case where

    the existing metrics failed to distinguish the two. SharpeRatio identiAes ef/cient estimator taking the problem instance into account. May 2024 Towards assessing risk-return tradeoff of OPE 41 (i.e., performance of the behavior policy) baseline is high baseline is low Conservative does not deploy poor-performing policies. High-stakes potentially improves the baseline.
  40. Experiments with gym Interestingly, SharpeRatio and existing metrics report very

    different results. May 2024 Towards assessing risk-return tradeoff of OPE 42 SharpeRatio values PDIS for k=2,..,4, while values DM for k=6,..,11. MSE and Regret values MIS, RankCorr evaluates DM highly. RankCorr also evaluates PDIS higher than MDR. Note: we use self-normalized variants of OPE estimators.
  41. Experiments with gym (analysis) SharpeRatio automatically considers the risk of

    deploying poor policies! May 2024 Towards assessing risk-return tradeoff of OPE 43 • MSE and Regret chooses MIS, which deploys a detrimental policy with small values of 𝑘. • RankCorr chooses a relatively safe one (DM), but evaluates riskier PDIS higher than MDR for 𝑘 ≥ 5. • SharpeRatio detects unsafe behaviors by discounting the return by the risk (std).
  42. Summary • OPE is often used for screening top-𝒌 policies

    deployed in online A/B tests. • The proposed SharpeRatio metric measures the ef`ciency of OPE estimator wrt the risk-return tradeoff. • In particular, SharpeRatio can identify a safe OPE estimator over a risky counterpart, while also telling an ef`cient OPE estimator taking the problem instance into account. SharpeRatio is an informative assessment metric to compare OPE estimators. May 2024 Towards assessing risk-return tradeoff of OPE 44
  43. SharpeRatio is available at the SCOPE-RL package! SharpeRatio is implemented

    SCOPE-RL and can be used with a few lines of code. May 2024 Towards assessing risk-return tradeoff of OPE 45 Install now!! GitHub documentation
  44. Corresponding papers 1. “Towards Assessing and Benchmarking the Risk-Return Tradeoff

    of Off-Policy Evaluation.” arXiv preprint, 2023. https://arxiv.org/abs/2311.18207 2. “SCOPE-RL: A Python Library for Offline Reinforcement Learning and Off-Policy Evaluation.” arXiv preprint, 2023. https://arxiv.org/abs/2311.18206 May 2024 Towards assessing risk-return tradeoff of OPE 47
  45. Connection to the Sharpe ratio [Sharpe,98] in finance In finance,

    an investment is preferable if it is low-risk and high-return. May 2024 Towards assessing risk-return tradeoff of OPE 49 asset price time time purchase period end period end purchase return return return is not very high, but can be gained steady return is high, but the investment is high-stakes asset price
  46. Connection to the Sharpe ratio [Sharpe,98] in finance In finance,

    an investment is preferable if it is low-risk and high-return. Sharpe ratio = (increase of asset price) / (deviation of asset price during the period) = ( end price – purchase price ) / (std. of asset price) To improve Sharpe ratio, we often invest on multiple assets and form a portfolio. May 2024 Towards assessing risk-return tradeoff of OPE 50
  47. Connection to the Sharpe ratio [Sharpe,98] in Vnance In finance,

    an investment is preferable if it is low-risk and high-return. Sharpe ratio = (increase of asset price) / (deviation of asset price during the period) = ( end price – purchase price ) / (std. of asset price) To improve Sharpe ratio, we often invest on multiple assets and form a portfolio. We see the top-𝑘 policies selected by an OPE estimator as its policy portfolio. May 2024 Towards assessing risk-return tradeoff of OPE 51 applying the idea
  48. Connection to the Sharpe ratio [Sharpe,98] in finance In finance,

    an investment is preferable if it is low-risk and high-return. Sharpe ratio = (increase of asset price) / (deviation of asset price during the period) = ( end price – purchase price ) / (std. of asset price) SharpeRatio = (increase of policy value (pv) by A/B test) / (deviation during A/B test) = ( pv of the policy chosen by A/B test – pv of behavior policy) / (std. of pv of top-𝑘) We see the top-𝑘 policies selected by an OPE estimator as its policy portfolio. May 2024 Towards assessing risk-return tradeoff of OPE 52
  49. Comparison of SharpeRatio and existing metrics May 2024 Towards assessing

    risk-return tradeoff of OPE 53 SharpeRatio does not always align with the existing metrics. (because SharpeRatio is the only metric taking the risk into account)
  50. Definitions of the (normalized) baseline metrics For MSE and Regret,

    we report the following normalized values. May 2024 Towards assessing risk-return tradeoff of OPE 54
  51. Experimental setting • We use MountainCar from Gym-ClassicControl [Brockman+,16]. •

    Behavior policy is a softmax policy based on Q-function learned by DDQN [Hasselt+,16]. • Candidate policies are 𝜀-greedy policies with various values of 𝜀 and base models trained by CQL [Kumar+,20] and BCQ [Fujimoto+,19]. • For OPE, we use FQE [Le+,19] to train ' 𝑄 and BestDICE [Yang+,20] to train ) 𝜌. • We also use self-normalized estimators [Kallus&Uehara,19] to alleviate the variance issue. • We use the implementation of DDQN, CQL, BCQ, and FQE provided in d3rlpy [Seno&Imai,22]. May 2024 Towards assessing risk-return tradeoff of OPE 55 See our paper for the details.
  52. High-level understanding of importance sampling May 2024 Towards assessing risk-return

    tradeoff of OPE 56 The target policy chooses action A more, but the dataset contains action B more. evaluation logging action A action B more less less more
  53. High-level understanding of importance sampling May 2024 Towards assessing risk-return

    tradeoff of OPE 57 importance weight virtually increases action A The target policy chooses action A more, but the dataset contains action B more. evaluation logging action A action B more less less more
  54. High-level understanding of importance sampling May 2024 Towards assessing risk-return

    tradeoff of OPE 58 but can have a high variance when importance weight is large The target policy chooses action A more, but the dataset contains action B more. evaluation logging ranking A more less
  55. Doubly Robust (DR) [Jiang&Li,16] [Thomas&Brunskill,16] DR is a hydrid of

    DM and IPS, which apply importance sampling only on the residual. May 2024 Towards assessing risk-return tradeoff of OPE 59 (recursive form) importance weight is multiplied on the residual value after timestep 𝒕
  56. Doubly Robust (DR) [Jiang&Li,16] [Thomas&Brunskill,16] DR is a hydrid of

    DM and IPS, which apply importance sampling only on the residual. Pros: unbiased and often reduce variance compared to PDIS. Cons: can still suffer from high variance when 𝑡 is large. May 2024 Towards assessing risk-return tradeoff of OPE 60
  57. State-action Marginal DR (SAM-DR) [Uehara+,20] SAM-DR is a DR variant

    that leverages the (state-action) marginal distribution. Pros: unbiased when $ 𝜌 or ! 𝑄 is accurate and reduces variance compared to DR. Cons: accurate estimation of $ 𝜌 is often challenging, resulting in some bias. May 2024 Towards assessing risk-return tradeoff of OPE 61 marginal importance weight is multiplied on the residual
  58. Self-normalized estimators [Kallus&Uehara,19] Self-normalized estimators alleviate variance by modifying the

    importance weight. Self-normalized estimators are no longer unbiased, but remains consistent. May 2024 Towards assessing risk-return tradeoff of OPE 62
  59. Self-normalized estimators [Kallus&Uehara,19] Self-normalized estimators alleviate variance by modifying the

    importance weight. May 2024 Towards assessing risk-return tradeoff of OPE 63
  60. References (1/4) [Le+,19] Hoang M. Le, Cameron Voloshin, Yisong Yue.

    “Batch Policy Learning under Constraints.” ICML, 2019. https://arxiv.org/abs/1903.08738 [Precup+,00] Doina Precup, Richard S. Sutton, Satinder Singh. “Eligibility Traces for Off-Policy Policy Evaluation.” ICML, 2000. https://scholarworks.umass.edu/cgi/viewcontent.cgi?article=1079&context=cs_facult y_pubs [Jiang&Li,16] Nan Jiang, Lihong Li. “Doubly Robust Off-policy Value Evaluation for Reinforcement Learning.” ICML, 2016. https://arxiv.org/abs/1511.03722 [Thomas&Brunskill,16] Philip S. Thomas, Emma Brunskill. “Data-Efficient Off-Policy Policy Evaluation for Reinforcement Learning.” ICML, 2016. https://arxiv.org/abs/1604.00923 May 2024 Towards assessing risk-return tradeoff of OPE 65
  61. References (2/4) [Uehara+,20] Masatoshi Uehara, Jiawei Huang, Nan Jiang. “Minimax

    Weight and Q- Function Learning for Off-Policy Evaluation.” ICML, 2020. https://arxiv.org/abs/1910.12809 [Kallus&Uehara,19] Nathan Kallus, Masatoshi Uehara. “Intrinsically Efficient, Stable, and Bounded Off-Policy Evaluation for Reinforcement Learning.” NeurIPS, 2019. https://arxiv.org/abs/1906.03735 [Brockman+,16] Greg Brockman, Vicki Cheung, Ludwig Pettersson, Jonas Schneider, John Schulman, Jie Tang, and Wojciech Zaremba. “OpenAI Gym.” 2016. https://arxiv.org/abs/1606.01540 [Voloshin+,21] Cameron Voloshin, Hoang M. Le, Nan Jiang, Yisong Yue. “Empirical Study of Off-Policy Policy Evaluation for Reinforcement Learning.” NeurIPS datasets&benchmarks, 2021. https://arxiv.org/abs/1911.06854 May 2024 Towards assessing risk-return tradeoff of OPE 66
  62. References (3/4) [Fu+,21] Justin Fu, Mohammad Norouzi, Ofir Nachum, George

    Tucker, Ziyu Wang, Alexander Novikov, Mengjiao Yang, Michael R. Zhang, Yutian Chen, Aviral Kumar, Cosmin Paduraru, Sergey Levine, Tom Le Paine. “Benchmarks for Deep Off-Policy Evaluation.” ICLR, 2021. https://arxiv.org/abs/2103.16596 [Doroudi+,18] Shayan Doroudi, Philip S. Thomas, Emma Brunskill. “Importance Sampling for Fair Policy Selection.” IJCAI, 2018. https://people.cs.umass.edu/~pthomas/papers/Daroudi2017.pdf [Kiyohara+,23] Haruka Kiyohara, Ren Kishimoto, Kosuke Kawakami, Ken Kobayashi, Kazuhide Nakata, Yuta Saito. “SCOPE-RL: A Python Library for Offline Reinforcement Learning, Off-Policy Evaluation, and Policy Selection.” 2023. [Hasselt+,16] Hado van Hasselt, Arthur Guez, and David Silver. “Deep Reinforcement Learning with Double Q-learning.” AAAI, 2016. https://arxiv.org/abs/1509.06461 May 2024 Towards assessing risk-return tradeoff of OPE 67
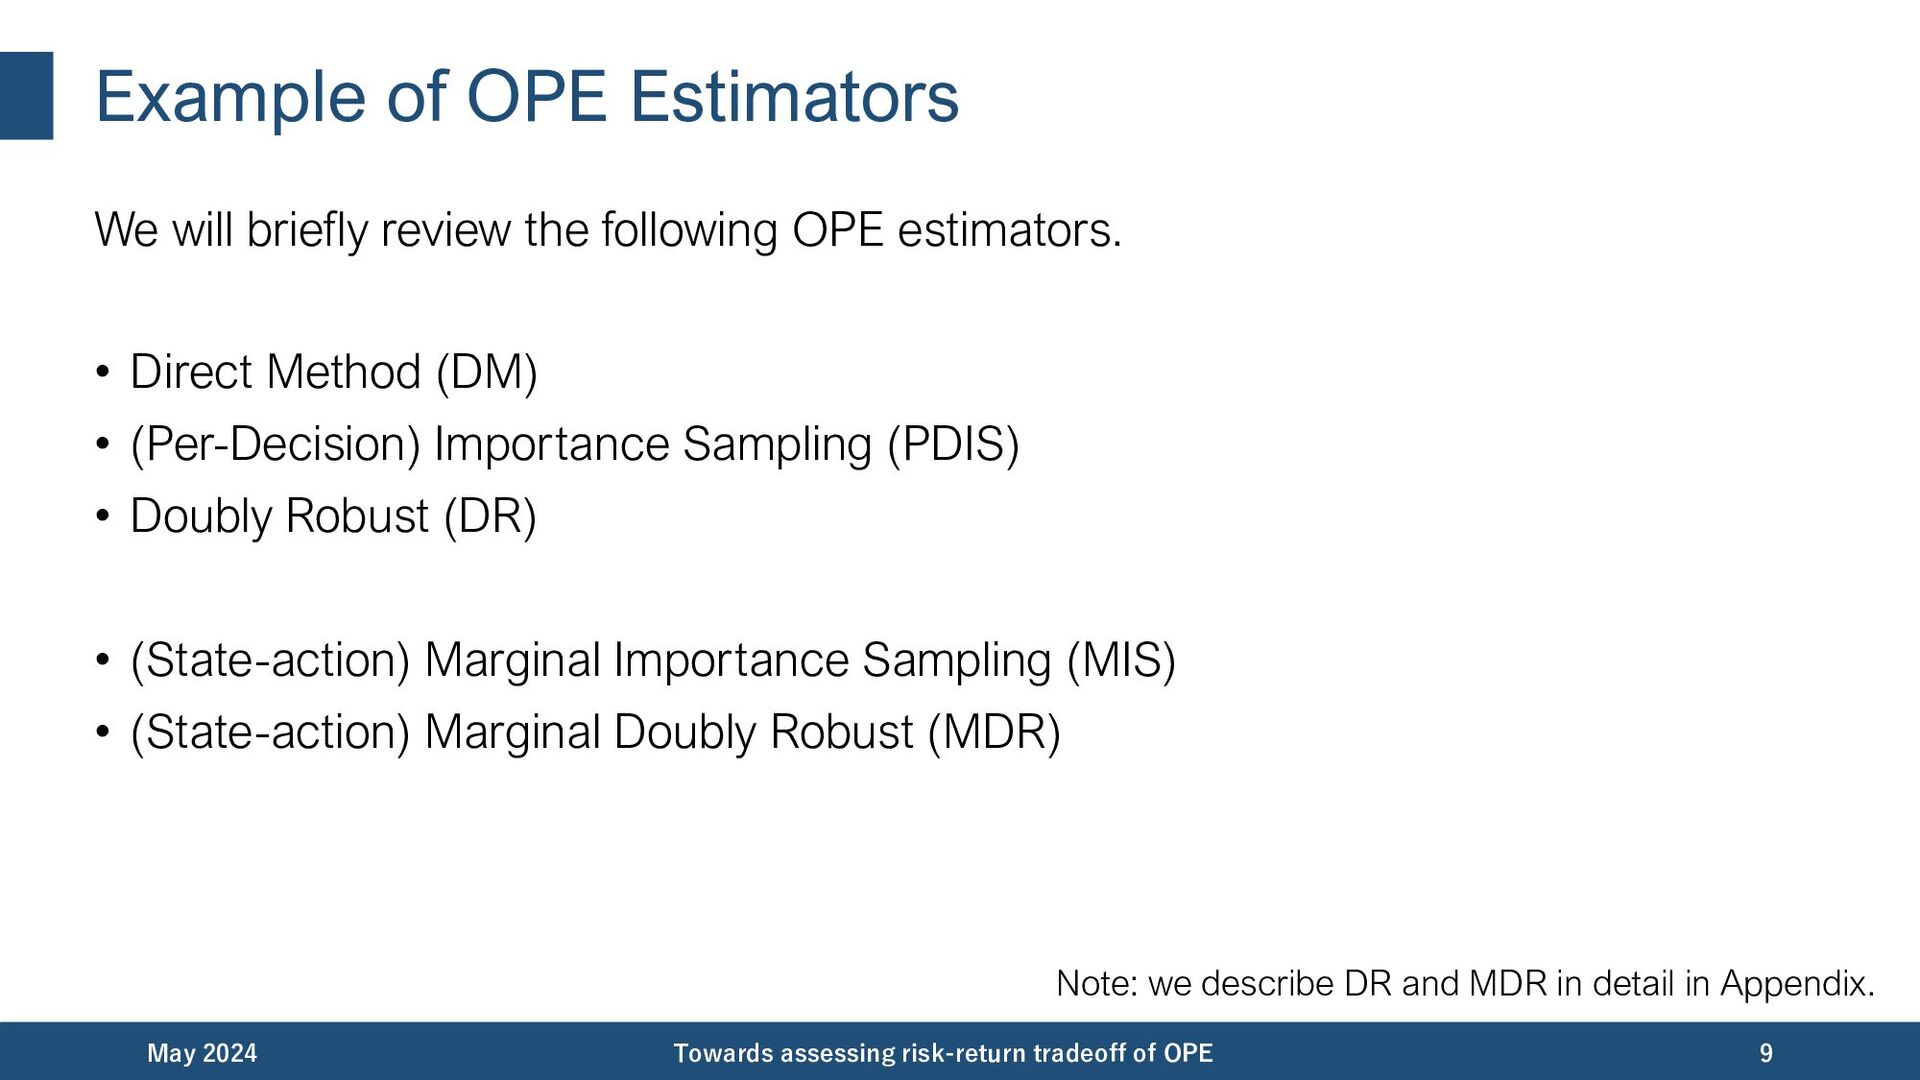
  63. References (4/4) [Kumar+,20] Aviral Kumar, Aurick Zhou, George Tucker, and

    Sergey Levine. “Conservative Q-Learning for Offline Reinforcement Learning.” NeurIPS, 2020. https://arxiv.org/abs/2006.04779 [Fujimoto+,19] Scott Fujimoto, David Meger, Doina Precup. “Off-Policy Deep Reinforcement Learning without Exploration.” ICML, 2019. https://arxiv.org/abs/1812.02900 [Yang+,20] Mengjiao Yang, Ofir Nachum, Bo Dai, Lihong Li, Dale Schuurmans. “Off- Policy Evaluation via the Regularized Lagrangian.” NeurIPS, 2020. https://arxiv.org/abs/2007.03438 [Seno&Imai,22] Takuma Seno and Michita Imai. “d3rlpy: An Offline Deep Reinforcement Learning Library.” JMLR, 2022. https://arxiv.org/abs/2111.03788 [Sharpe,98] William Sharpe. “The Sharpe Ratio.” Streetwise – the Best of the Journal of Portfolio Management, 1998. May 2024 Towards assessing risk-return tradeoff of OPE 68