Upgrade to Pro
— share decks privately, control downloads, hide ads and more …
Speaker Deck
Features
Speaker Deck
PRO
Sign in
Sign up for free
Search
Search
Ember with D3 for Data Visualization
Search
heyjin kim
June 21, 2014
Technology
230
0
Share
Embed
Copy iframe code
Copy JS code
Copy link
Start on current slide
Ember with D3 for Data Visualization
heyjin kim
June 21, 2014
More Decks by heyjin kim
See All by heyjin kim
Ember D3 EmberNYC
heyjinkim
1
200
Other Decks in Technology
See All in Technology
Claude Codeとハーネスについて考えてみる
oikon48
19
9.4k
事業価値を⽣み出すSREへ SREが担うべき意思決定の5層
kenta_hi
2
3.6k
はじめてのWDM
miyukichi_ospf
1
140
プロダクトだけじゃない、社内プロセスにおける自動化・省力化ノススメ
kakehashi
PRO
1
3.7k
依頼文化をやめる日 EM視点で語るPlatform EngineeringとInclusive SRE / Discussing Platform Engineering and Inclusive SRE from an EM's Perspective
shin1988
4
5.4k
Foxgloveについて 実際にExtensionを開発して公開するまでの話 / About Foxglove: The Story of Developing and Releasing an Extension
ry0_ka
0
210
SRE依存からの脱却 運用を開 発チームへ移す、 フルサイ クル開 発体制の実践
joooee0000
0
2.7k
AI Driven AI Governance
pict3
0
380
しくみを学んで使いこなそう GitHub Copilot app
torumakabe
2
240
SRE本の知られざる名シーン / The Hidden Gems of Google SRE Book
nari_ex
1
380
証券システムを10年Scalaで作り続けるということ - 関数型まつり2026
krrrr38
3
840
Making sense of Google’s agentic dev tools
glaforge
1
200
Featured
See All Featured
Chasing Engaging Ingredients in Design
codingconduct
0
230
Fight the Zombie Pattern Library - RWD Summit 2016
marcelosomers
234
17k
We Are The Robots
honzajavorek
0
280
How Fast Is Fast Enough? [PerfNow 2025]
tammyeverts
3
650
職位にかかわらず全員がリーダーシップを発揮するチーム作り / Building a team where everyone can demonstrate leadership regardless of position
madoxten
63
55k
The B2B funnel & how to create a winning content strategy
katarinadahlin
PRO
1
420
[RailsConf 2023] Rails as a piece of cake
palkan
59
6.7k
Refactoring Trust on Your Teams (GOTO; Chicago 2020)
rmw
35
3.6k
Automating Front-end Workflow
addyosmani
1370
210k
Java REST API Framework Comparison - PWX 2021
mraible
34
9.5k
Practical Tips for Bootstrapping Information Extraction Pipelines
honnibal
25
2k
Creating an realtime collaboration tool: Agile Flush - .NET Oxford
marcduiker
35
2.5k
Transcript
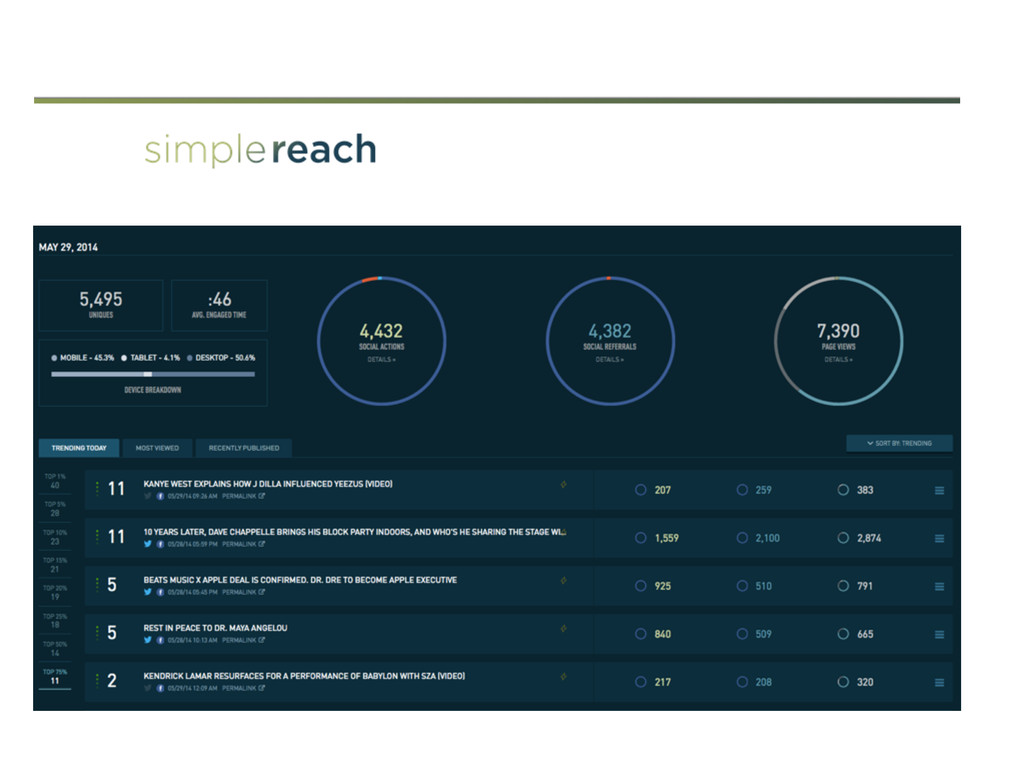
Ember with D3 @EmberNYC Heyjin Kim Ember Princess Engineer, SimpleReach
@heyjinkim @ember_princess
[email protected]
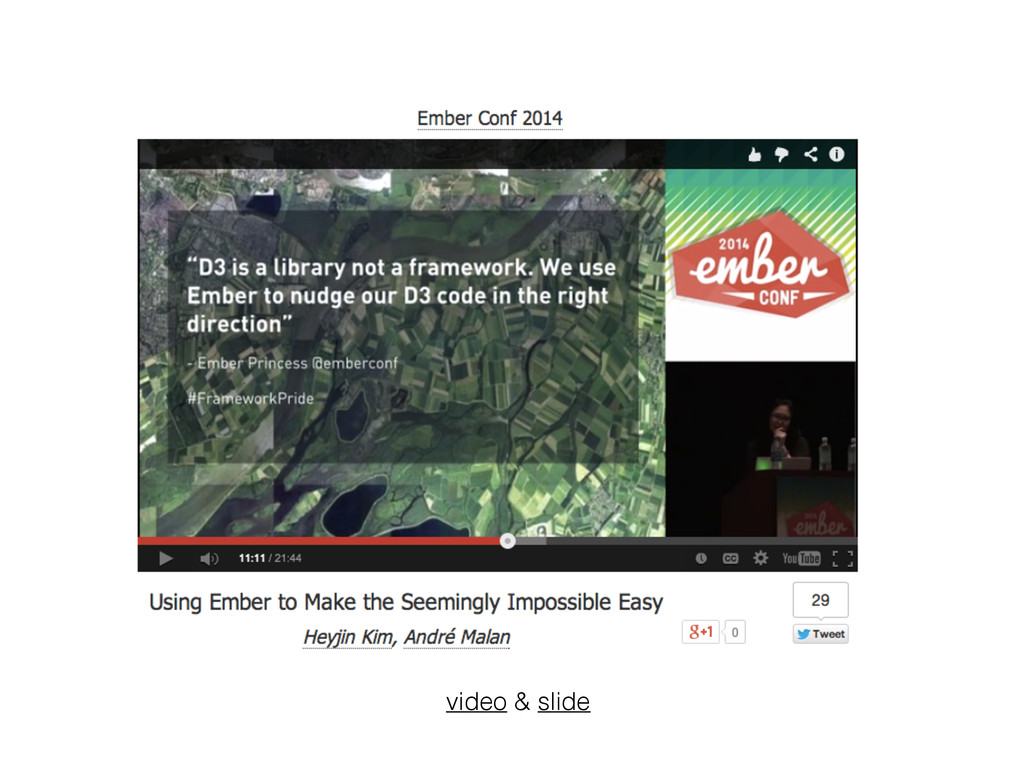
None
video & slide
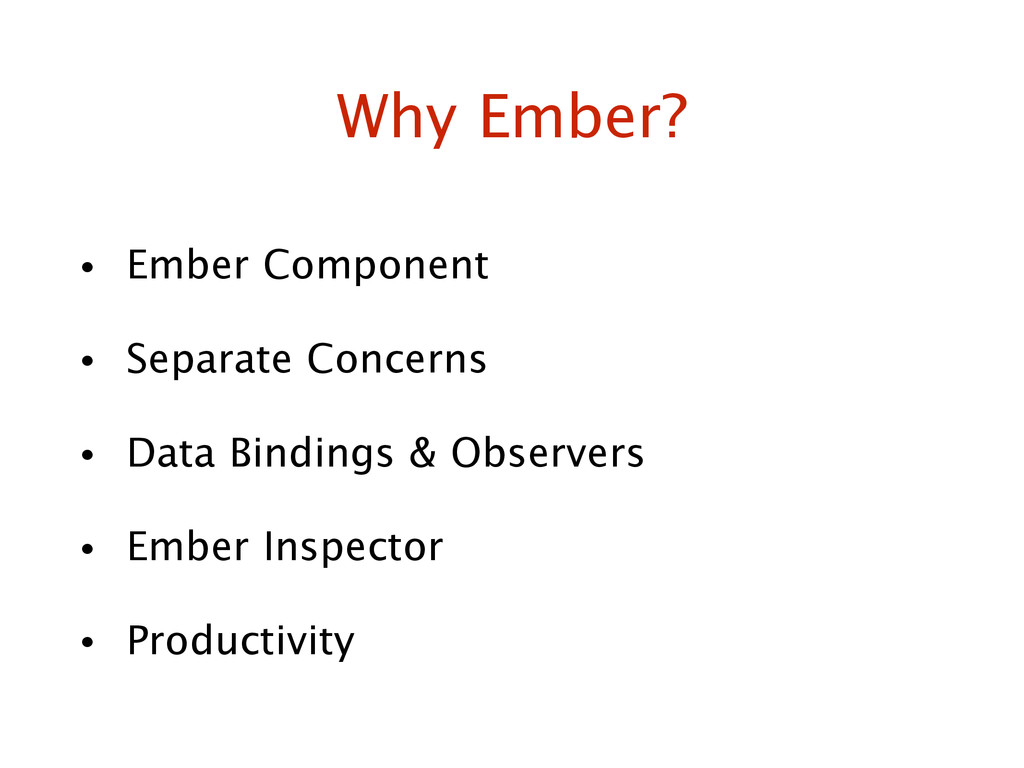
• Ember Component • Separate Concerns • Data Bindings &
Observers • Ember Inspector • Productivity Why Ember?
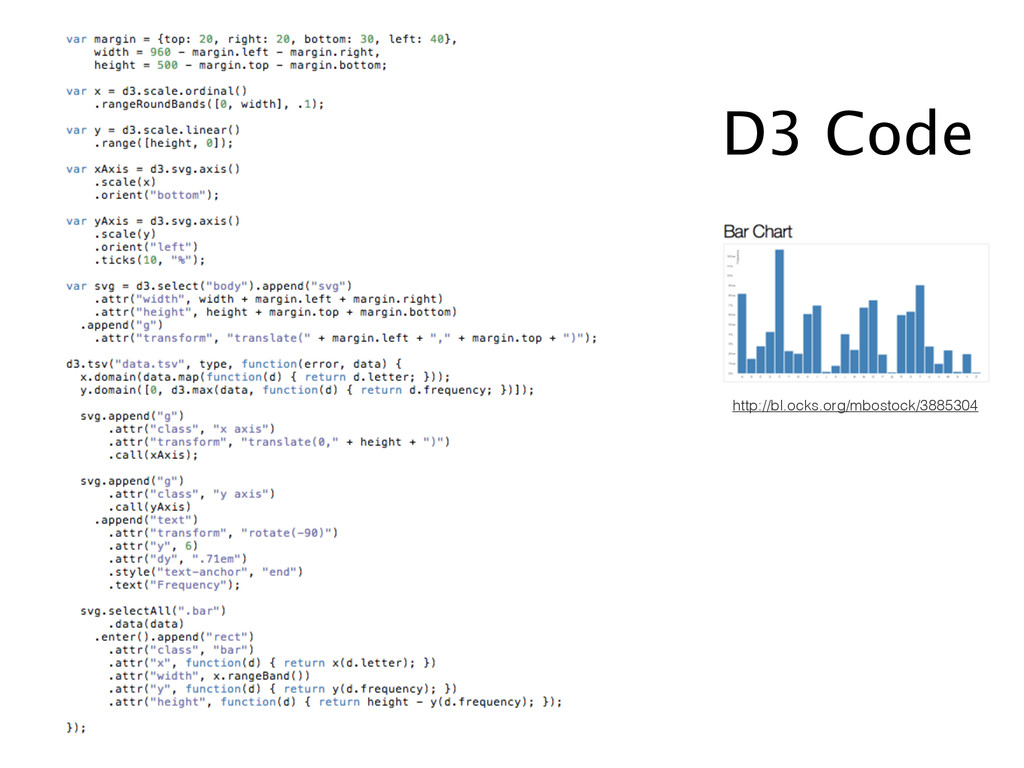
http://bl.ocks.org/mbostock/3885304 D3 Code
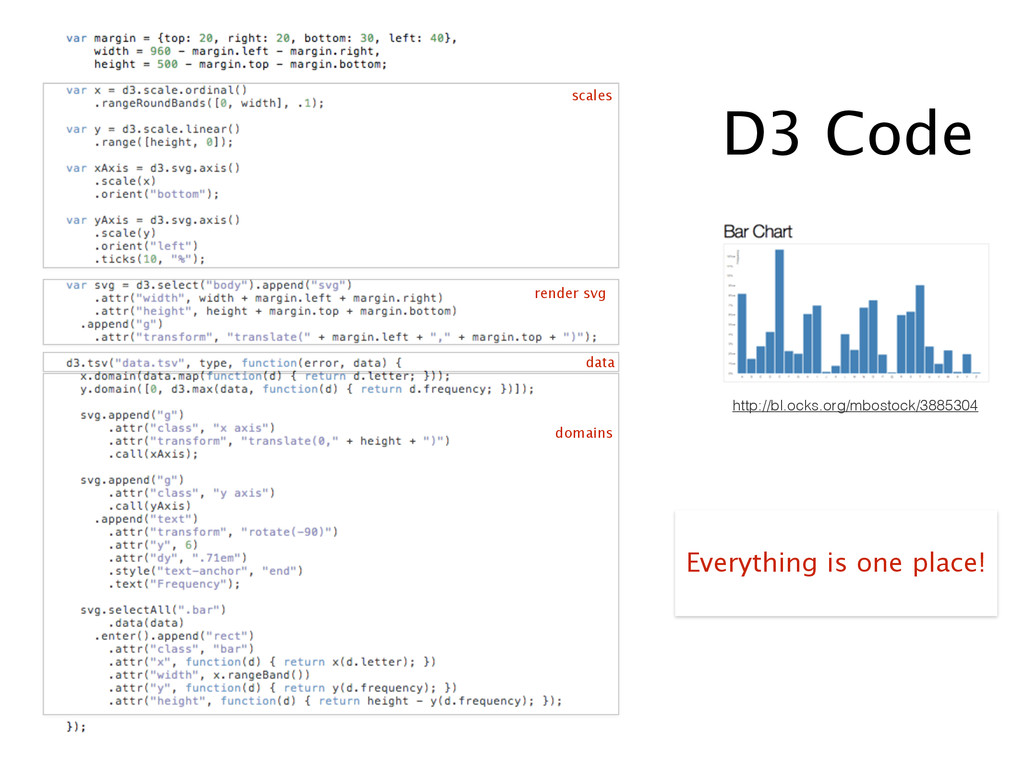
http://bl.ocks.org/mbostock/3885304 D3 Code scales render svg data Everything is one
place! domains
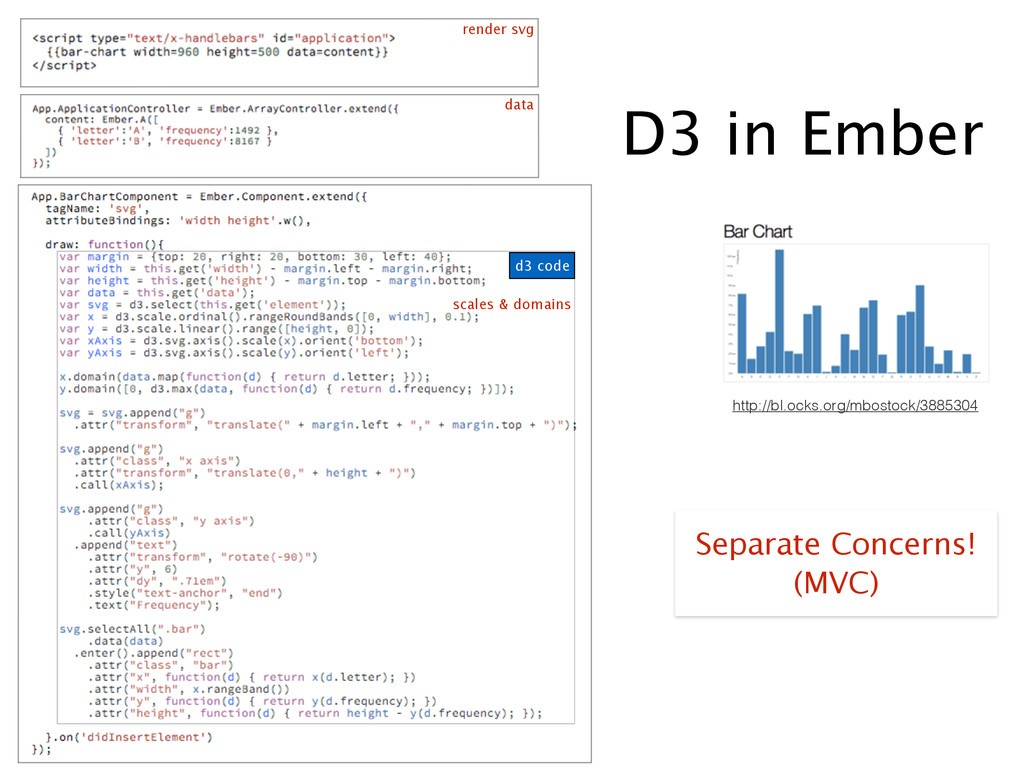
http://bl.ocks.org/mbostock/3885304 D3 in Ember Separate Concerns! (MVC) d3 code data
render svg scales & domains
Examples
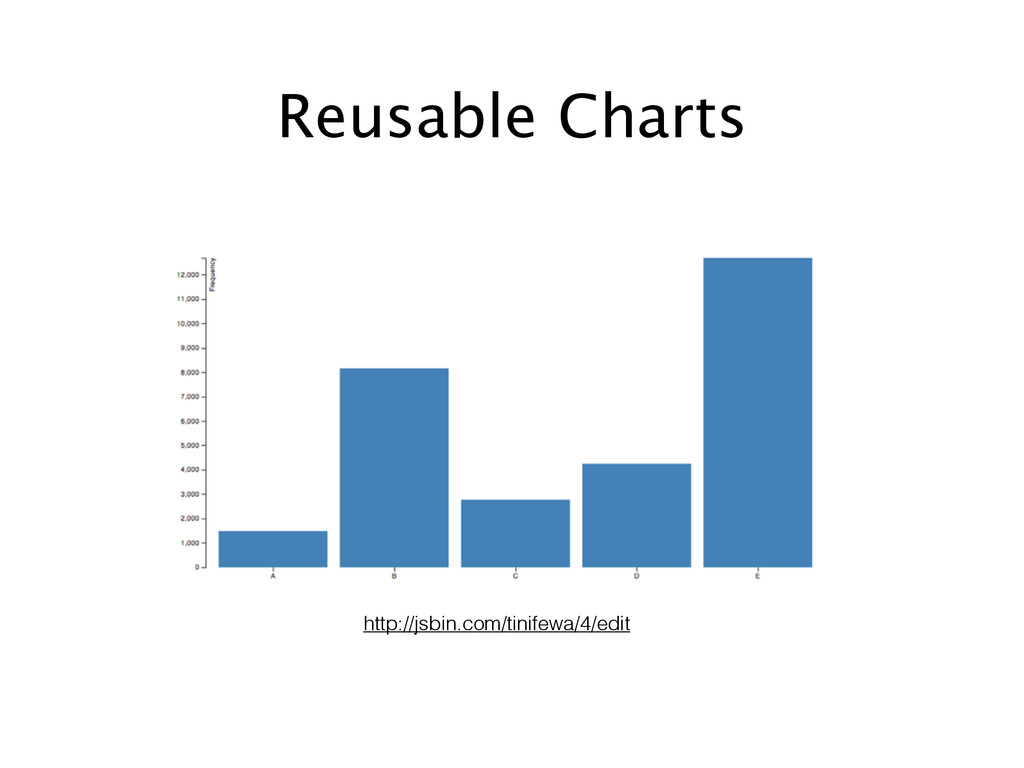
Reusable Charts http://jsbin.com/tinifewa/4/edit
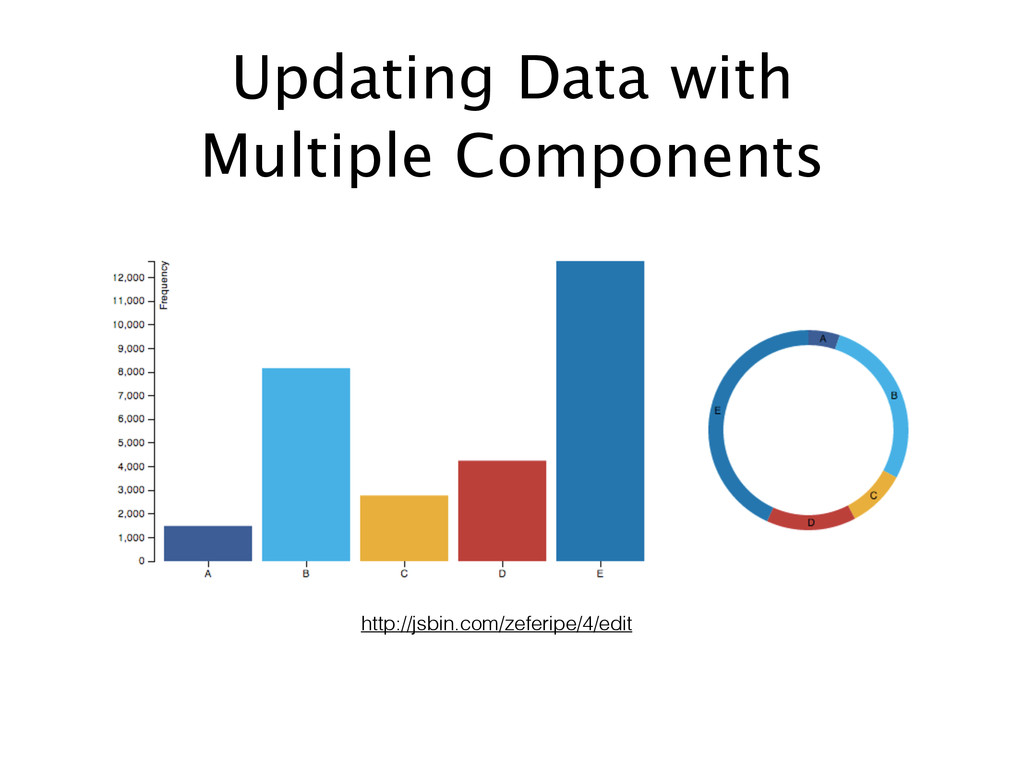
Updating Data with Multiple Components http://jsbin.com/zeferipe/4/edit
None
• Ember Component • Separate Concerns • Data Bindings &
Observers • Ember Inspector • Productivity Why Ember?
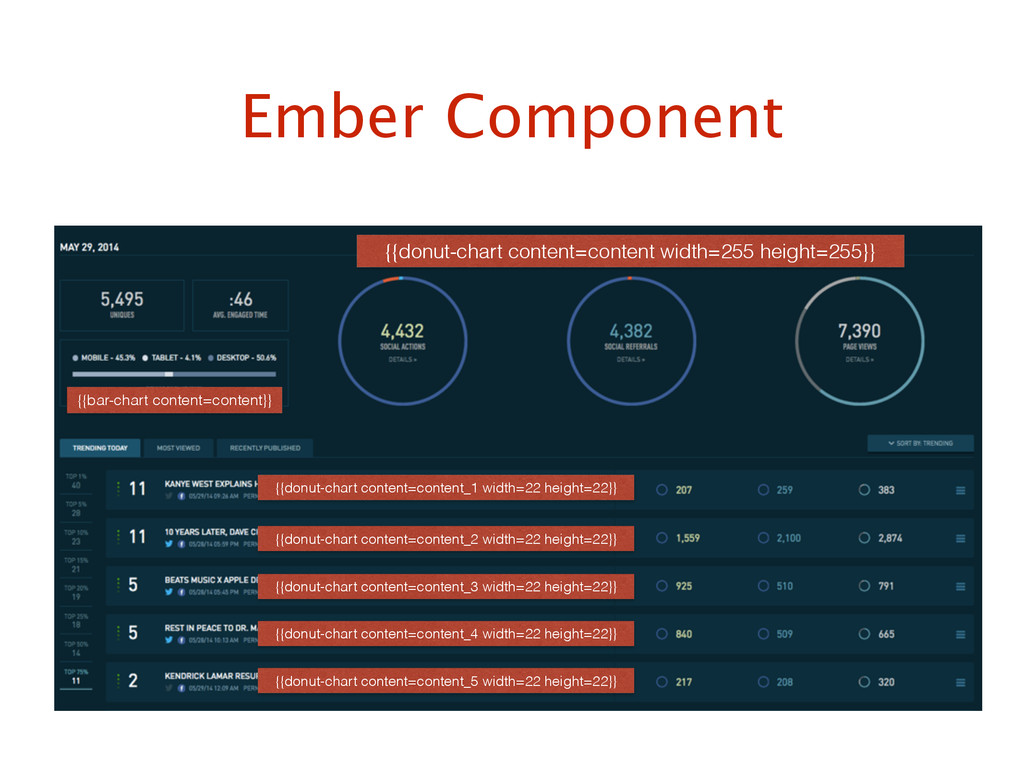
Ember Component {{donut-chart content=content width=255 height=255}} {{donut-chart content=content_1 width=22 height=22}}
{{bar-chart content=content}} {{donut-chart content=content_2 width=22 height=22}} {{donut-chart content=content_3 width=22 height=22}} {{donut-chart content=content_4 width=22 height=22}} {{donut-chart content=content_5 width=22 height=22}}
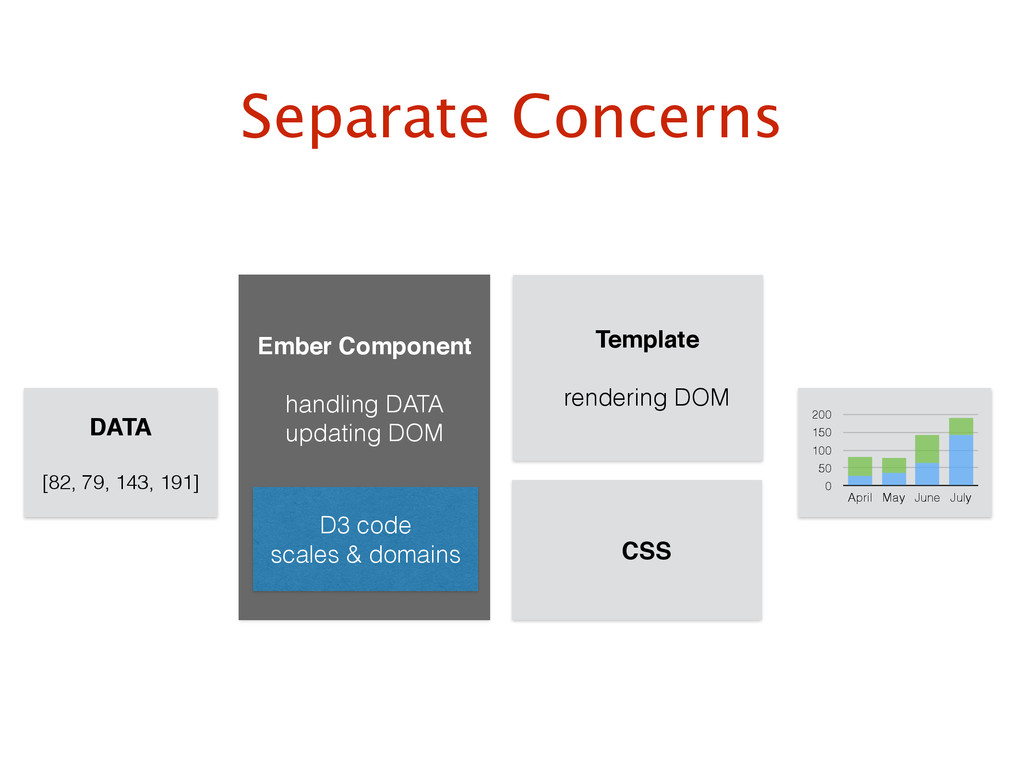
Template ! rendering DOM Separate Concerns DATA! ! [82, 79,
143, 191] Ember Component handling DATA updating DOM ! CSS 0 50 100 150 200 April May June July D3 code scales & domains
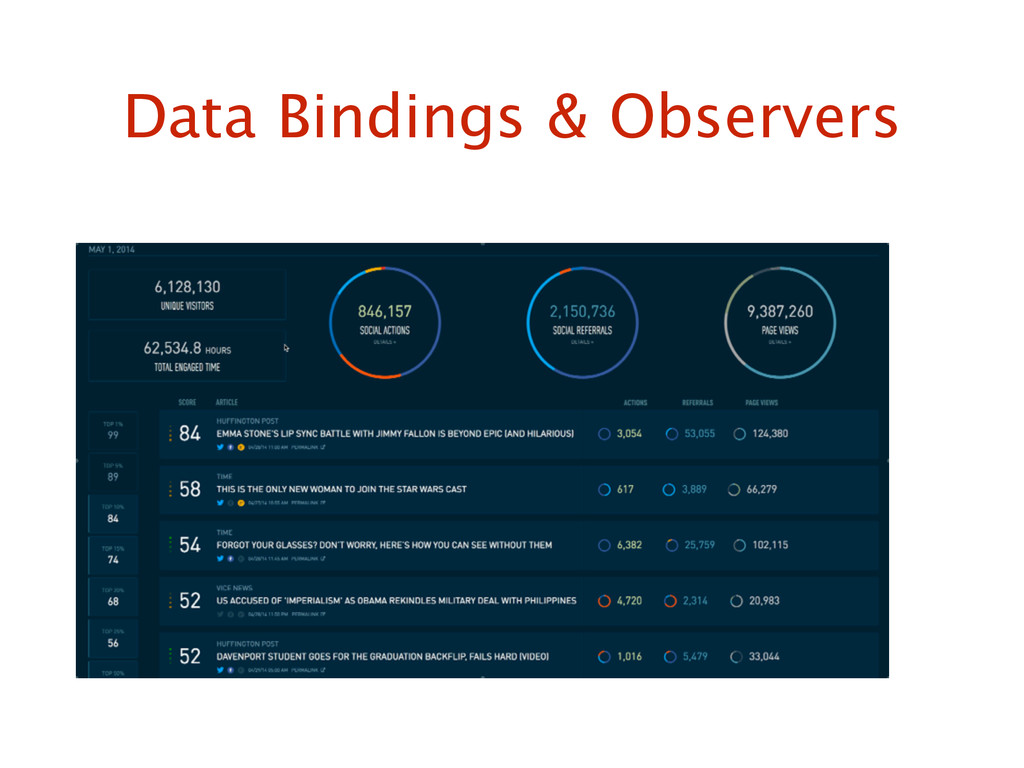
Data Bindings & Observers
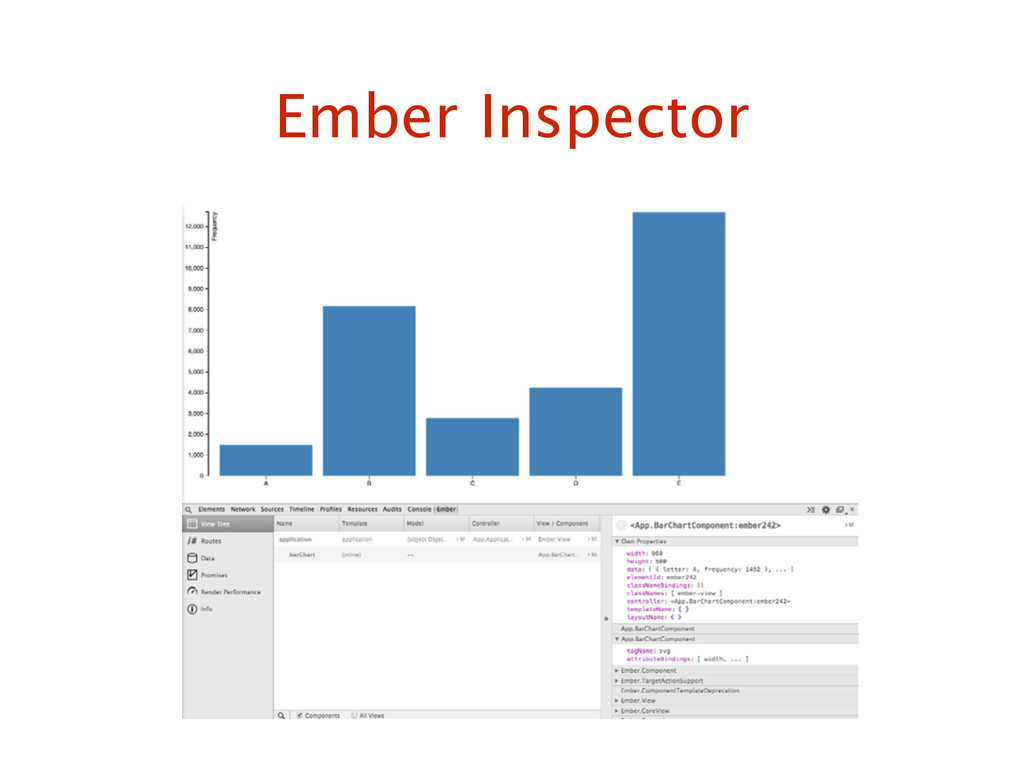
Ember Inspector
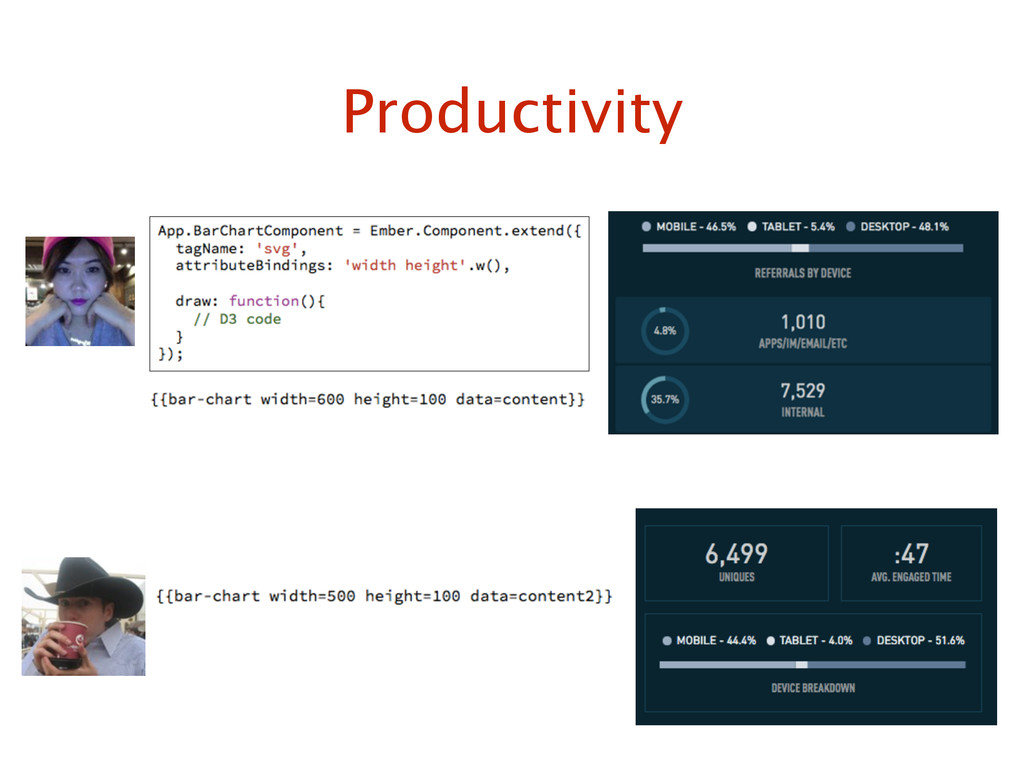
Productivity
THANK YOU! @heyjinkim @ember_princess ! http://heyjinjs.us
[email protected]
![THANK YOU! @heyjinkim @ember_princess ! http://heyjinjs.us [email protected]](https://files.speakerdeck.com/presentations/f2fe3320db8d0131acd202ad80049d17/slide_17.jpg)