How to go from REDCap clinical trial data to NIH enrollment tables with R. Presented at R/Medicine 2018, resulted in the codified package in collaboration with Will Beasley at OUHSC
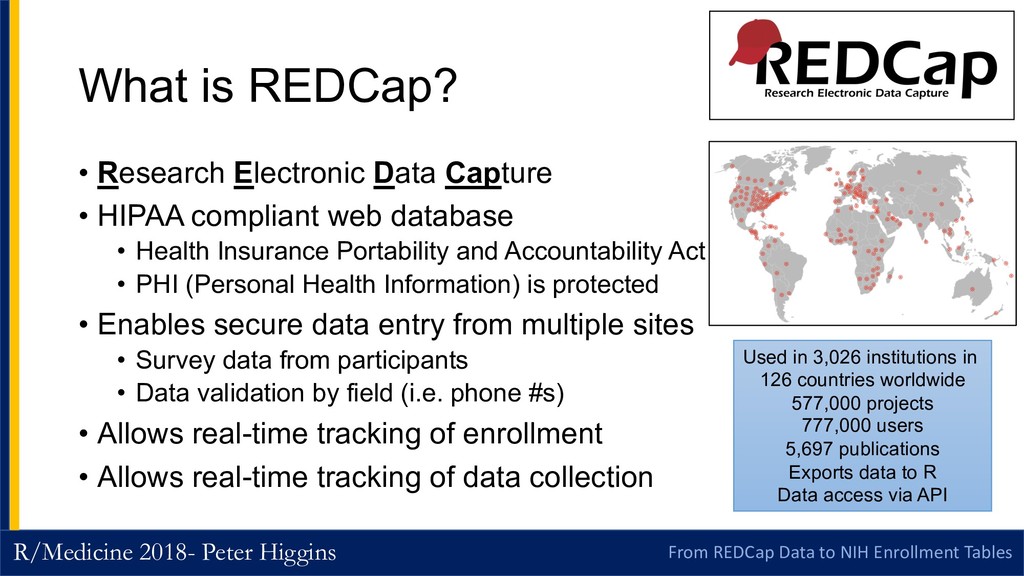
Tables What is REDCap? • Research Electronic Data Capture • HIPAA compliant web database • Health Insurance Portability and Accountability Act • PHI (Personal Health Information) is protected • Enables secure data entry from multiple sites • Survey data from participants • Data validation by field (i.e. phone #s) • Allows real-time tracking of enrollment • Allows real-time tracking of data collection Used in 3,026 institutions in 126 countries worldwide 577,000 projects 777,000 users 5,697 publications Exports data to R Data access via API
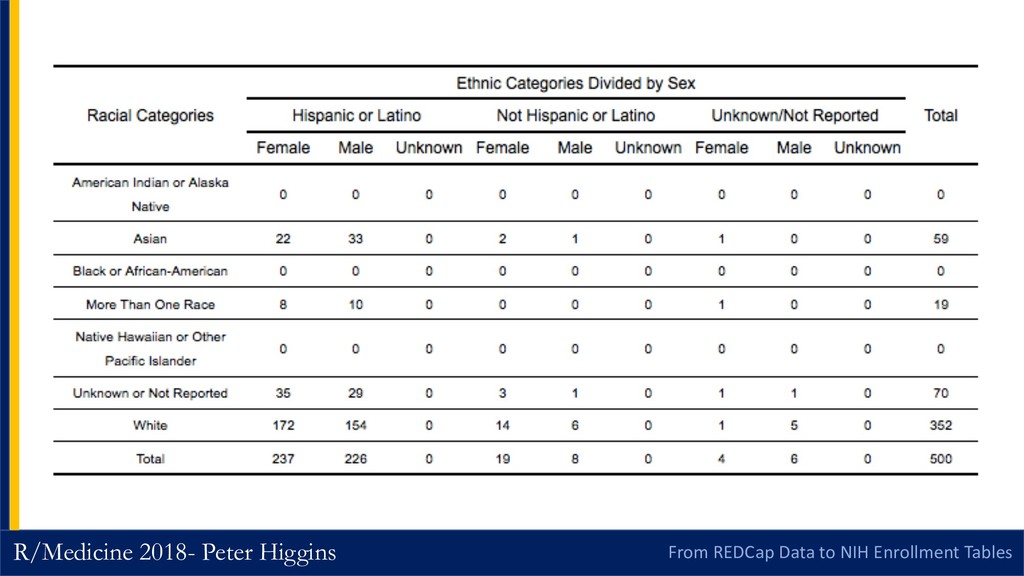
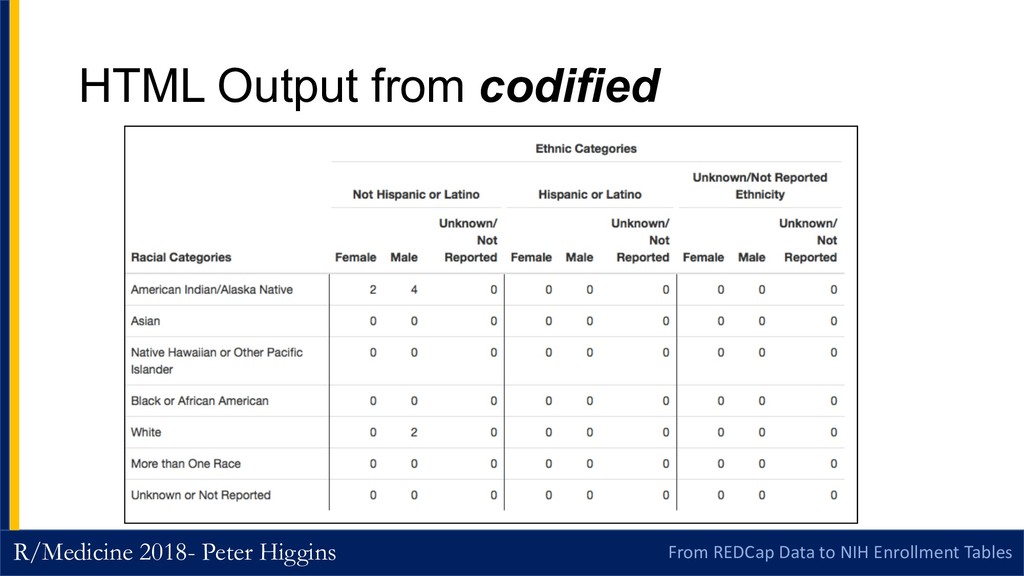
Tables What is an NIH Enrollment Report? • When you have an NIH grant that includes enrolling patients • Every year you have to provide a standard enrollment report in your annual research productivity progress report (RPPR) • This requires you to count enrolled subjects and divides them on three dimensions • Race: 7 categories • Ethnicity: 3 categories • Sex: 3 categories • To produce a 3 dimensional matrix of 63 cells of counts • Then submit this as a 2 dimensional (very untidy) table • With totals for both rows and columns
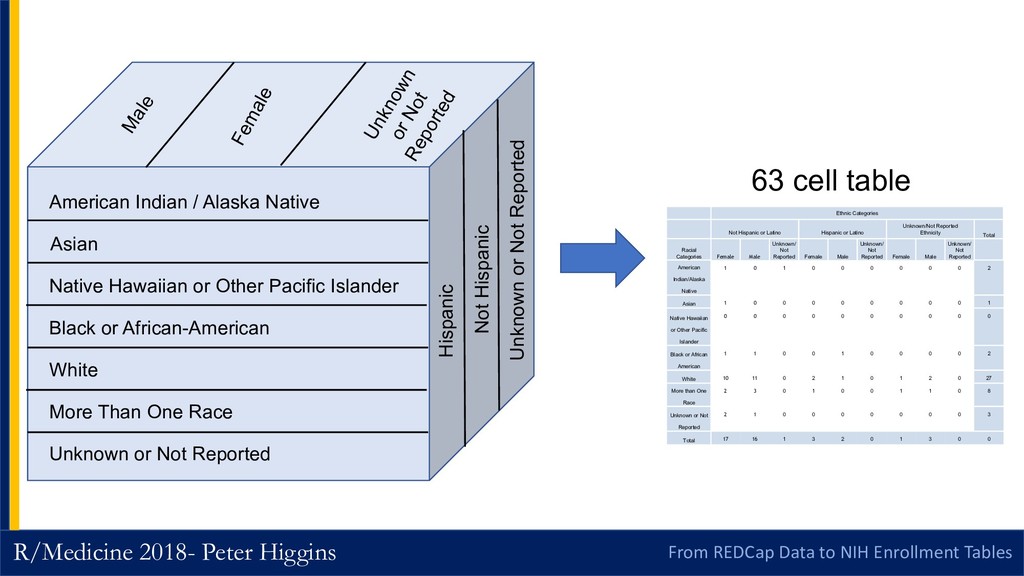
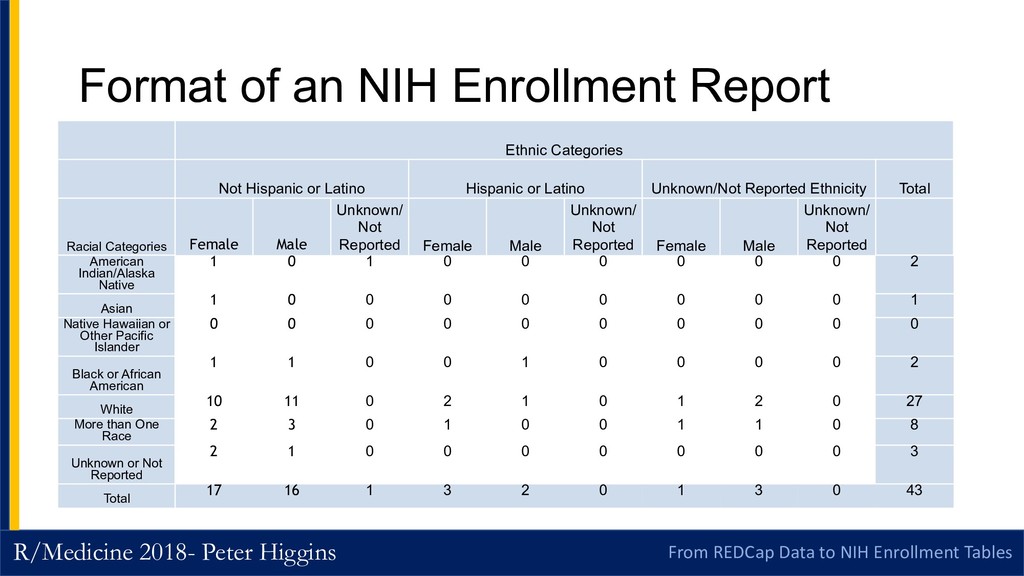
Tables American Indian / Alaska Native Asian Native Hawaiian or Other Pacific Islander Black or African-American White More Than One Race Unknown or Not Reported Male Female Unknown or Not Reported Hispanic Not Hispanic Unknown or Not Reported 63 cell table Ethnic Categories Not Hispanic or Latino Hispanic or Latino Unknown/Not Reported Ethnicity Total Racial Categories Female Male Unknown/ Not Reported Female Male Unknown/ Not Reported Female Male Unknown/ Not Reported American Indian/Alaska Native 1 0 1 0 0 0 0 0 0 2 Asian 1 0 0 0 0 0 0 0 0 1 Native Hawaiian or Other Pacific Islander 0 0 0 0 0 0 0 0 0 0 Black or African American 1 1 0 0 1 0 0 0 0 2 White 10 11 0 2 1 0 1 2 0 27 More than One Race 2 3 0 1 0 0 1 1 0 8 Unknown or Not Reported 2 1 0 0 0 0 0 0 0 3 Total 17 16 1 3 2 0 1 3 0 0
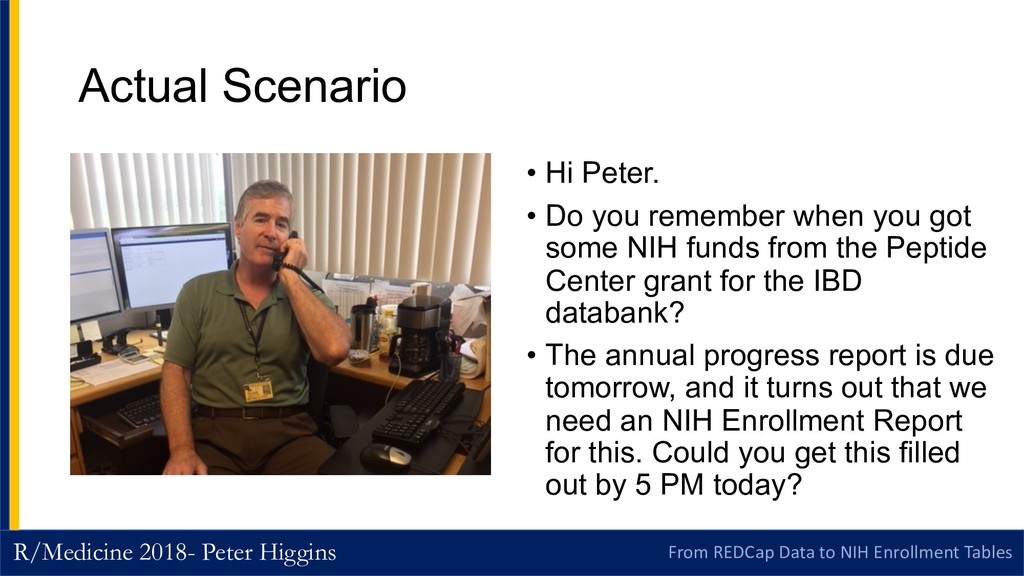
Tables Actual Scenario • Picture of Jeff Cole • Hi Peter. • Do you remember when you got some NIH funds from the Peptide Center grant for the IBD databank? • The annual progress report is due tomorrow, and it turns out that we need an NIH Enrollment Report for this. Could you get this filled out by 5 PM today?
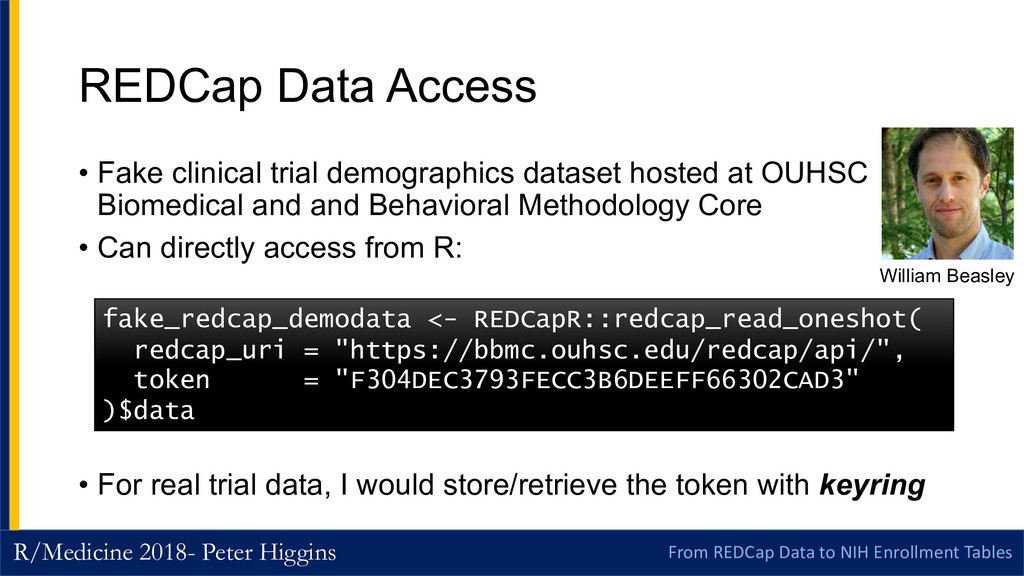
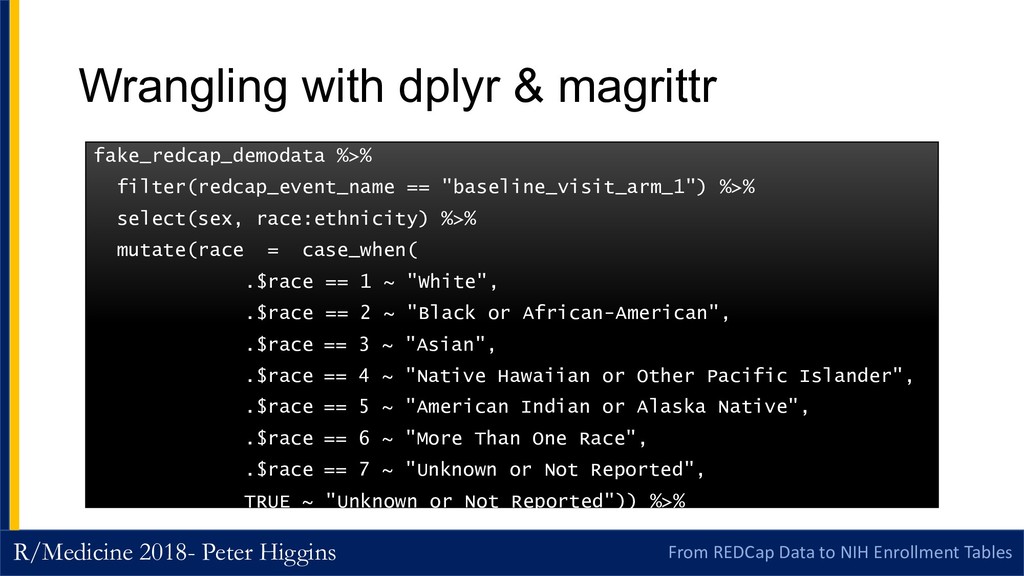
Tables REDCap Data Access • Fake clinical trial demographics dataset hosted at OUHSC Biomedical and and Behavioral Methodology Core • Can directly access from R: • For real trial data, I would store/retrieve the token with keyring fake_redcap_demodata <- REDCapR::redcap_read_oneshot( redcap_uri = "https://bbmc.ouhsc.edu/redcap/api/", token = "F304DEC3793FECC3B6DEEFF66302CAD3" )$data William Beasley
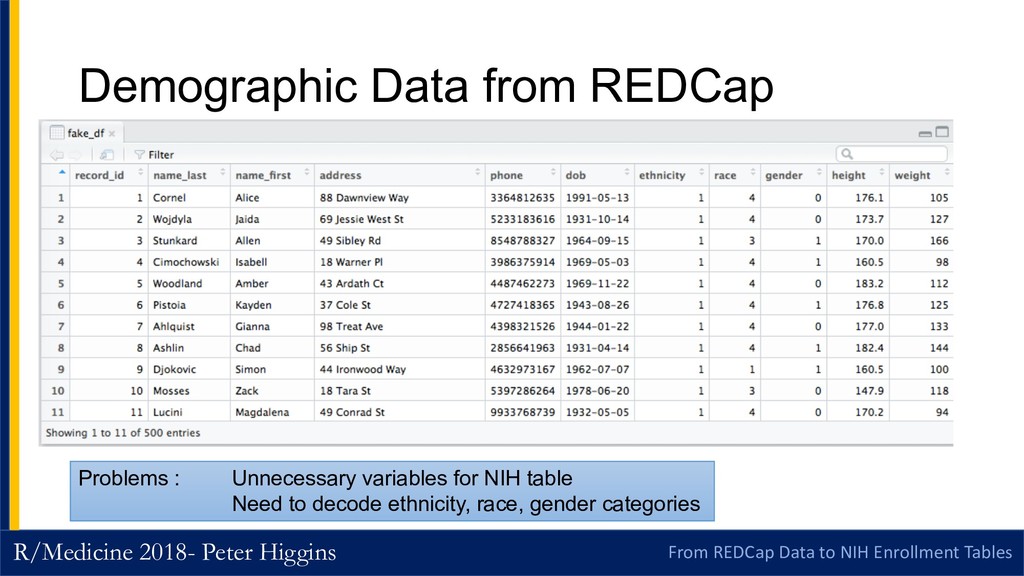
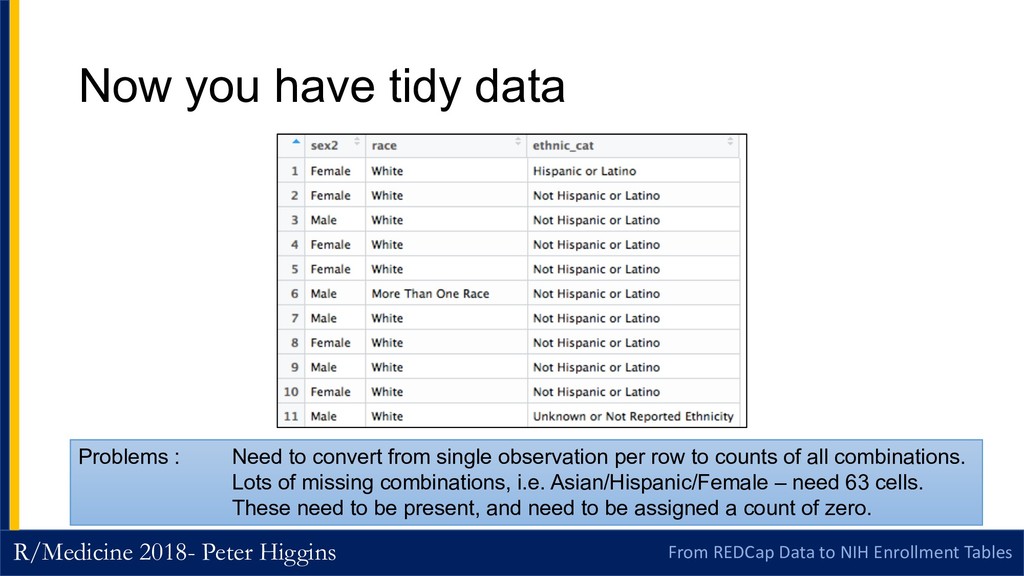
Tables Now you have tidy data Problems : Need to convert from single observation per row to counts of all combinations. Lots of missing combinations, i.e. Asian/Hispanic/Female – need 63 cells. These need to be present, and need to be assigned a count of zero.
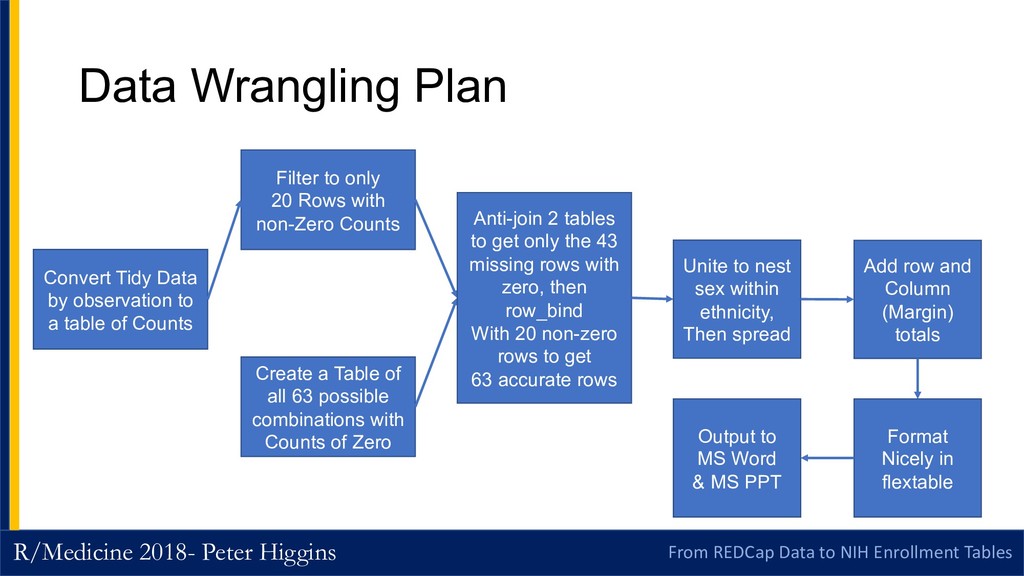
Tables Data Wrangling Plan Convert Tidy Data by observation to a table of Counts Create a Table of all 63 possible combinations with Counts of Zero Filter to only 20 Rows with non-Zero Counts Anti-join 2 tables to get only the 43 missing rows with zero, then row_bind With 20 non-zero rows to get 63 accurate rows Add row and Column (Margin) totals Format Nicely in flextable Output to MS Word & MS PPT Unite to nest sex within ethnicity, Then spread
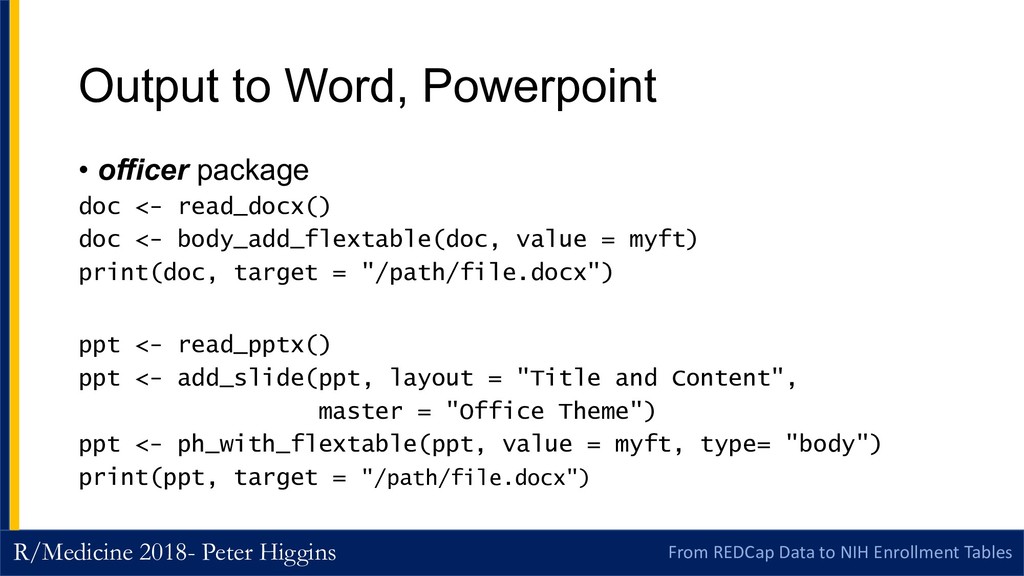
Tables Details of code slides here • Code and live demo with fake data were previously here • Moved to backup slides • Plans changed • Output to MS Word
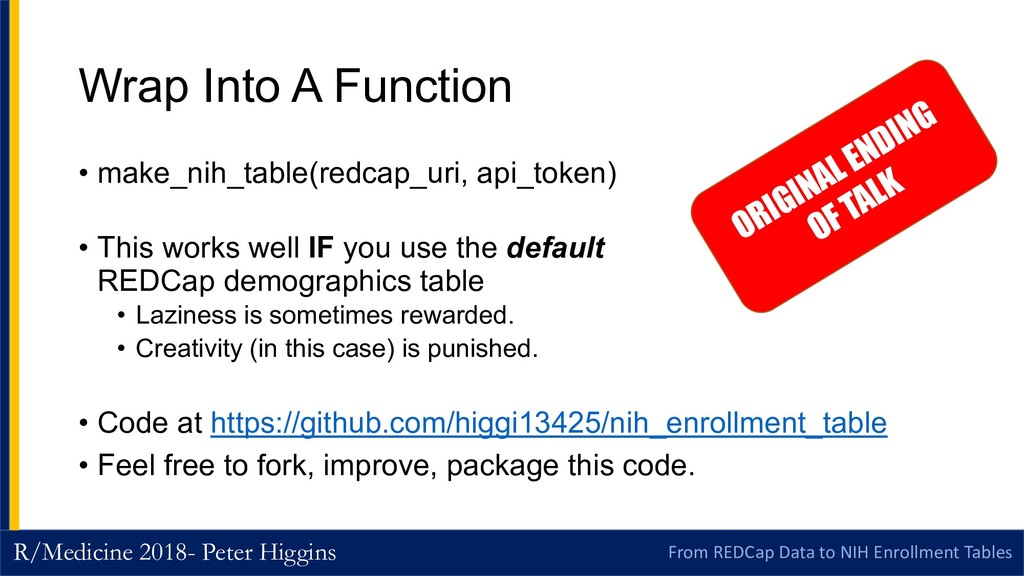
Tables Wrap Into A Function • make_nih_table(redcap_uri, api_token) • This works well IF you use the default REDCap demographics table • Laziness is sometimes rewarded. • Creativity (in this case) is punished. • Code at https://github.com/higgi13425/nih_enrollment_table • Feel free to fork, improve, package this code. ORIGINAL ENDING OF TALK
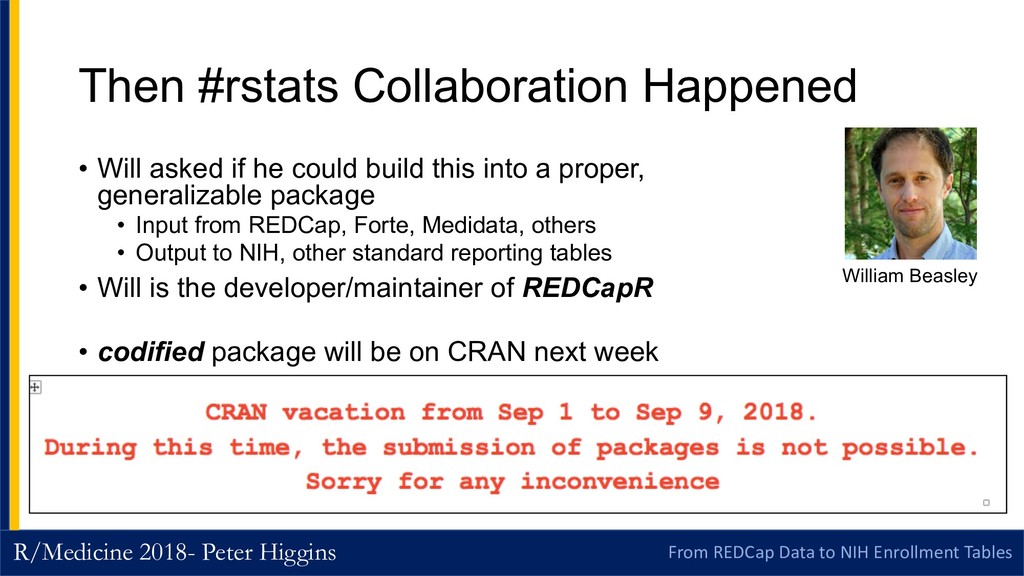
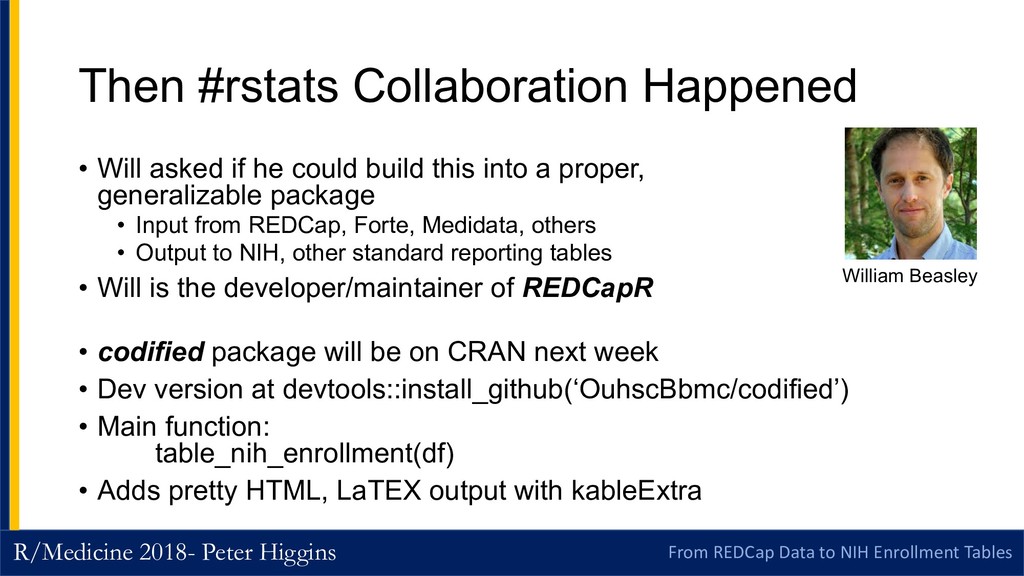
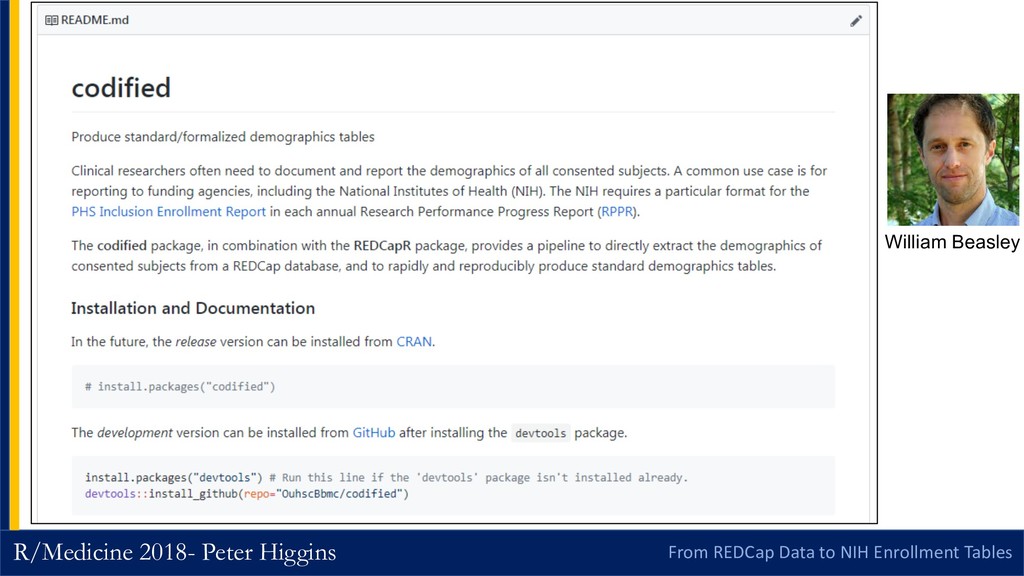
Tables Then #rstats Collaboration Happened • Will asked if he could build this into a proper, generalizable package • Input from REDCap, Forte, Medidata, others • Output to NIH, other standard reporting tables • Will is the developer/maintainer of REDCapR • codified package will be on CRAN next week • Dev version at devtools::install_github(‘OuhscBbmc/codified’) • Main function: table_nih_enrollment(df) • Adds pretty HTML, LaTEX output with kableExtra William Beasley
Tables Then #rstats Collaboration Happened • Will asked if he could build this into a proper, generalizable package • Input from REDCap, Forte, Medidata, others • Output to NIH, other standard reporting tables • Will is the developer/maintainer of REDCapR • codified package will be on CRAN next week • Dev version at devtools::install_github(‘OuhscBbmc/codified’) • Main function: table_nih_enrollment(df) • Adds pretty HTML, LaTEX output with kableExtra William Beasley
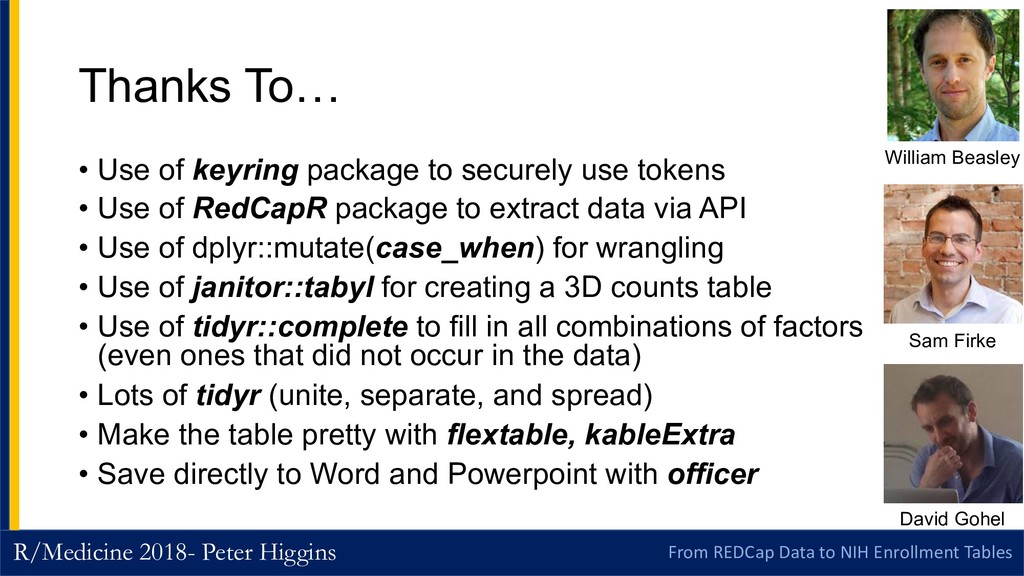
Tables Thanks To… • Use of keyring package to securely use tokens • Use of RedCapR package to extract data via API • Use of dplyr::mutate(case_when) for wrangling • Use of janitor::tabyl for creating a 3D counts table • Use of tidyr::complete to fill in all combinations of factors (even ones that did not occur in the data) • Lots of tidyr (unite, separate, and spread) • Make the table pretty with flextable, kableExtra • Save directly to Word and Powerpoint with officer David Gohel William Beasley Sam Firke
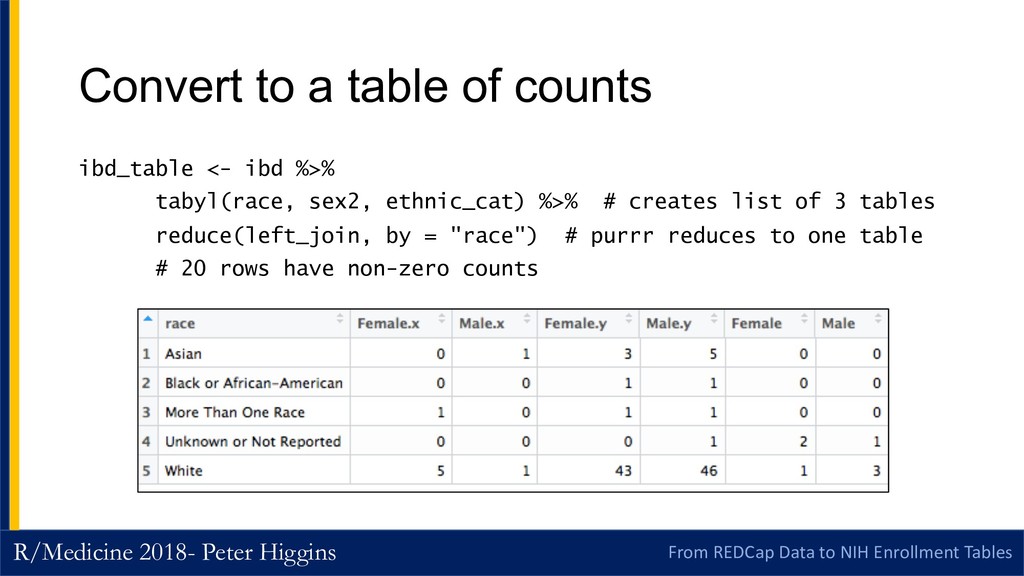
Tables Convert to a table of counts ibd_table <- ibd %>% tabyl(race, sex2, ethnic_cat) %>% # creates list of 3 tables reduce(left_join, by = "race") # purrr reduces to one table # 20 rows have non-zero counts
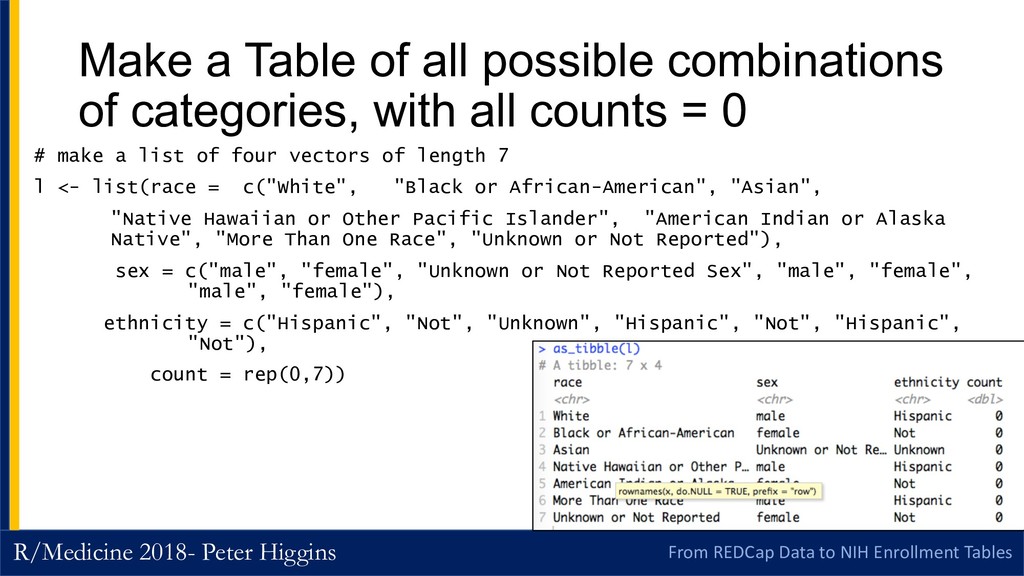
Tables Make a Table of all possible combinations of categories, with all counts = 0 # make a list of four vectors of length 7 l <- list(race = c("White", "Black or African-American", "Asian", "Native Hawaiian or Other Pacific Islander", "American Indian or Alaska Native", "More Than One Race", "Unknown or Not Reported"), sex = c("male", "female", "Unknown or Not Reported Sex", "male", "female", "male", "female"), ethnicity = c("Hispanic", "Not", "Unknown", "Hispanic", "Not", "Hispanic", "Not"), count = rep(0,7))
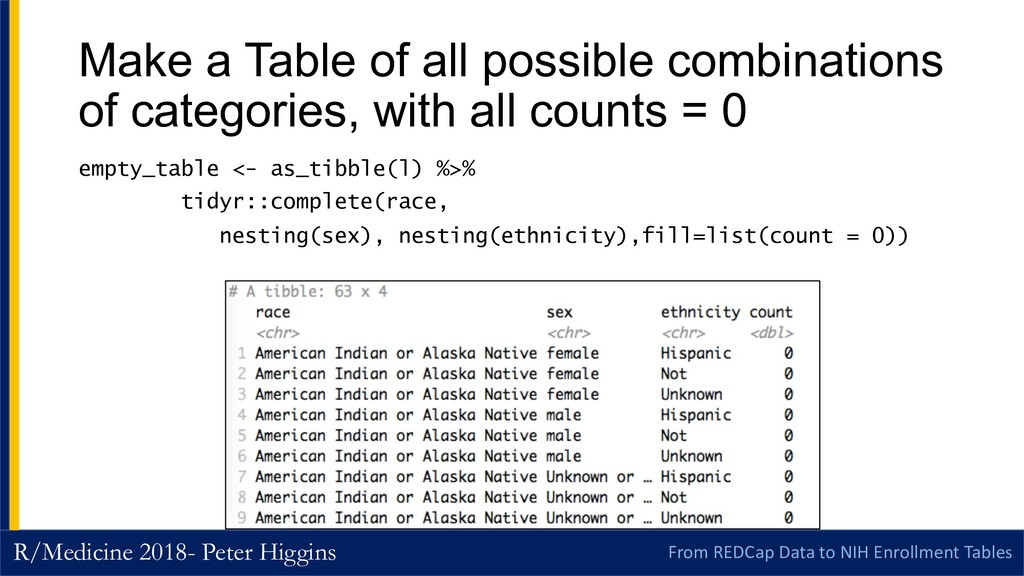
Tables Make a Table of all possible combinations of categories, with all counts = 0 empty_table <- as_tibble(l) %>% tidyr::complete(race, nesting(sex), nesting(ethnicity),fill=list(count = 0))
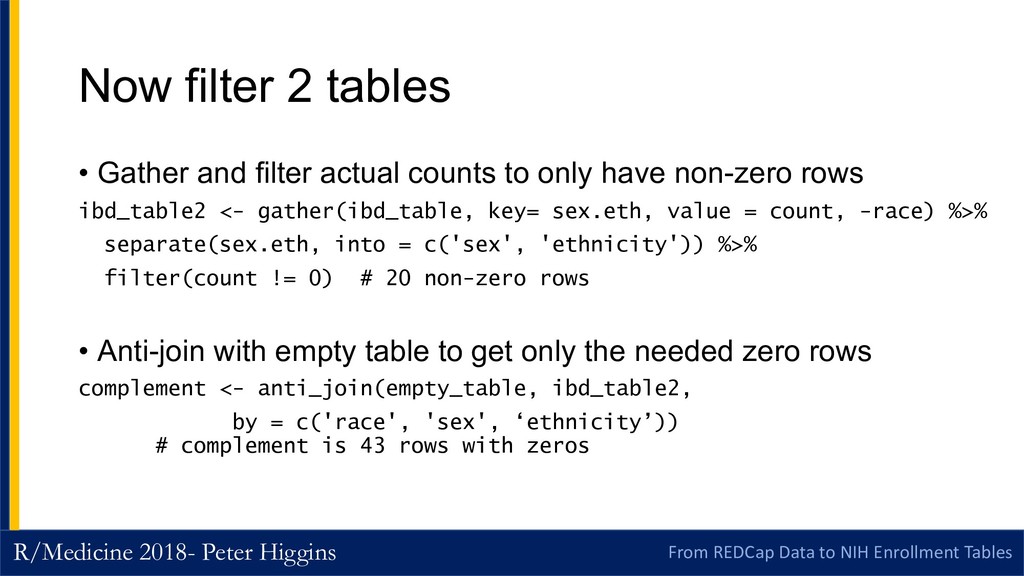
Tables Now filter 2 tables • Gather and filter actual counts to only have non-zero rows ibd_table2 <- gather(ibd_table, key= sex.eth, value = count, -race) %>% separate(sex.eth, into = c('sex', 'ethnicity')) %>% filter(count != 0) # 20 non-zero rows • Anti-join with empty table to get only the needed zero rows complement <- anti_join(empty_table, ibd_table2, by = c('race', 'sex', ‘ethnicity’)) # complement is 43 rows with zeros
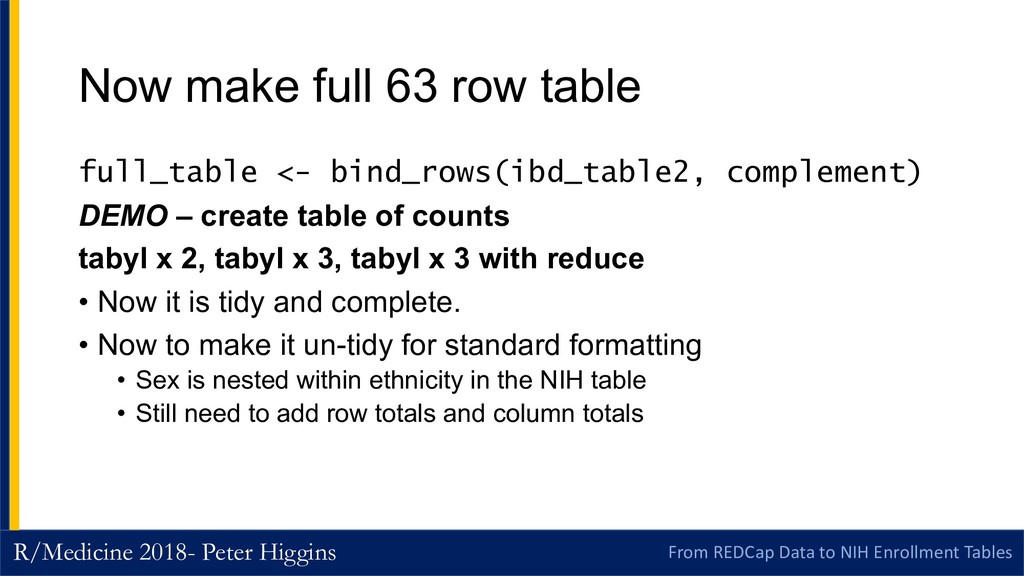
Tables Now make full 63 row table full_table <- bind_rows(ibd_table2, complement) DEMO – create table of counts tabyl x 2, tabyl x 3, tabyl x 3 with reduce • Now it is tidy and complete. • Now to make it un-tidy for standard formatting • Sex is nested within ethnicity in the NIH table • Still need to add row totals and column totals
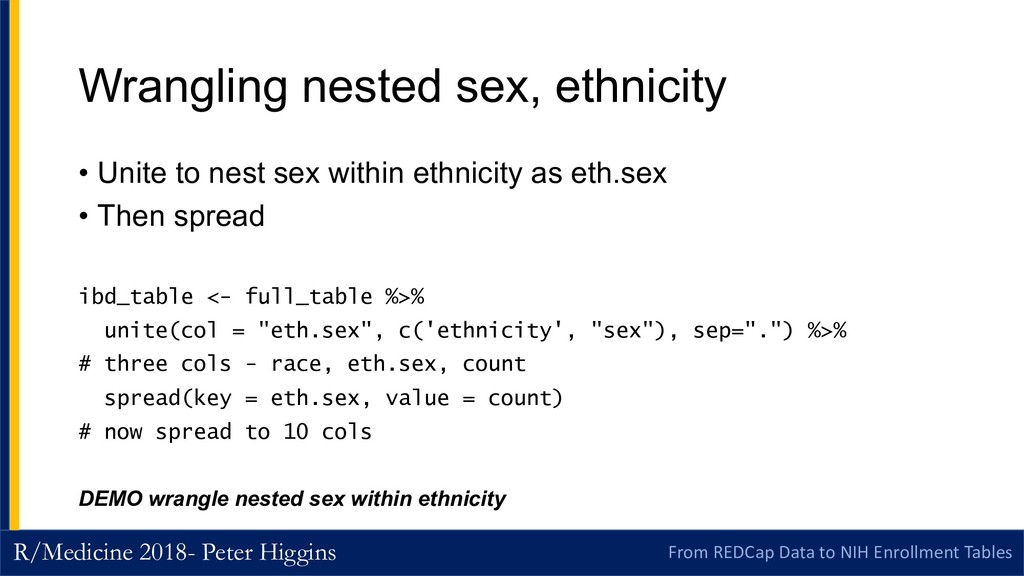
Tables Wrangling nested sex, ethnicity • Unite to nest sex within ethnicity as eth.sex • Then spread ibd_table <- full_table %>% unite(col = "eth.sex", c('ethnicity', "sex"), sep=".") %>% # three cols - race, eth.sex, count spread(key = eth.sex, value = count) # now spread to 10 cols DEMO wrangle nested sex within ethnicity
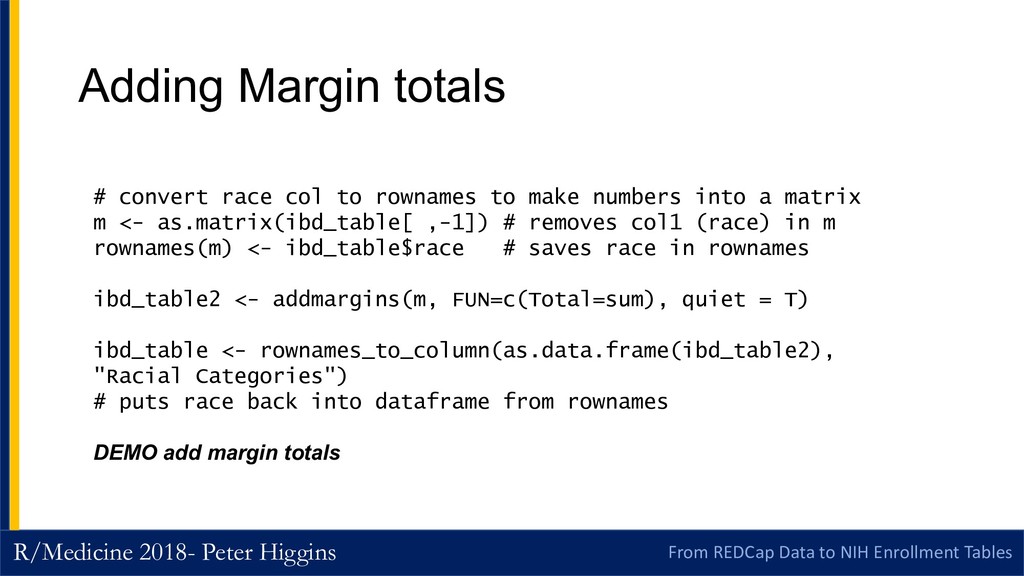
Tables Adding Margin totals # convert race col to rownames to make numbers into a matrix m <- as.matrix(ibd_table[ ,-1]) # removes col1 (race) in m rownames(m) <- ibd_table$race # saves race in rownames ibd_table2 <- addmargins(m, FUN=c(Total=sum), quiet = T) ibd_table <- rownames_to_column(as.data.frame(ibd_table2), "Racial Categories") # puts race back into dataframe from rownames DEMO add margin totals
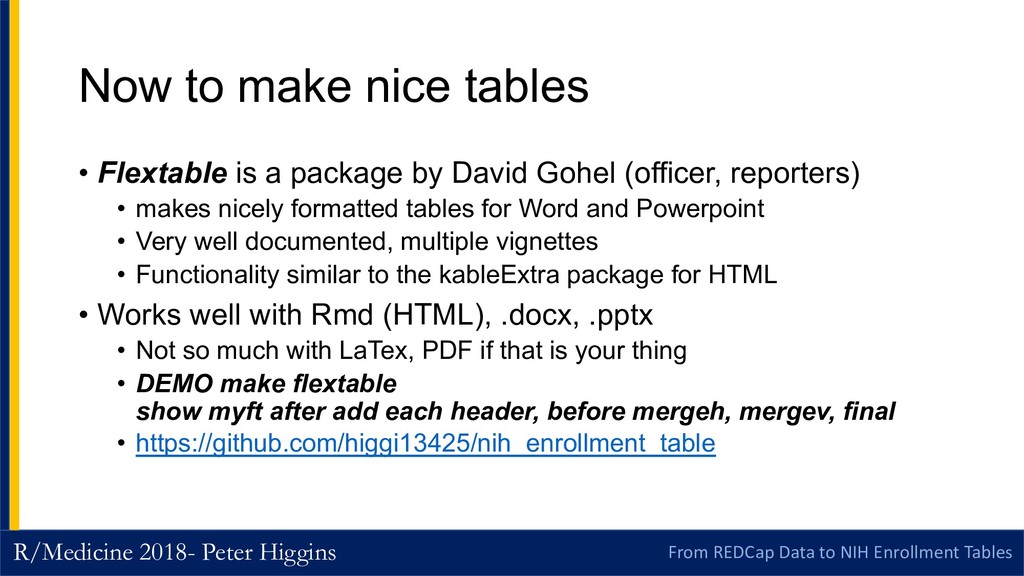
Tables Now to make nice tables • Flextable is a package by David Gohel (officer, reporters) • makes nicely formatted tables for Word and Powerpoint • Very well documented, multiple vignettes • Functionality similar to the kableExtra package for HTML • Works well with Rmd (HTML), .docx, .pptx • Not so much with LaTex, PDF if that is your thing • DEMO make flextable show myft after add each header, before mergeh, mergev, final • https://github.com/higgi13425/nih_enrollment_table