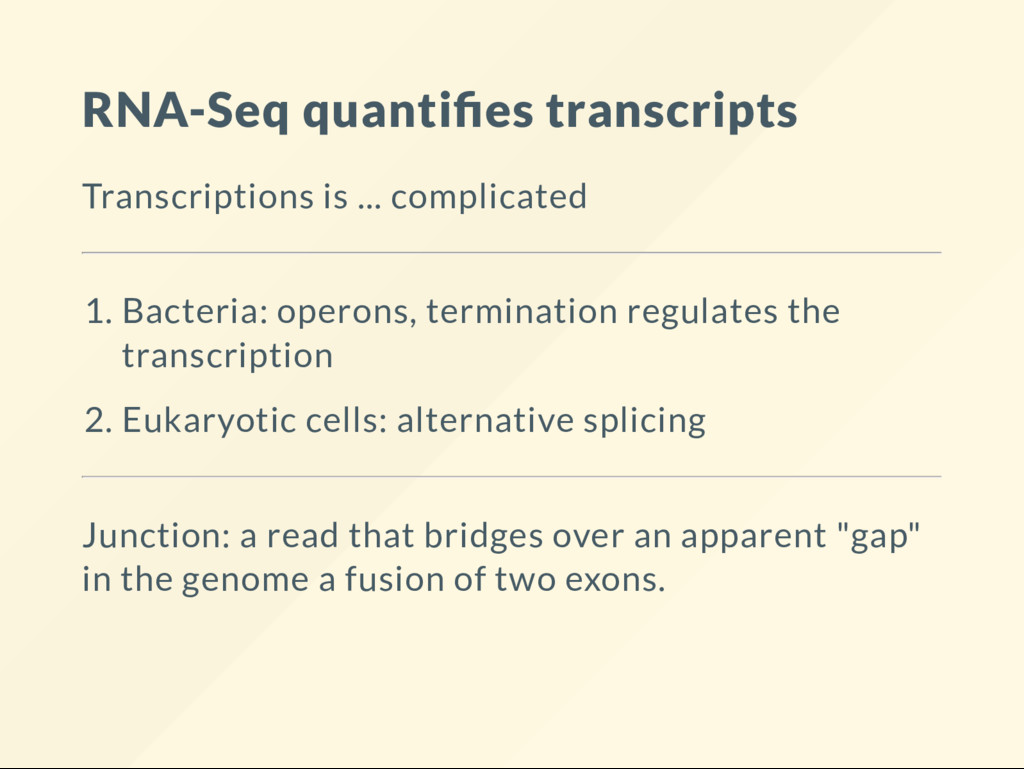
operons, termination regulates the transcription 2. Eukaryotic cells: alternative splicing Junction: a read that bridges over an apparent "gap" in the genome a fusion of two exons.
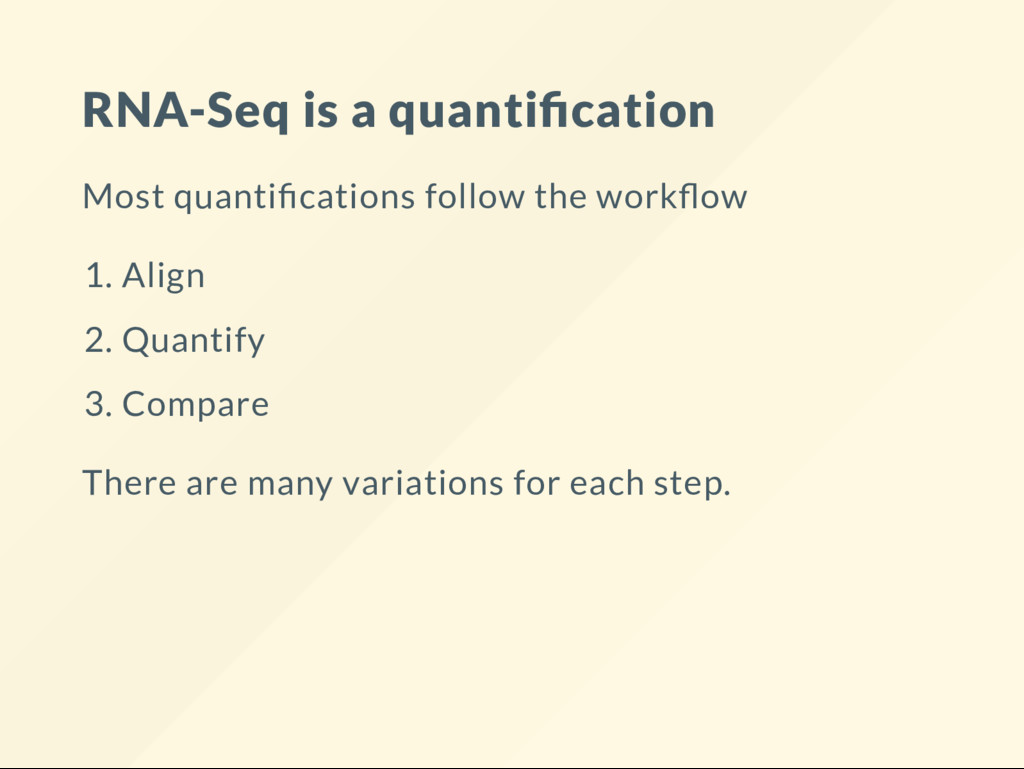
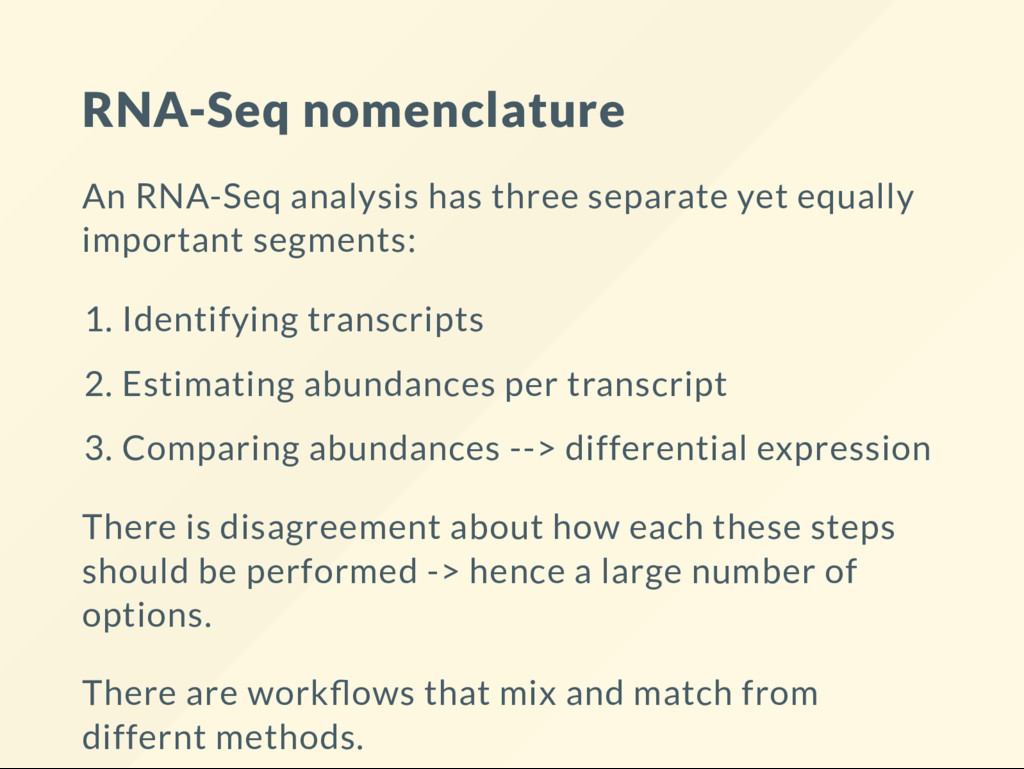
important segments: 1. Identifying transcripts 2. Estimating abundances per transcript 3. Comparing abundances --> differential expression There is disagreement about how each these steps should be performed -> hence a large number of options. There are work ows that mix and match from differnt methods.
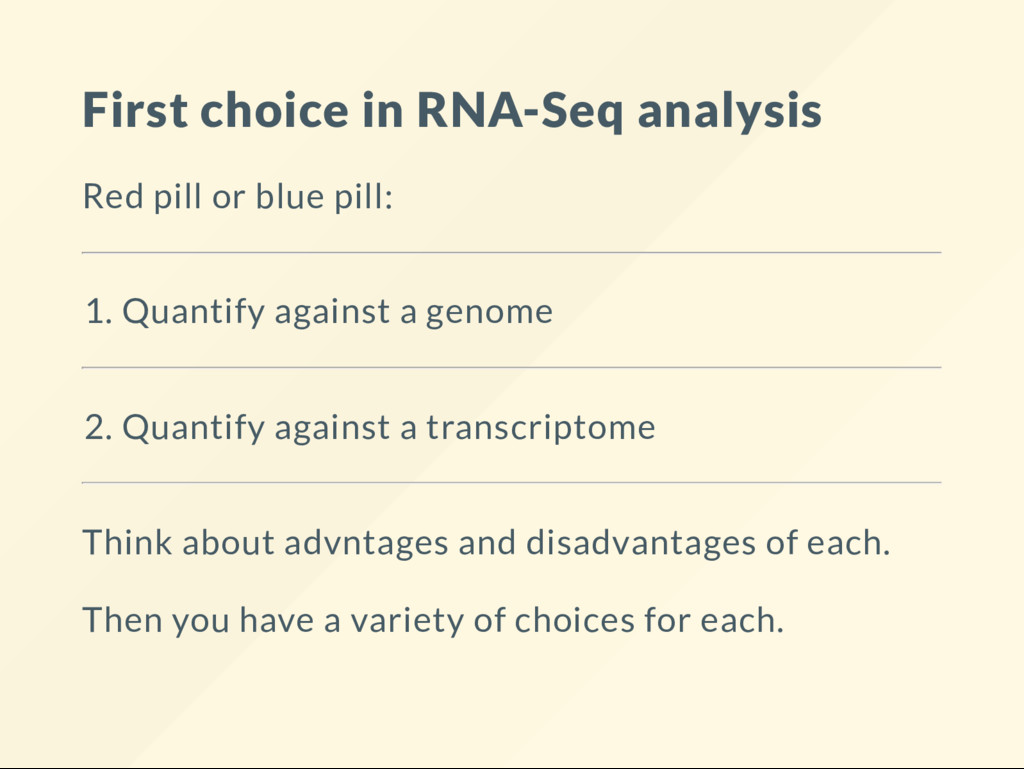
1. Quantify against a genome 2. Quantify against a transcriptome Think about advntages and disadvantages of each. Then you have a variety of choices for each.
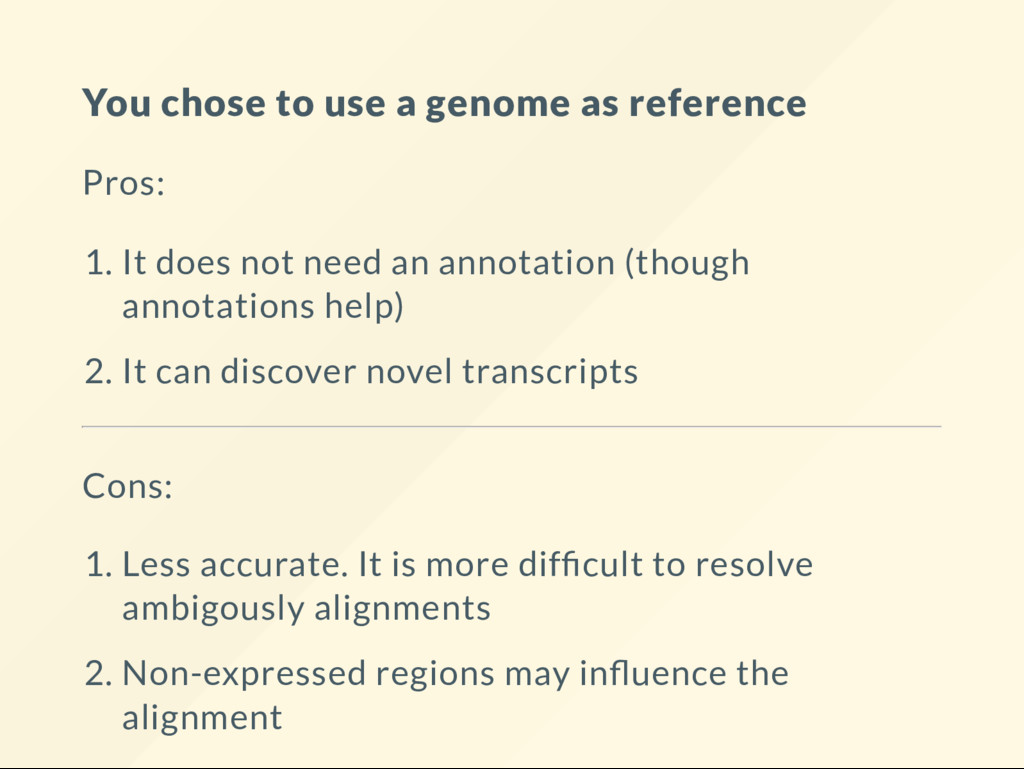
It does not need an annotation (though annotations help) 2. It can discover novel transcripts Cons: 1. Less accurate. It is more dif cult to resolve ambigously alignments 2. Non-expressed regions may in uence the alignment
require a fully assembled accurate genome 2. Better quanti cation for similar transrcipt Cons: 1. Can't nd novel transcripts 2. Requires good quality transcript information.
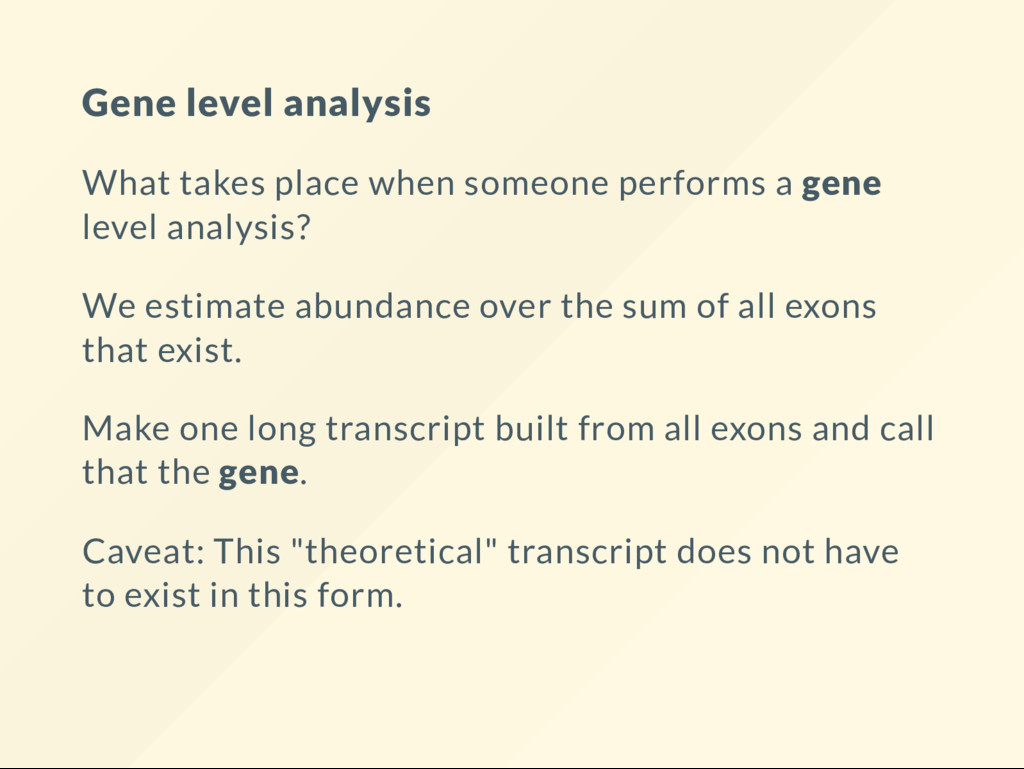
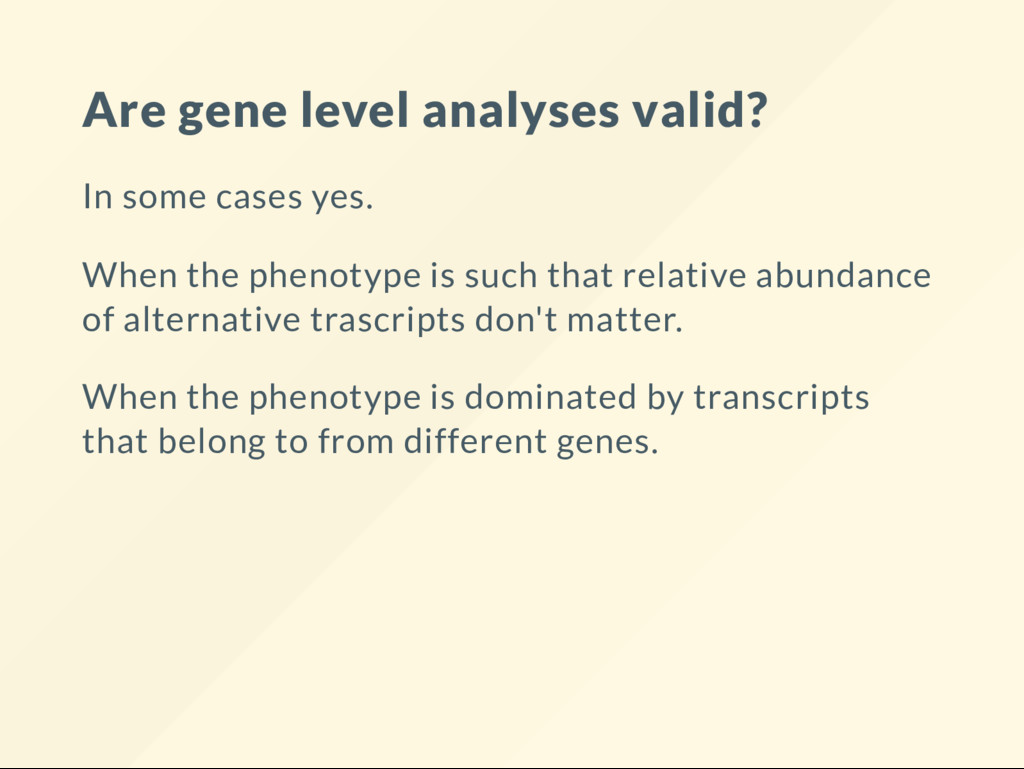
gene level analysis? We estimate abundance over the sum of all exons that exist. Make one long transcript built from all exons and call that the gene. Caveat: This "theoretical" transcript does not have to exist in this form.
the phenotype is such that relative abundance of alternative trascripts don't matter. When the phenotype is dominated by transcripts that belong to from different genes.
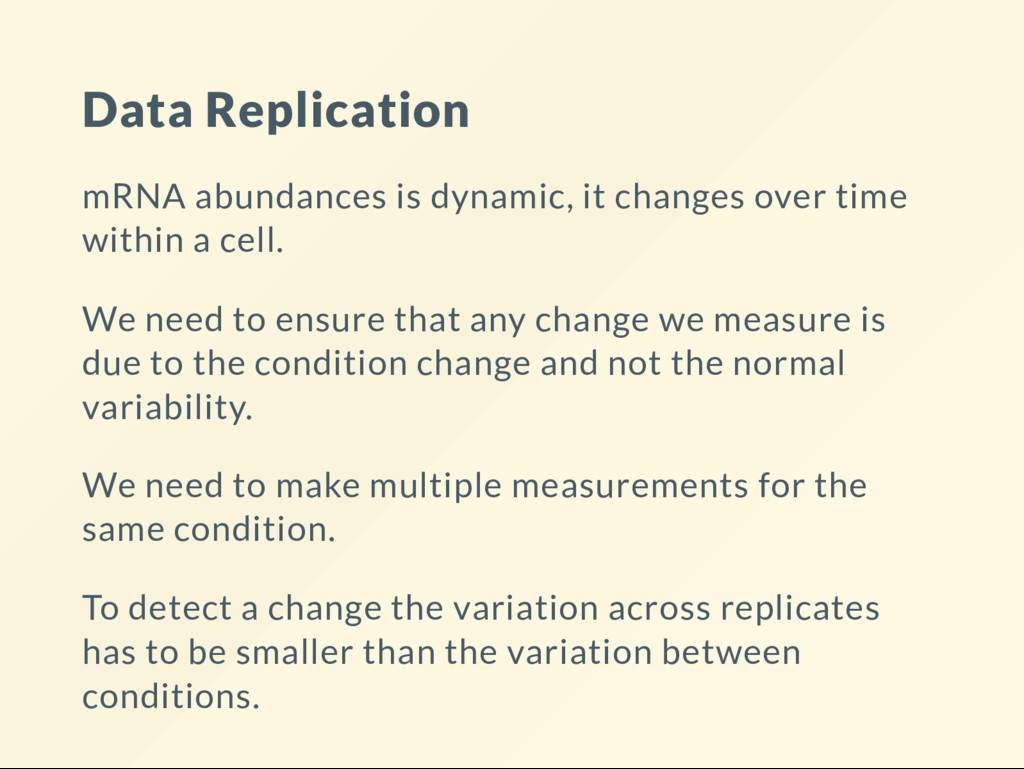
within a cell. We need to ensure that any change we measure is due to the condition change and not the normal variability. We need to make multiple measurements for the same condition. To detect a change the variation across replicates has to be smaller than the variation between conditions.
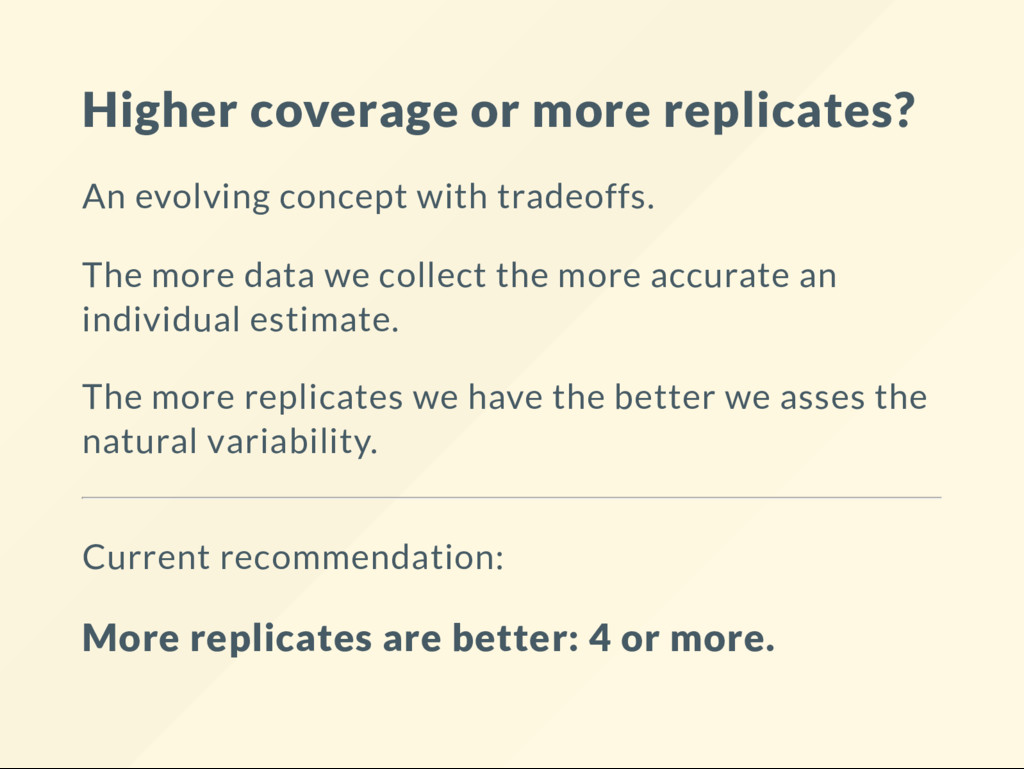
The more data we collect the more accurate an individual estimate. The more replicates we have the better we asses the natural variability. Current recommendation: More replicates are better: 4 or more.
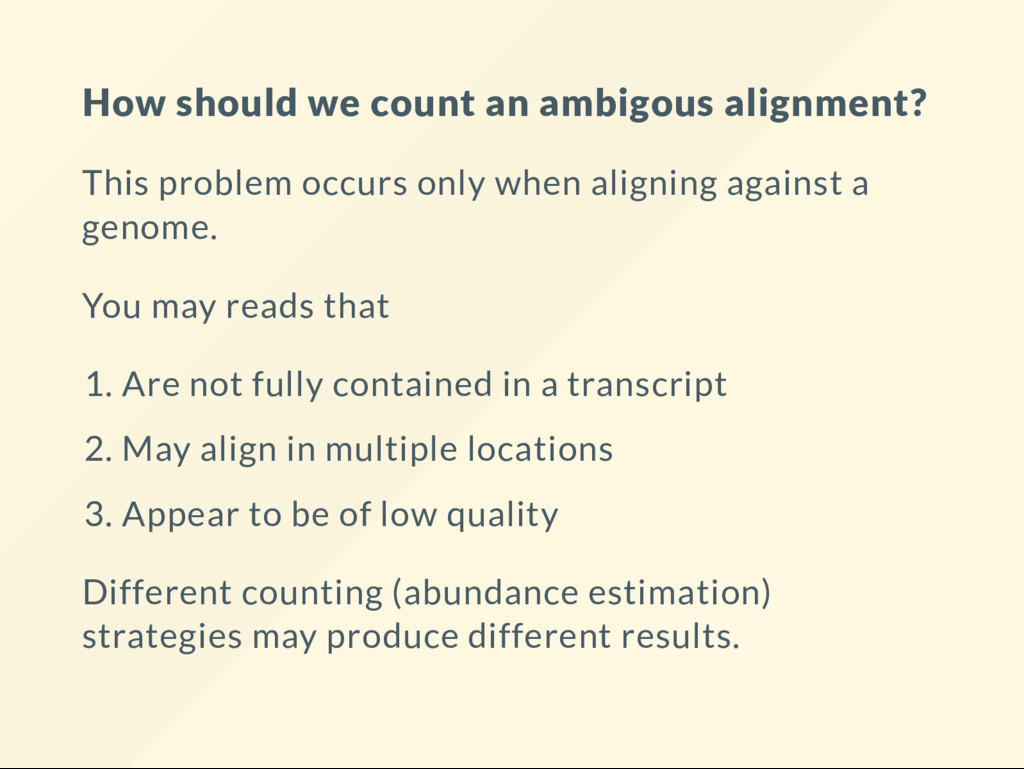
only when aligning against a genome. You may reads that 1. Are not fully contained in a transcript 2. May align in multiple locations 3. Appear to be of low quality Different counting (abundance estimation) strategies may produce different results.
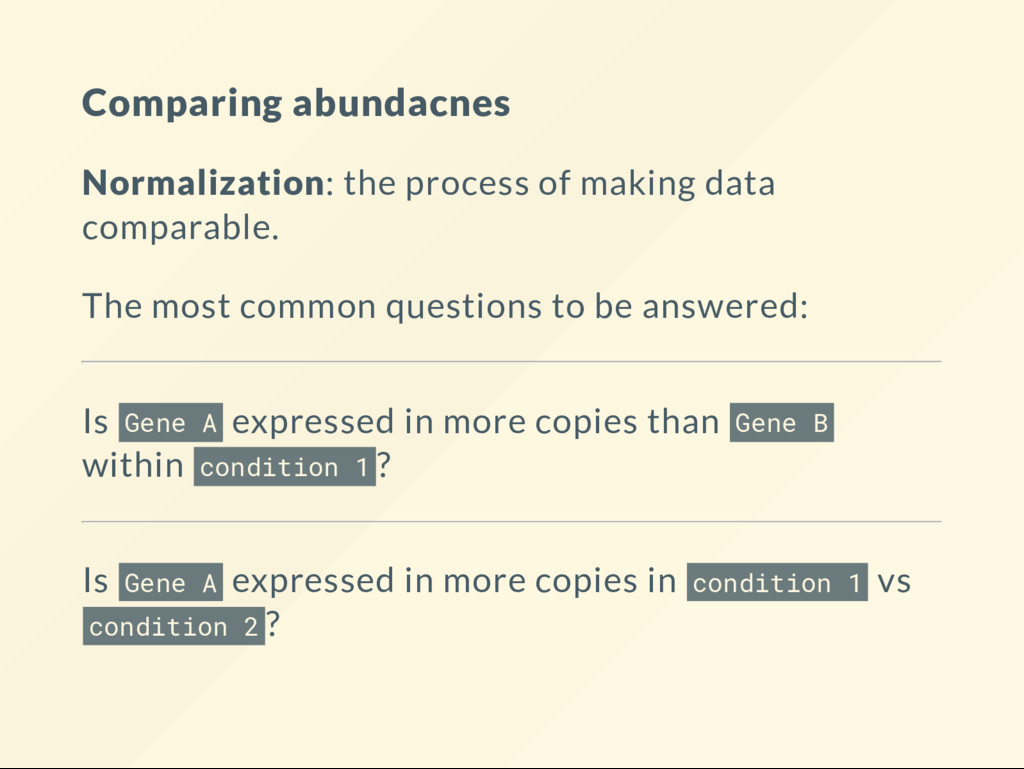
most common questions to be answered: Is Gene A expressed in more copies than Gene B within condition 1 ? Is Gene A expressed in more copies in condition 1 vs condition 2 ?
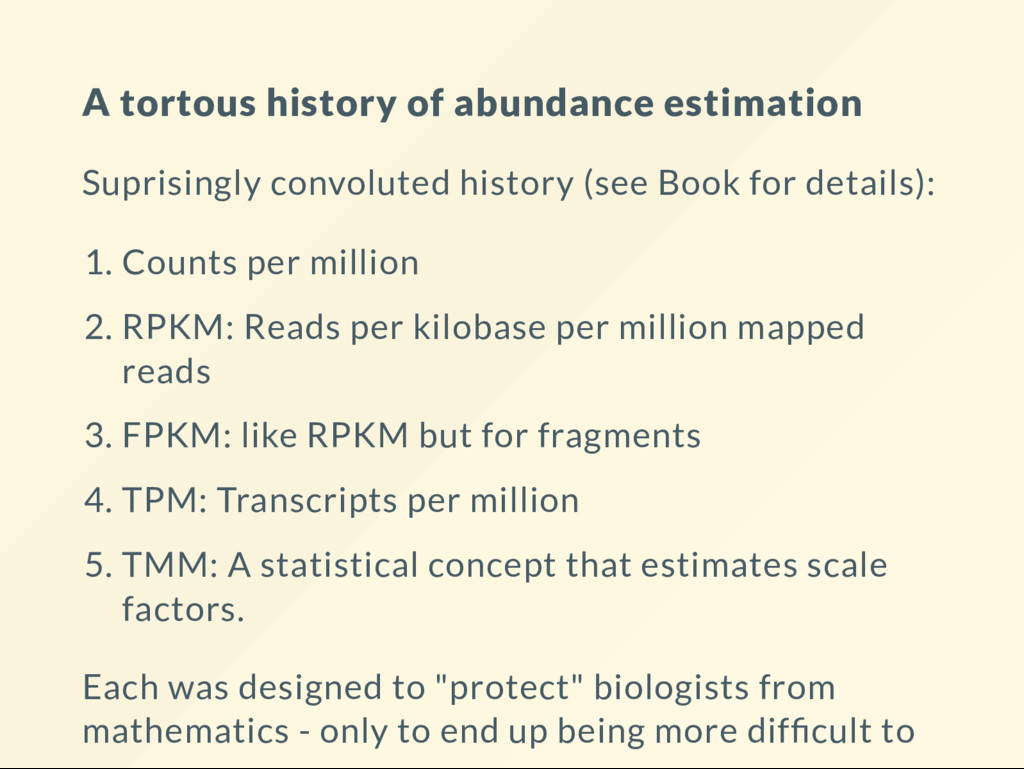
Book for details): 1. Counts per million 2. RPKM: Reads per kilobase per million mapped reads 3. FPKM: like RPKM but for fragments 4. TPM: Transcripts per million 5. TMM: A statistical concept that estimates scale factors. Each was designed to "protect" biologists from mathematics - only to end up being more dif cult to