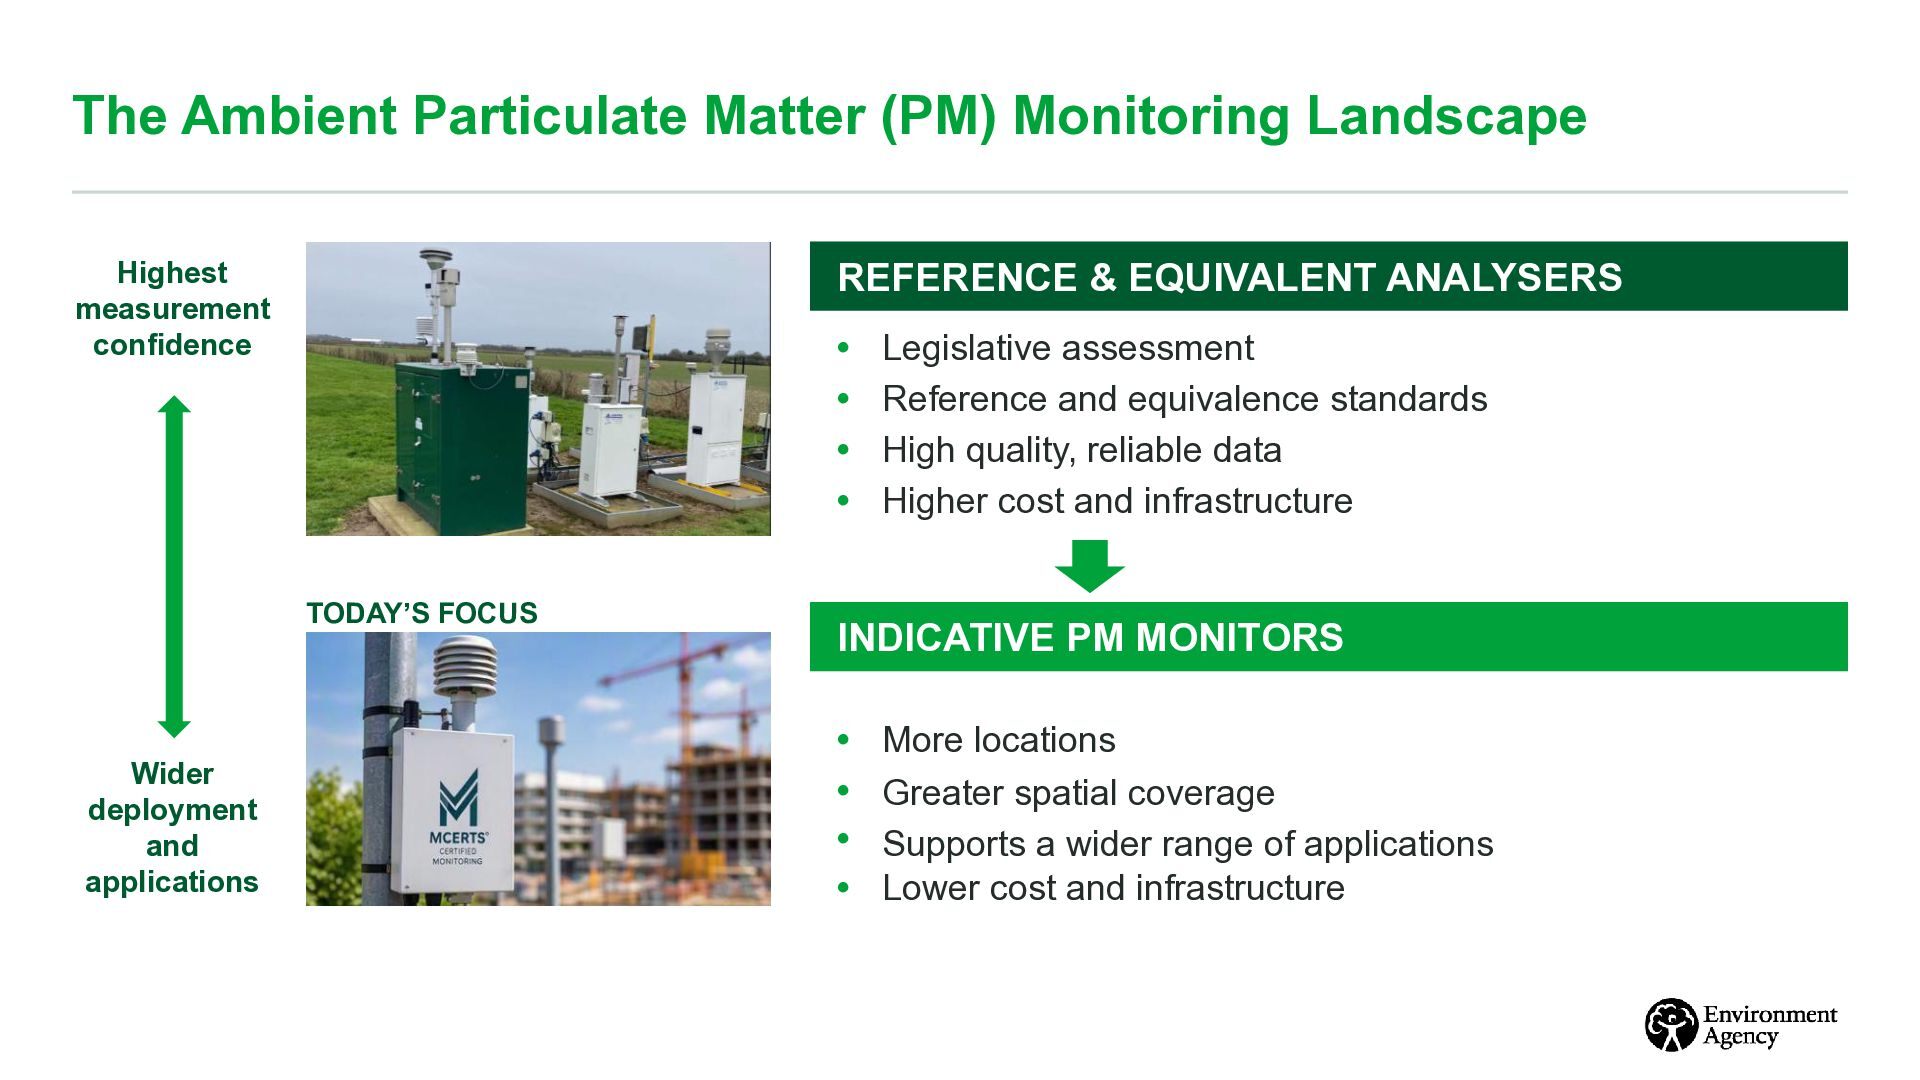
ANALYSERS Highest measurement confidence • • • • TODAY’S FOCUS Wider deployment and applications Legislative assessment Reference and equivalence standards High quality, reliable data Higher cost and infrastructure INDICATIVE PM MONITORS • • • • More locations Greater spatial coverage Supports a wider range of applications Lower cost and infrastructure
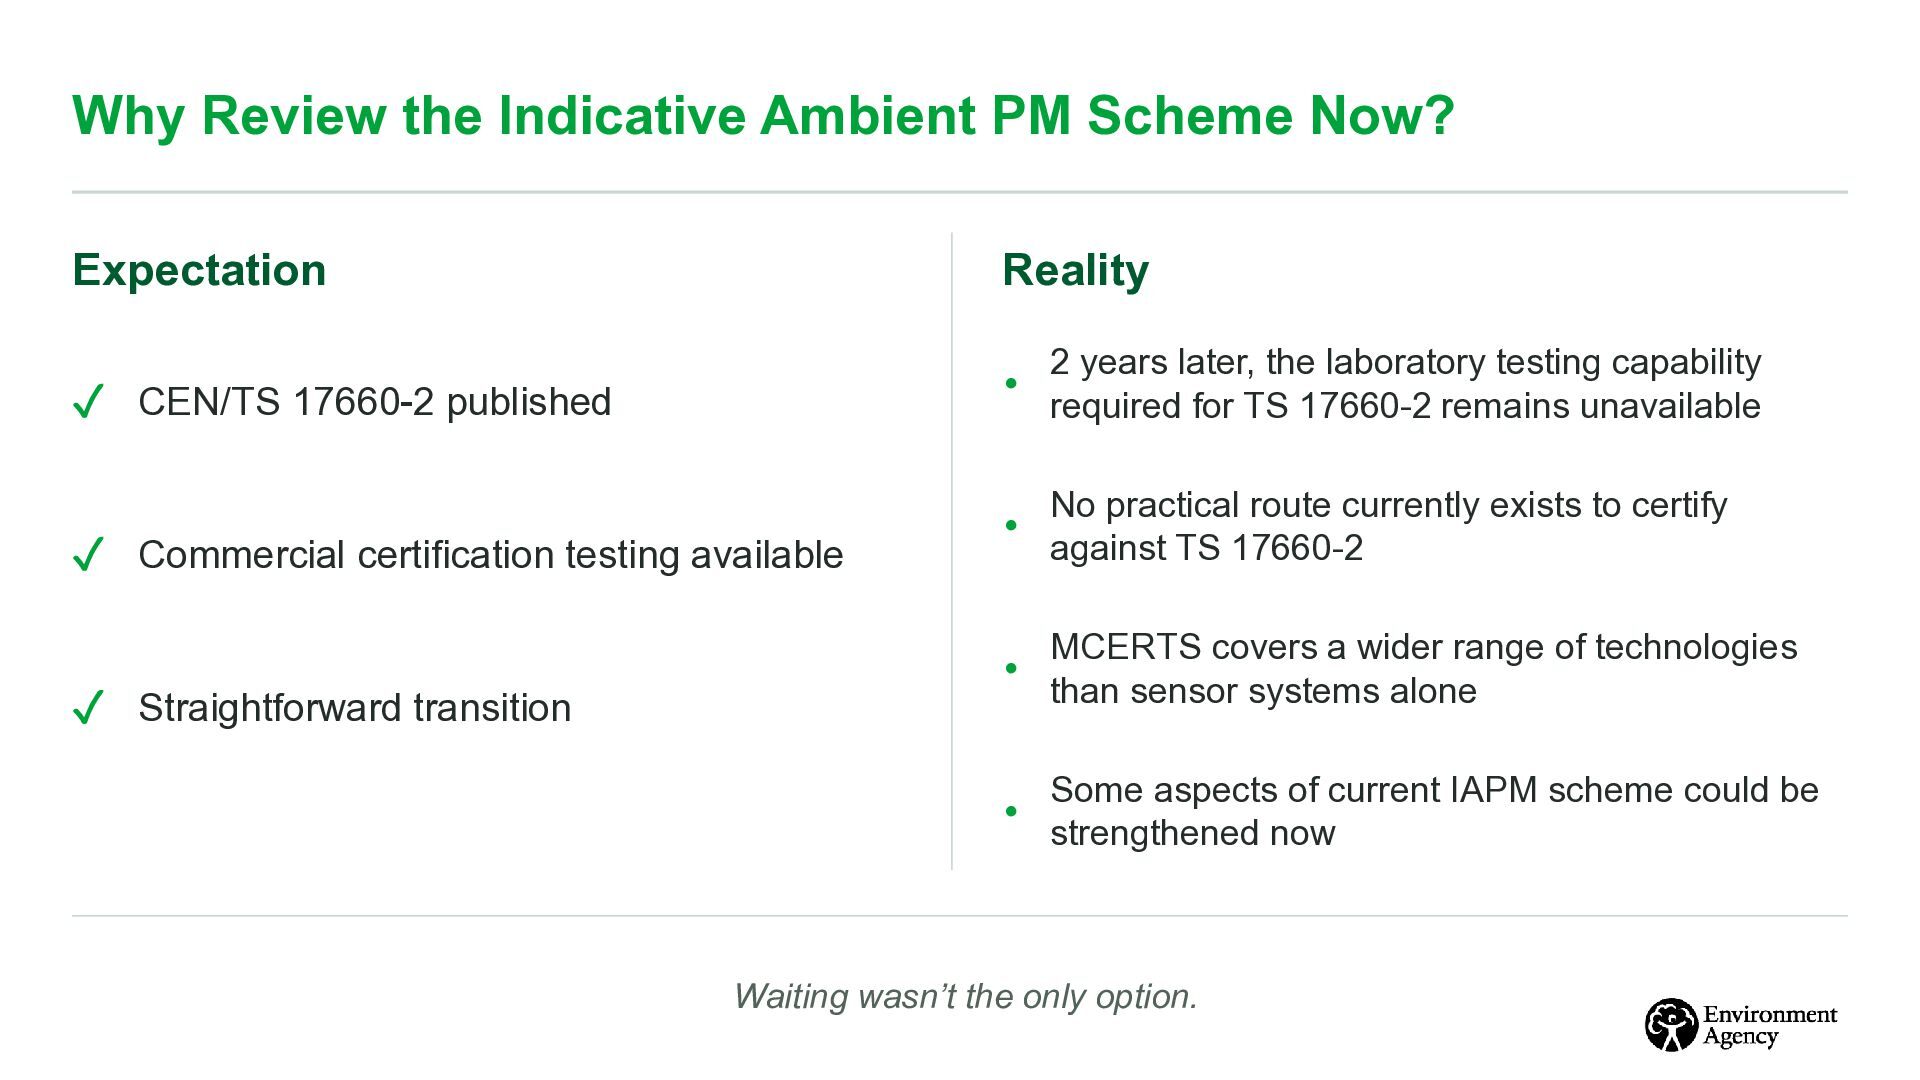
✓ CEN/TS 17660-2 published • 2 years later, the laboratory testing capability required for TS 17660-2 remains unavailable ✓ Commercial certification testing available • No practical route currently exists to certify against TS 17660-2 • MCERTS covers a wider range of technologies than sensor systems alone • Some aspects of current IAPM scheme could be strengthened now ✓ Straightforward transition Waiting wasn’t the only option.
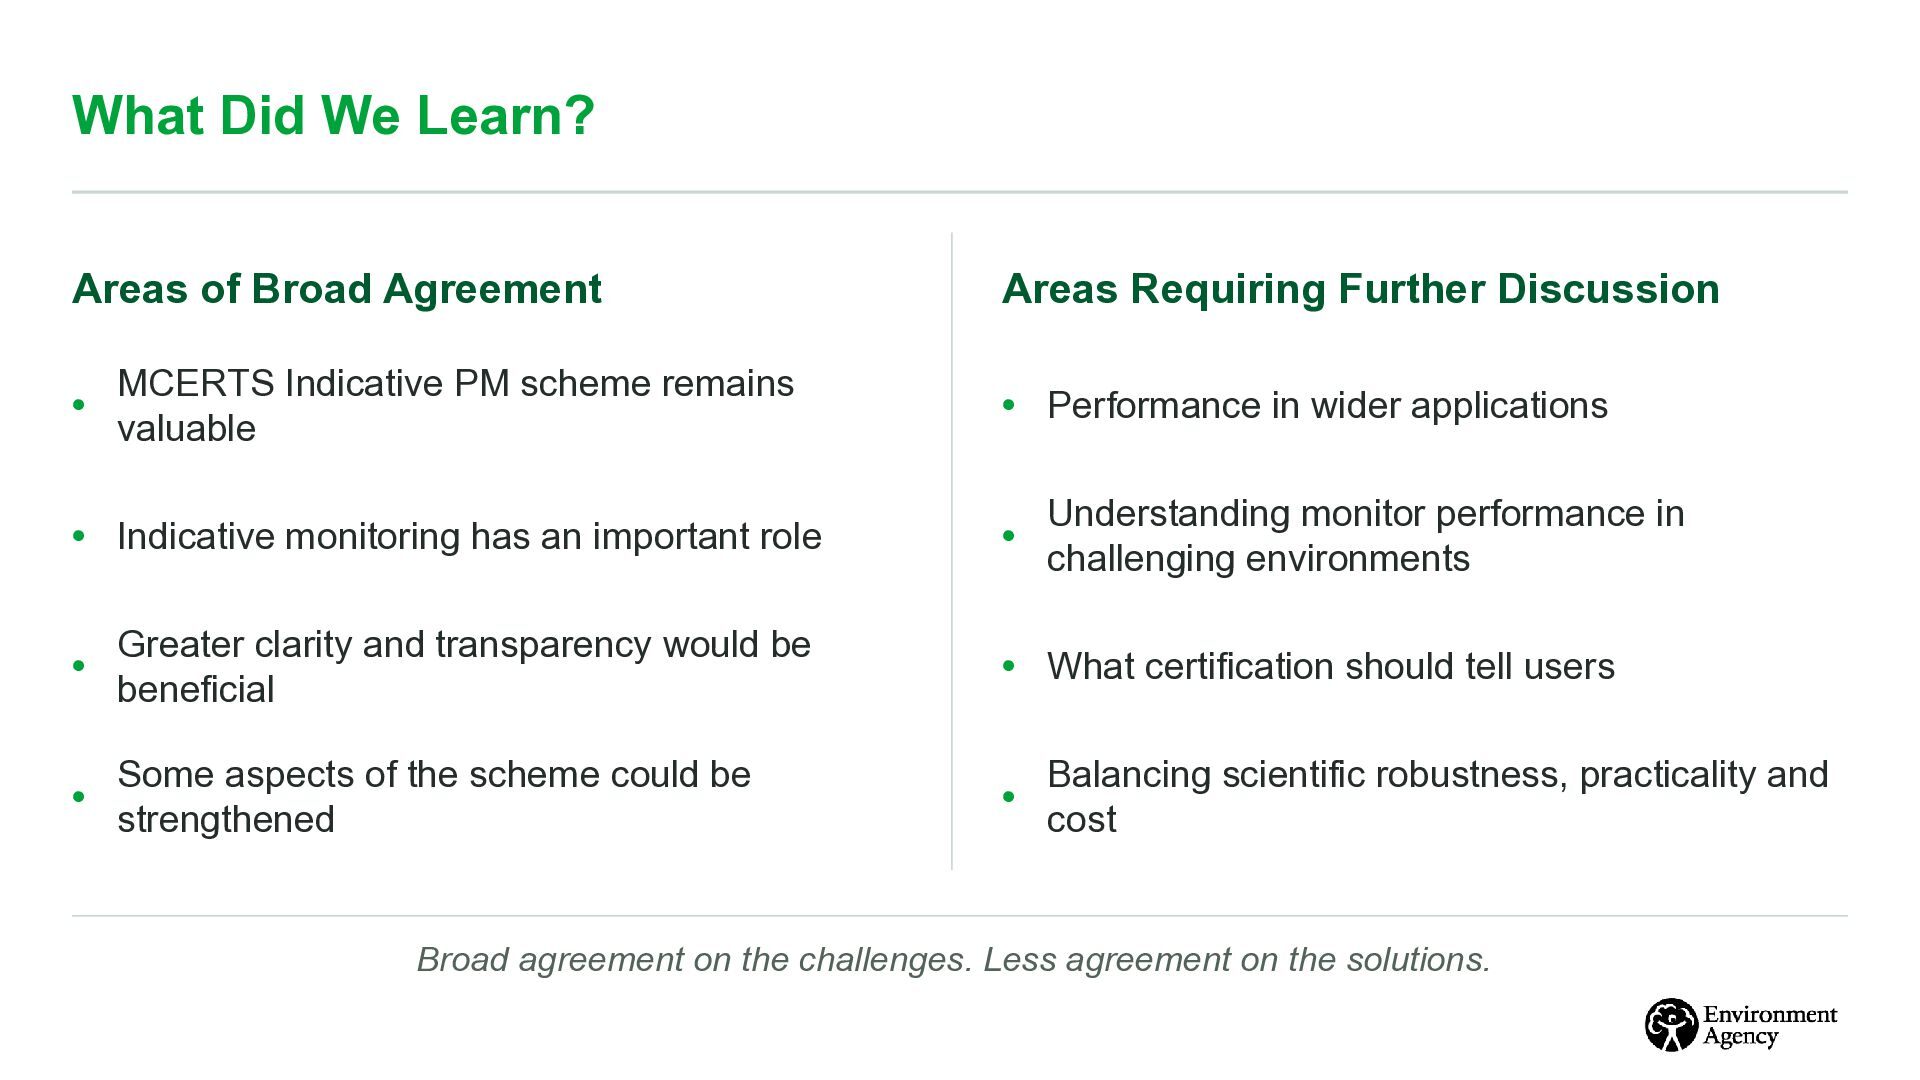
Indicative PM scheme remains valuable • Indicative monitoring has an important role Areas Requiring Further Discussion • Performance in wider applications • Understanding monitor performance in challenging environments • Greater clarity and transparency would be beneficial • What certification should tell users • Some aspects of the scheme could be strengthened • Balancing scientific robustness, practicality and cost Broad agreement on the challenges. Less agreement on the solutions.
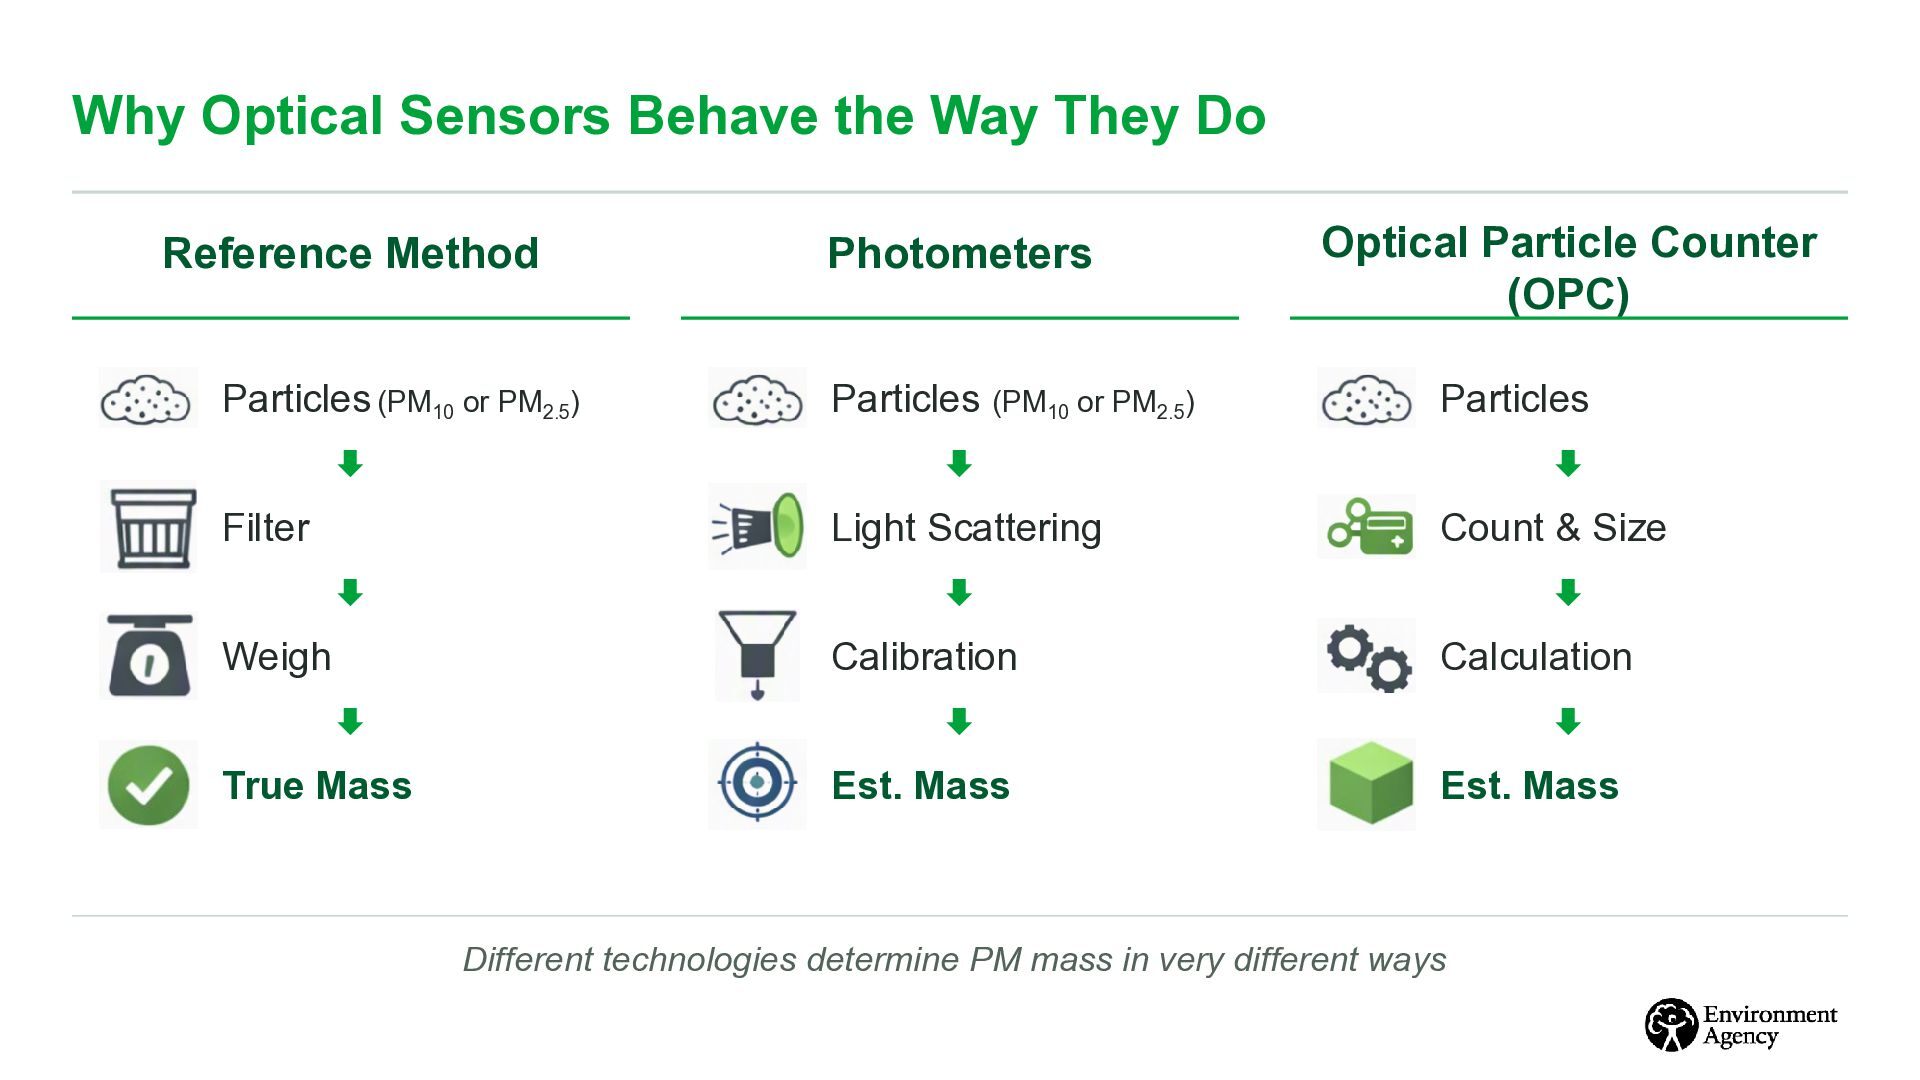
Photometers Optical Particle Counter (OPC) Particles (PM10 or PM2.5) Particles (PM10 or PM2.5) Particles Filter Light Scattering Count & Size Weigh Calibration Calculation True Mass Est. Mass Est. Mass Different technologies determine PM mass in very different ways
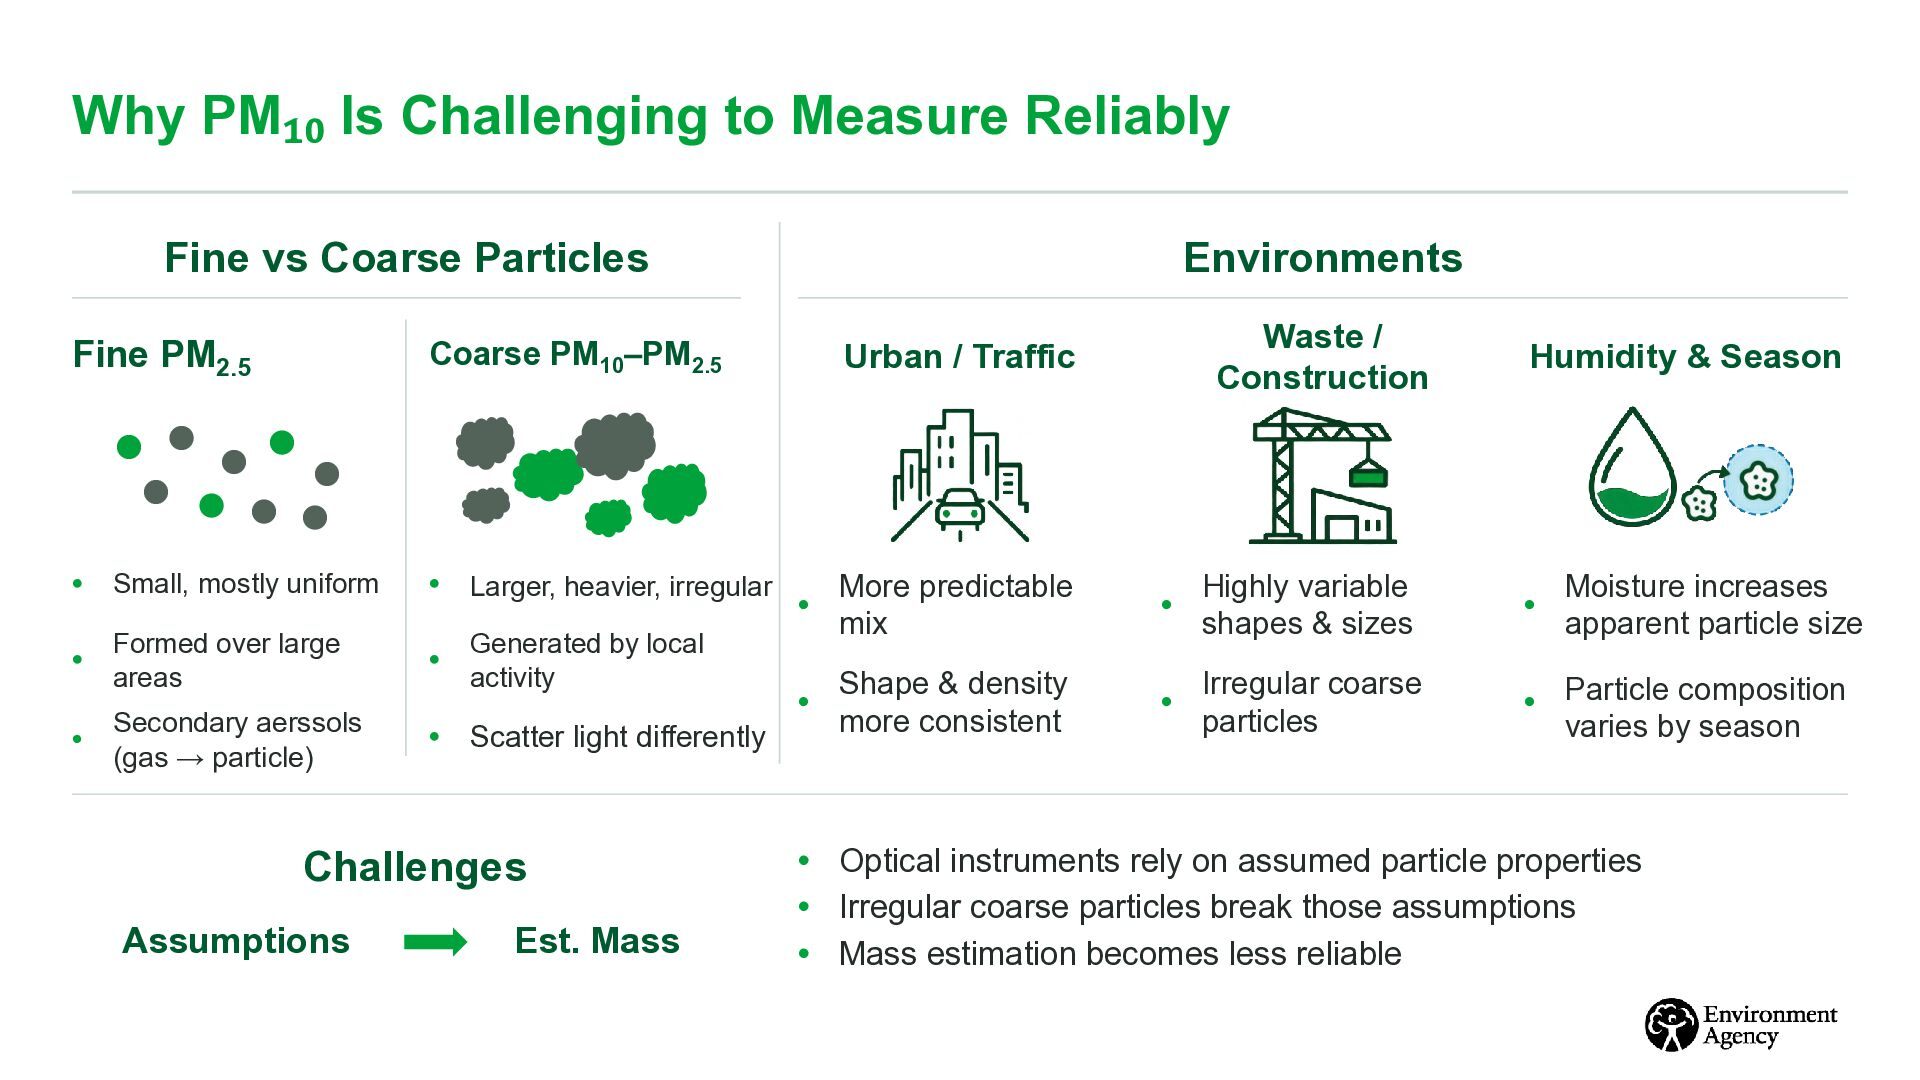
Particles Fine PM2.5 Coarse PM10–PM2.5 • Small, mostly uniform • Larger, heavier, irregular • Formed over large areas • Secondary aerssols (gas → particle) • Scatter light differently • Generated by local activity Challenges Assumptions Est. Mass Environments Urban / Traffic Waste / Construction Humidity & Season • More predictable mix • Highly variable shapes & sizes • Moisture increases apparent particle size • Shape & density more consistent • Irregular coarse particles • Particle composition varies by season • Optical instruments rely on assumed particle properties • Irregular coarse particles break those assumptions • Mass estimation becomes less reliable
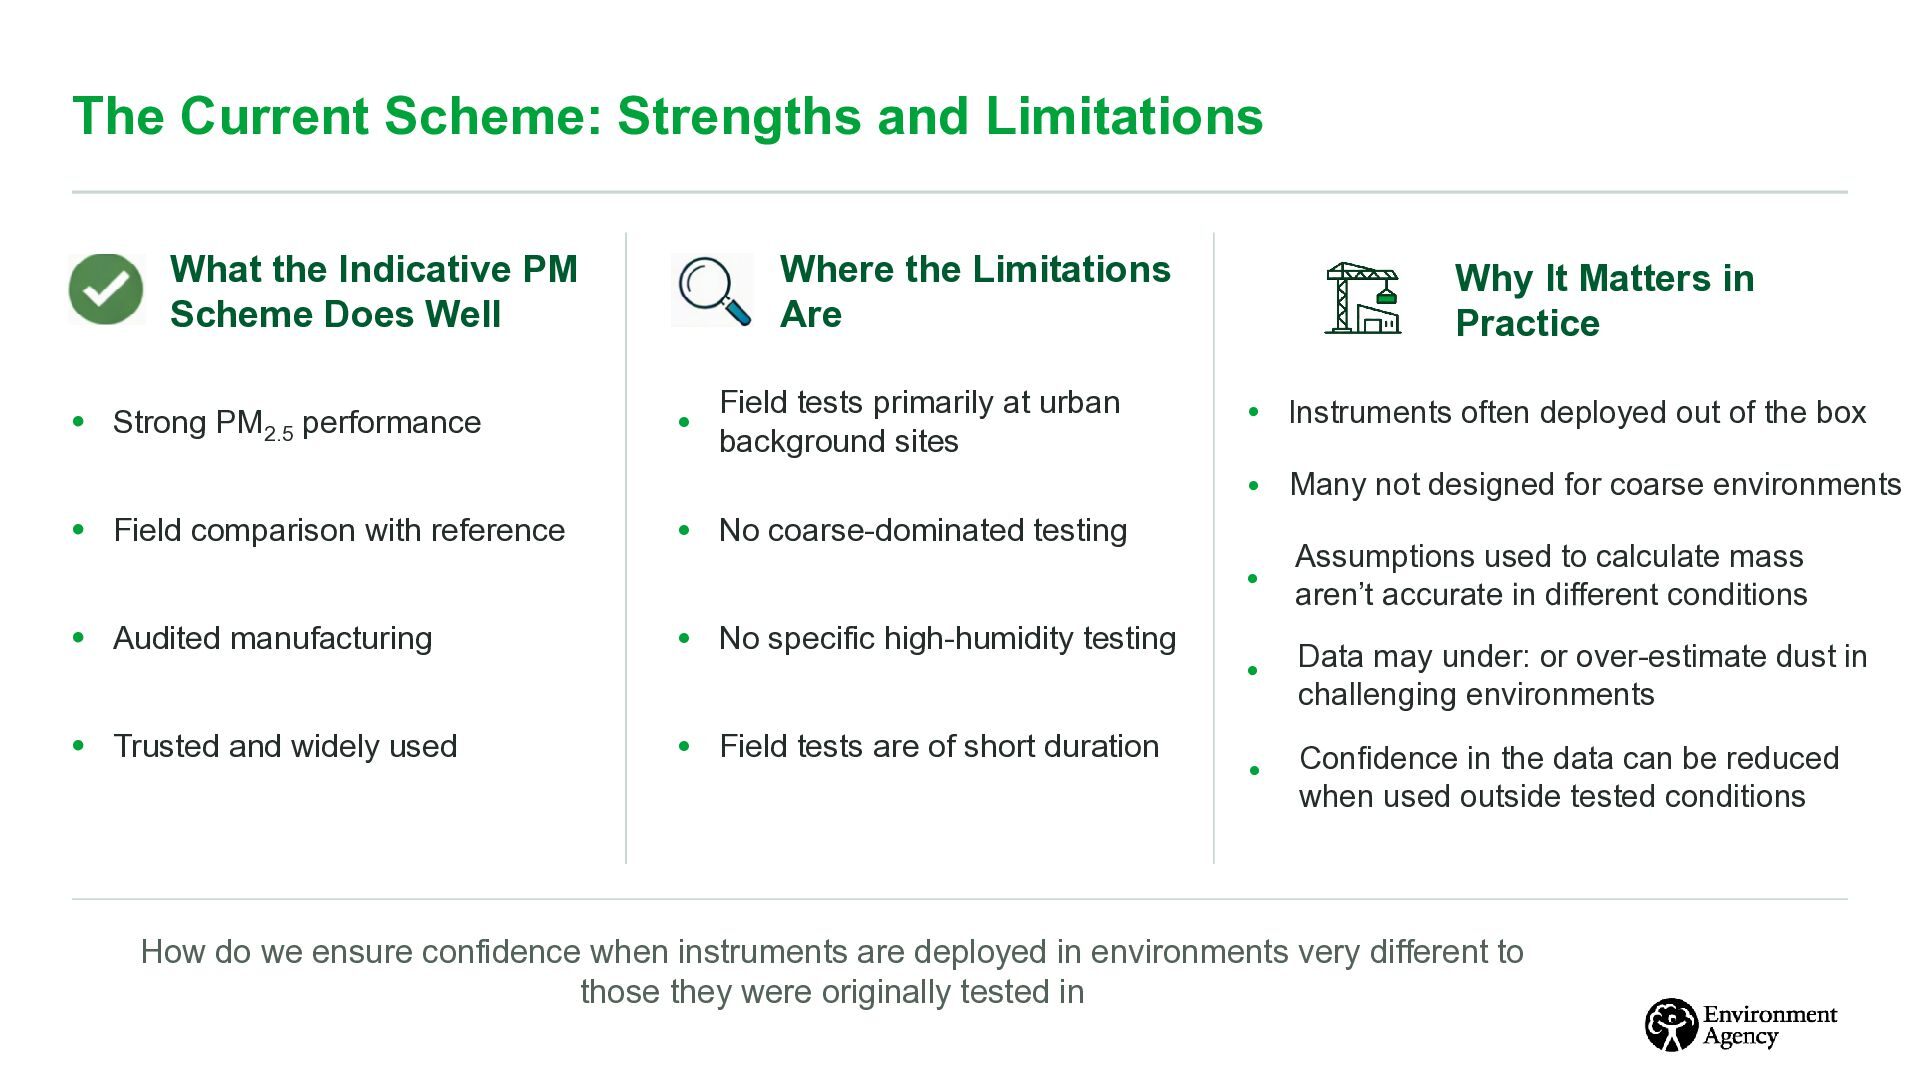
Scheme Does Well • Strong PM2.5 performance Where the Limitations Are • Field tests primarily at urban background sites Why It Matters in Practice • Instruments often deployed out of the box • Many not designed for coarse environments • Field comparison with reference • No coarse-dominated testing • Audited manufacturing • No specific high-humidity testing • Trusted and widely used • Field tests are of short duration • Assumptions used to calculate mass aren’t accurate in different conditions • Data may under: or over-estimate dust in challenging environments • Confidence in the data can be reduced when used outside tested conditions How do we ensure confidence when instruments are deployed in environments very different to those they were originally tested in
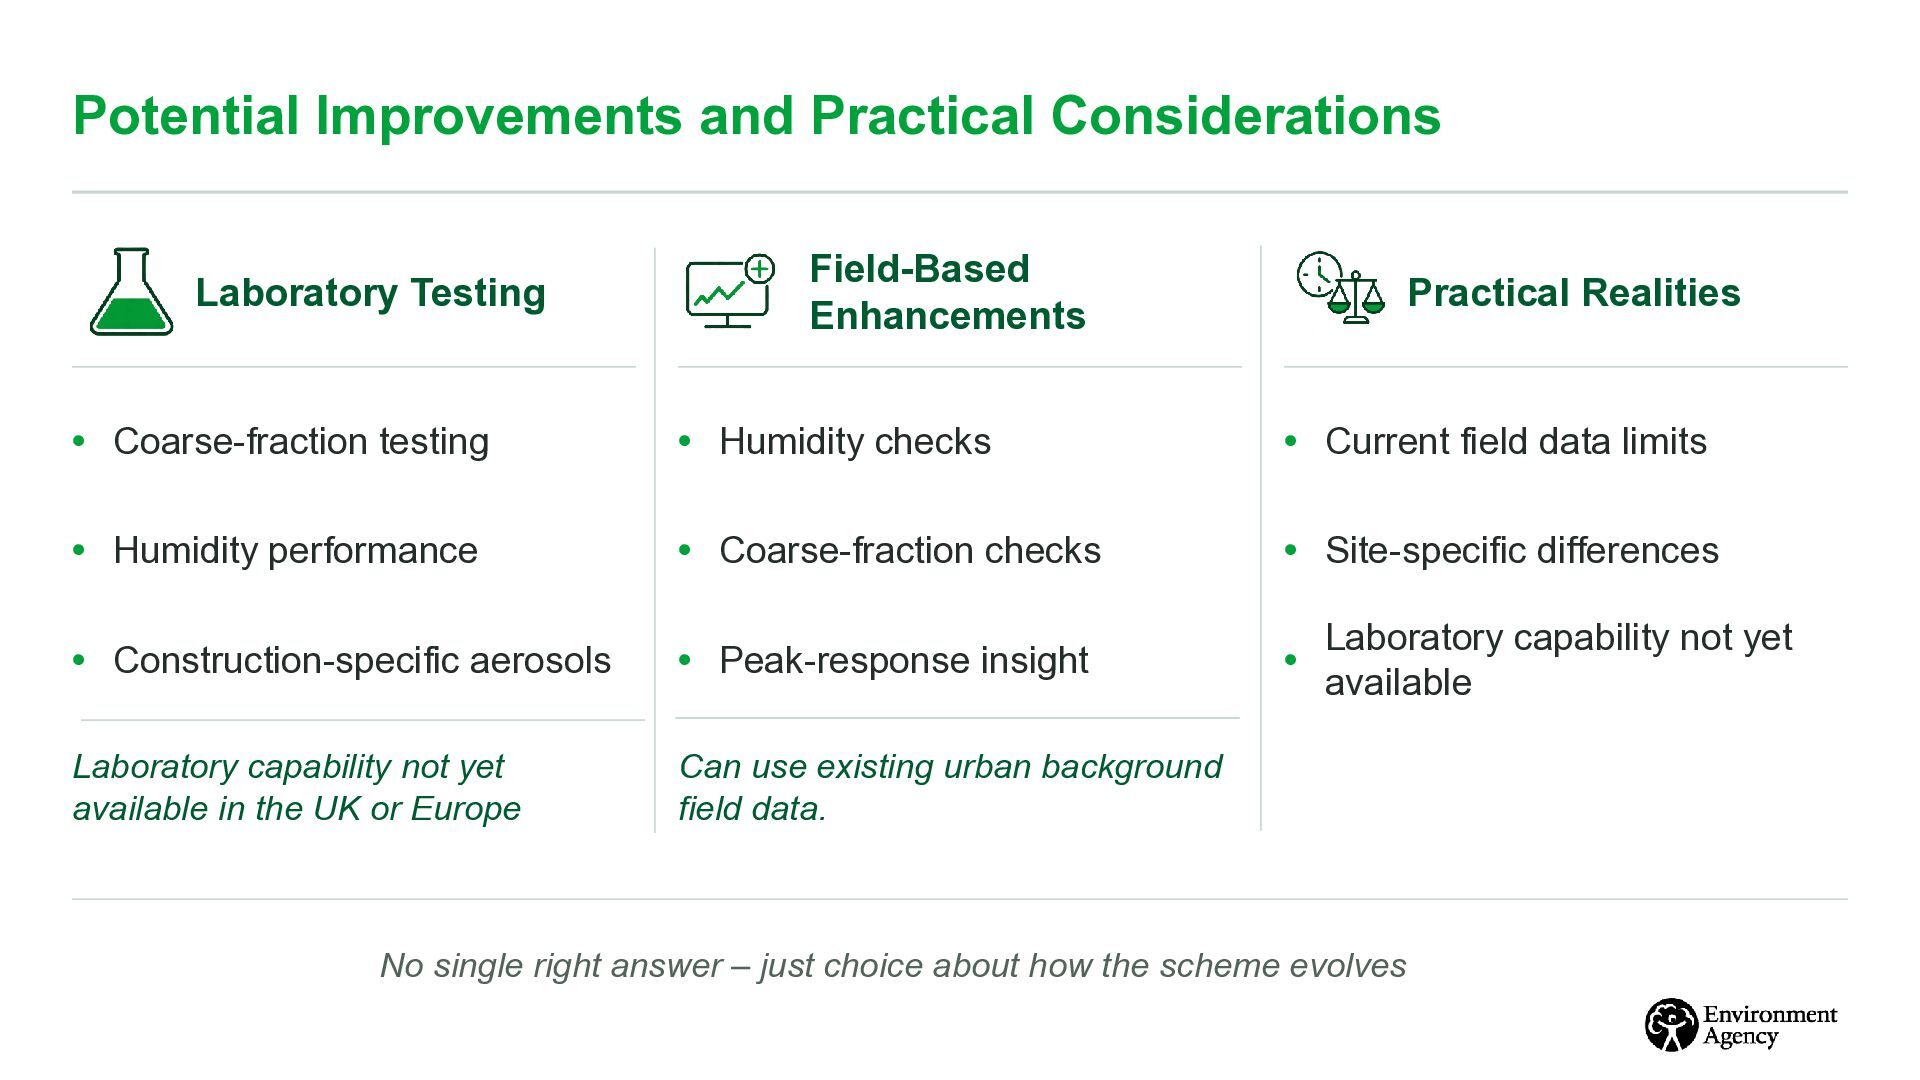
Realities • Coarse-fraction testing • Humidity checks • Current field data limits • Humidity performance • Coarse-fraction checks • Site-specific differences • Construction-specific aerosols • Peak-response insight • Laboratory capability not yet available in the UK or Europe Can use existing urban background field data. Laboratory capability not yet available No single right answer – just choice about how the scheme evolves
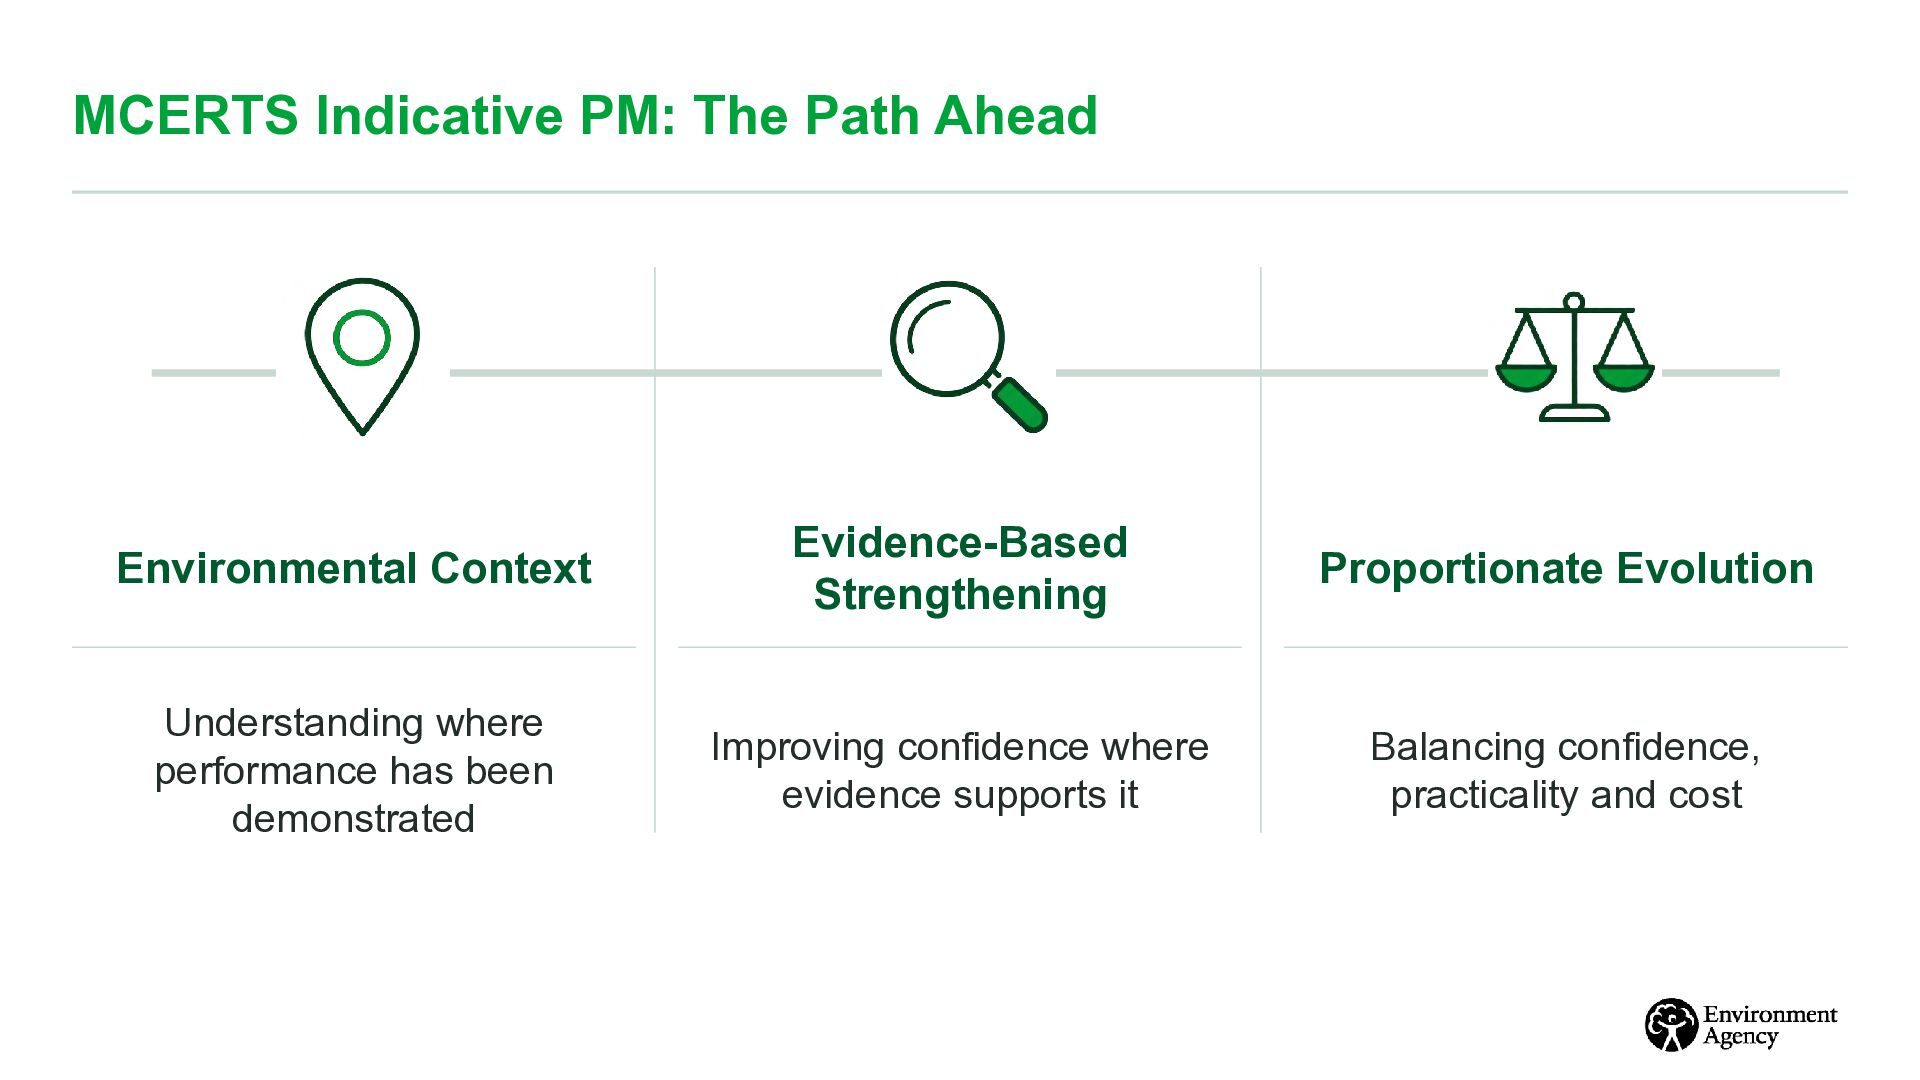
Proportionate Evolution Understanding where performance has been demonstrated Improving confidence where evidence supports it Balancing confidence, practicality and cost


 iesevents
 cargoodrich
 lauravandoore
 shpigford
 cassininazir
 lara
 tmiket
 reverentgeek
 stephaniewalter
 ipullrank
 inesmontani
 codingconduct