a urban catchment case study Ilaria Prosdocimi - [email protected] Centre for Ecology & Hydrology – UK Joint work with Thomas Kjeldsen and James Miller FloodChange Workshop Vienna, October 2015
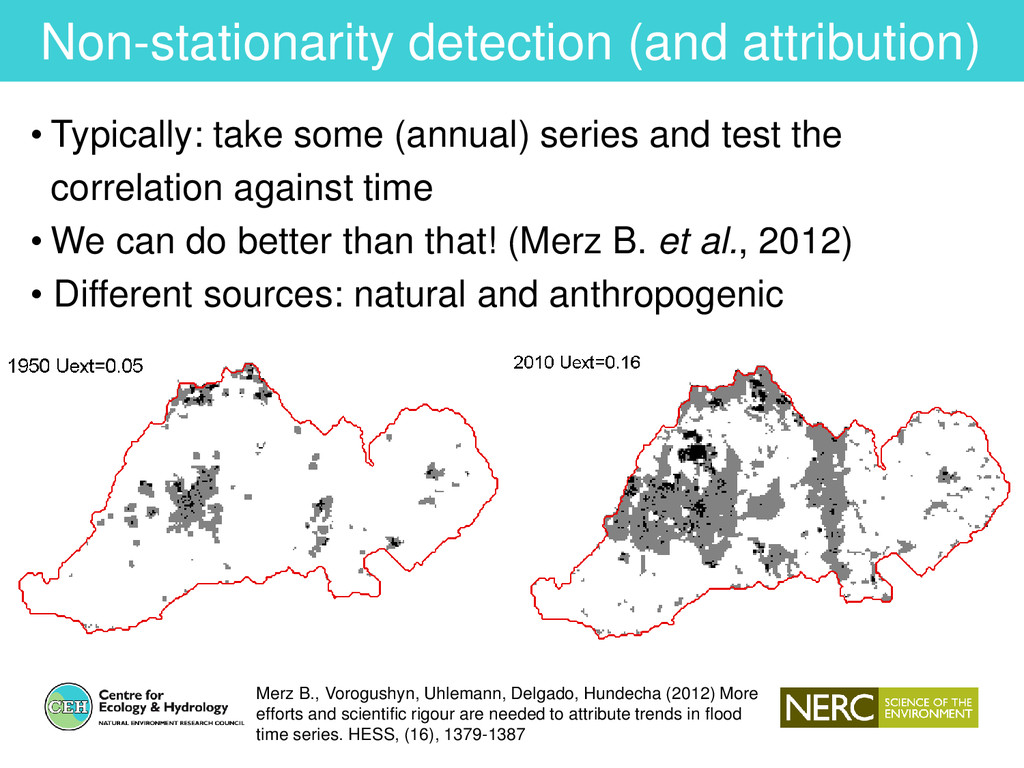
and test the correlation against time • We can do better than that! (Merz B. et al., 2012) • Different sources: natural and anthropogenic Merz B., Vorogushyn, Uhlemann, Delgado, Hundecha (2012) More efforts and scientific rigour are needed to attribute trends in flood time series. HESS, (16), 1379-1387
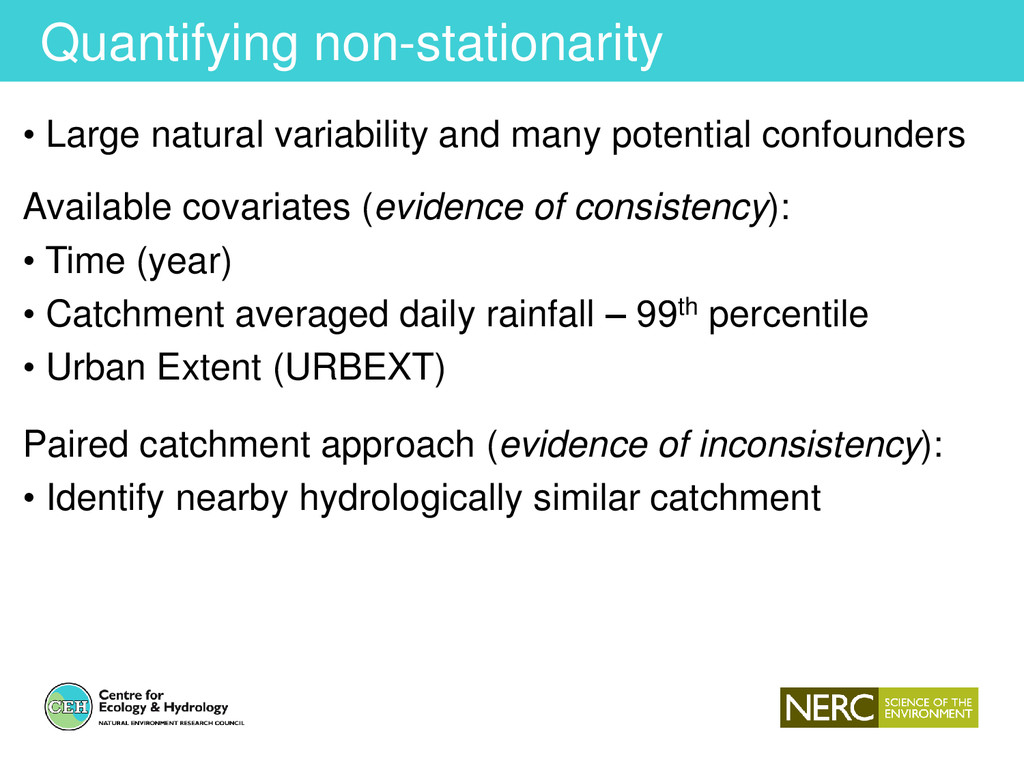
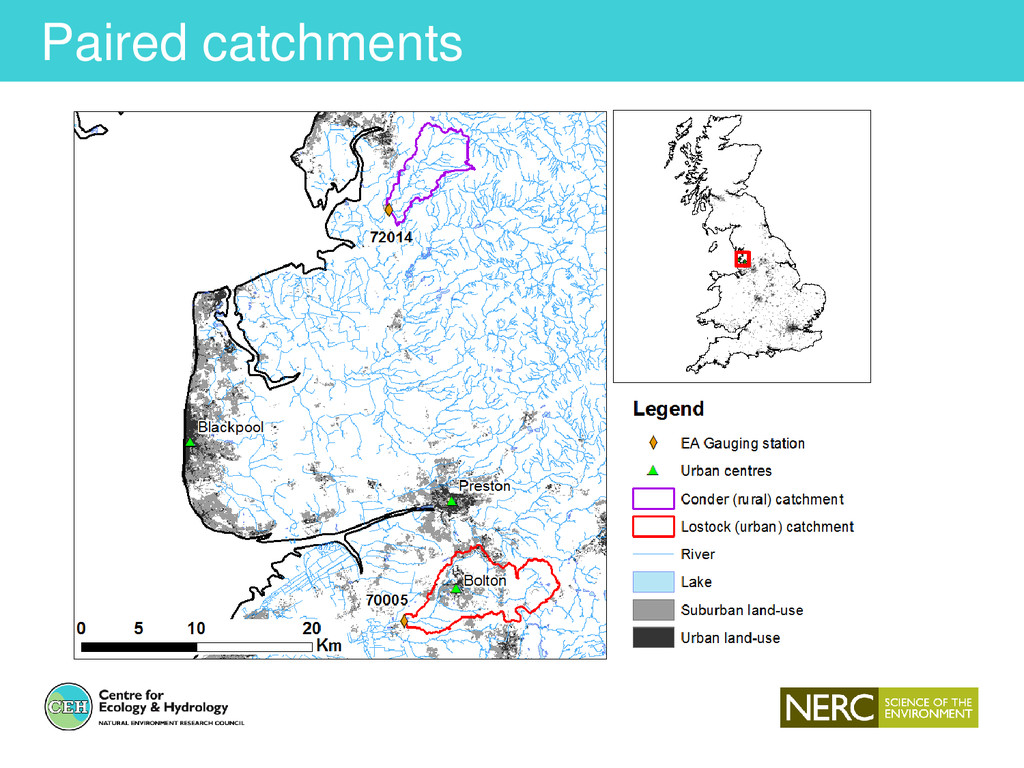
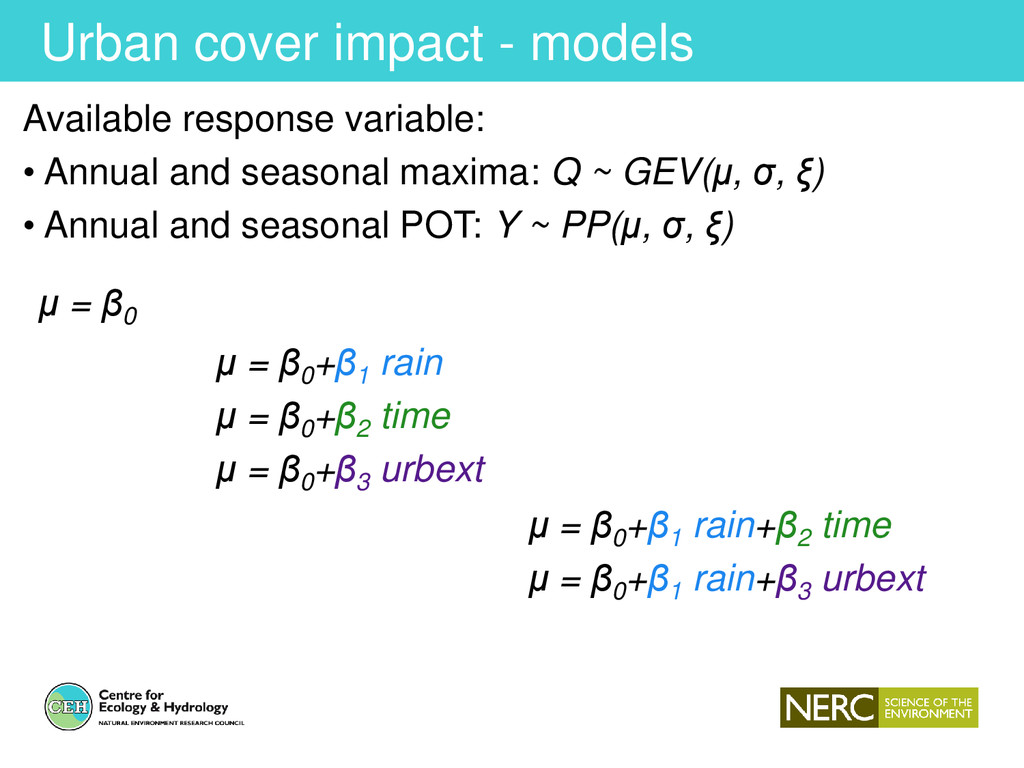
nearby hydrologically similar catchment Available covariates (evidence of consistency): • Time (year) • Catchment averaged daily rainfall – 99th percentile • Urban Extent (URBEXT) • Large natural variability and many potential confounders
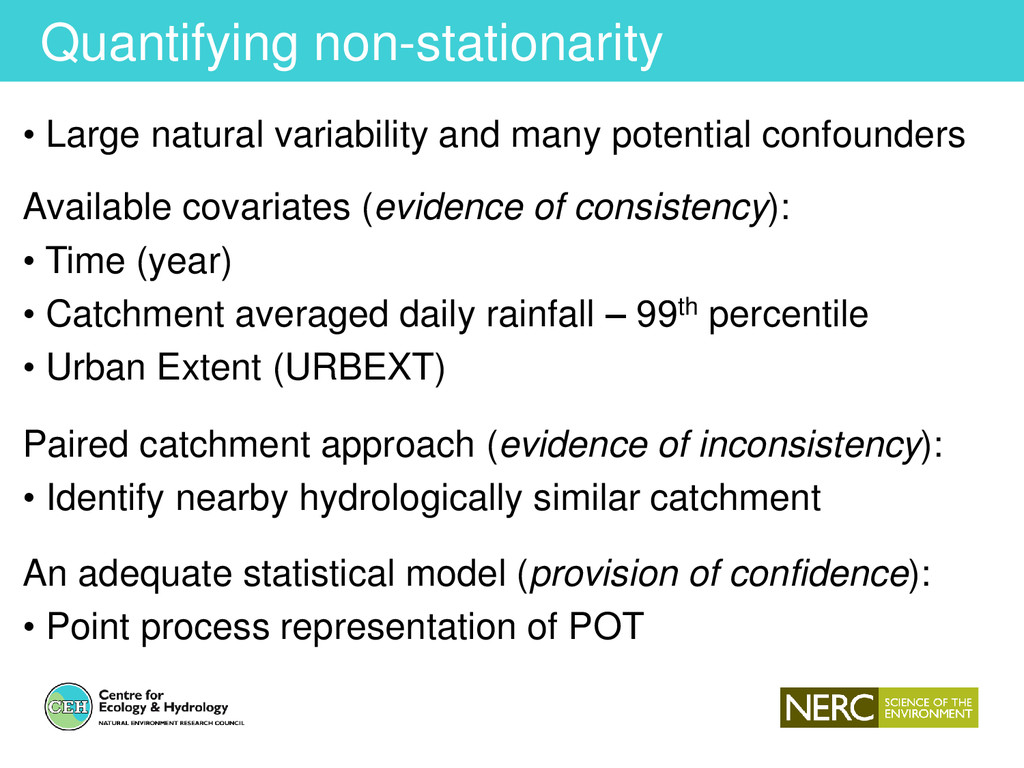
nearby hydrologically similar catchment Available covariates (evidence of consistency): • Time (year) • Catchment averaged daily rainfall – 99th percentile • Urban Extent (URBEXT) An adequate statistical model (provision of confidence): • Point process representation of POT • Large natural variability and many potential confounders
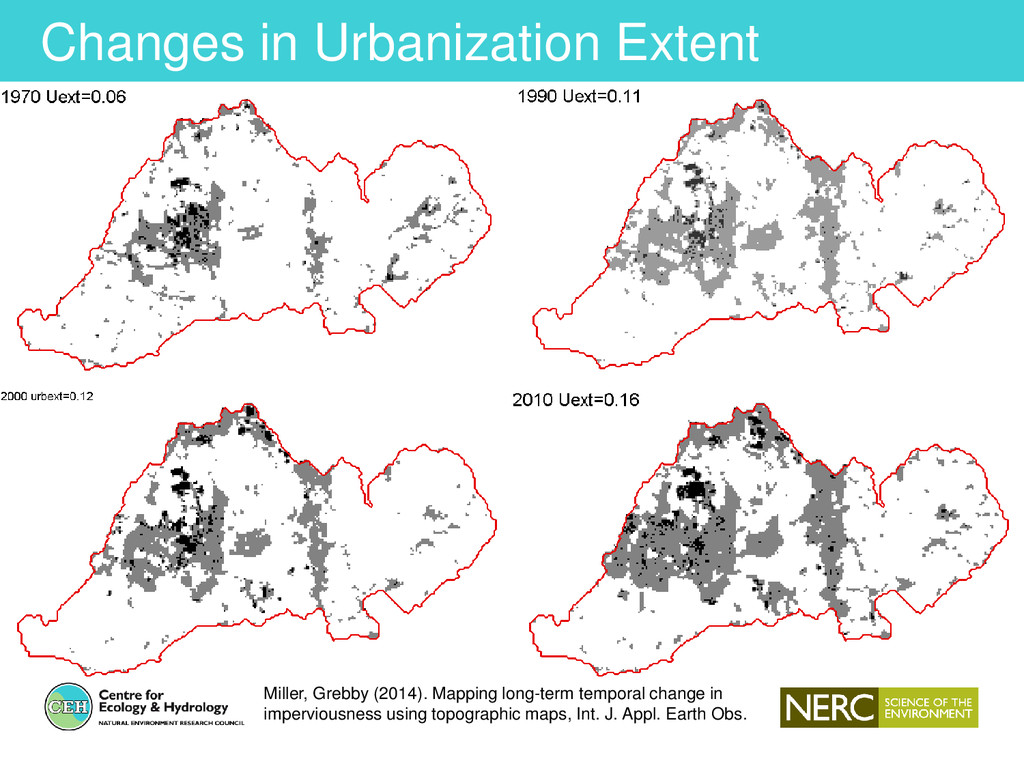
be attributed to increased urbanisation levels • Point process representation of POT is useful • Method is demanding in terms of data availability and processing (attribution is difficult!)
Kjeldsen, T. R. and Miller, J. D. (2015), Detection and attribution of urbanization effect on flood extremes using nonstationary flood frequency models. Water Resour. Res.. Accepted. doi:10.1002/2015WR017065 [email protected] @ilapros