a British catchment Ilaria Prosdocimi Department of Mathematical Sciences, University of Bath James Miller, Mike Hutchins, Gianni Vesuviano Centre for Ecology & Hydrology, Wallingford, UK
the way rivers work PollCurb investigates water pollution in rivers Today’s talk: hydrological response and peak flows Important for water pollution dispersion and flood risk estimation (FEH).
the way rivers work PollCurb investigates water pollution in rivers Today’s talk: hydrological response and peak flows Important for water pollution dispersion and flood risk estimation (FEH).
the way rivers work PollCurb investigates water pollution in rivers Today’s talk: hydrological response and peak flows Important for water pollution dispersion and flood risk estimation (FEH).
the way rivers work PollCurb investigates water pollution in rivers Today’s talk: hydrological response and peak flows Important for water pollution dispersion and flood risk estimation (FEH).
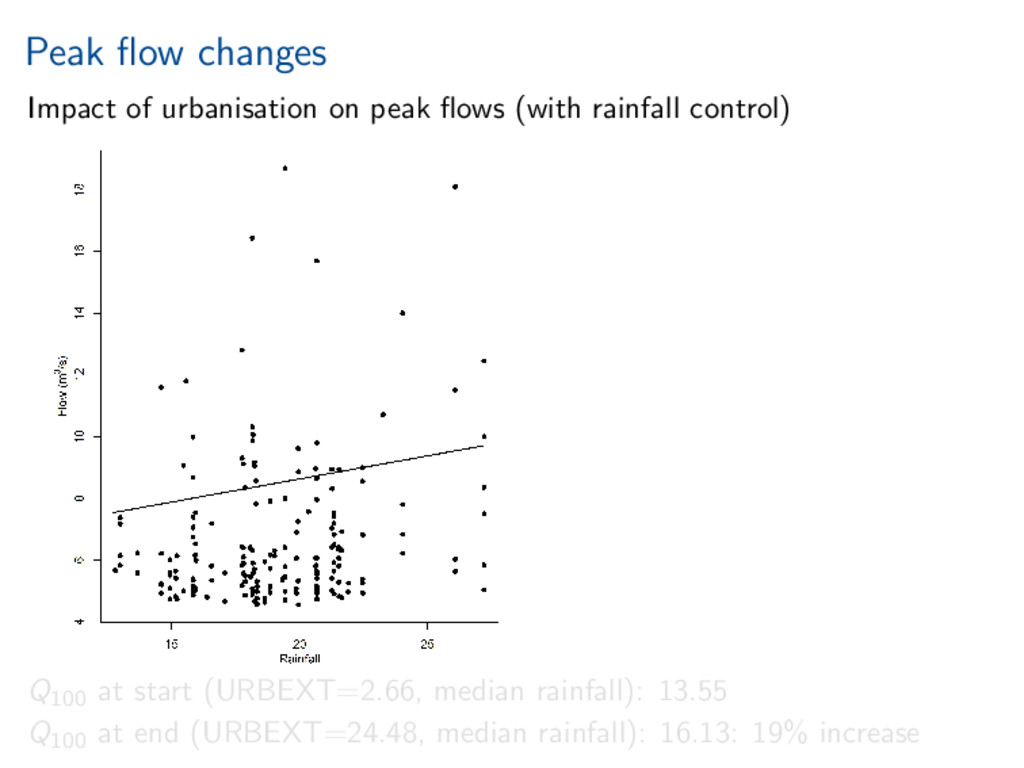
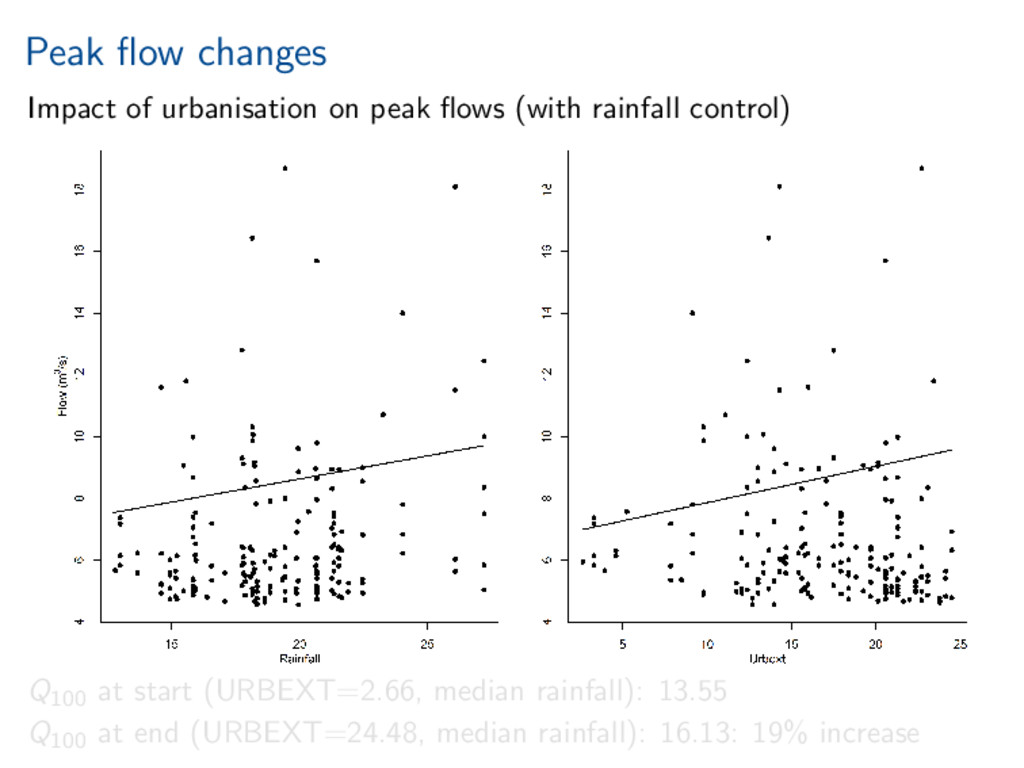
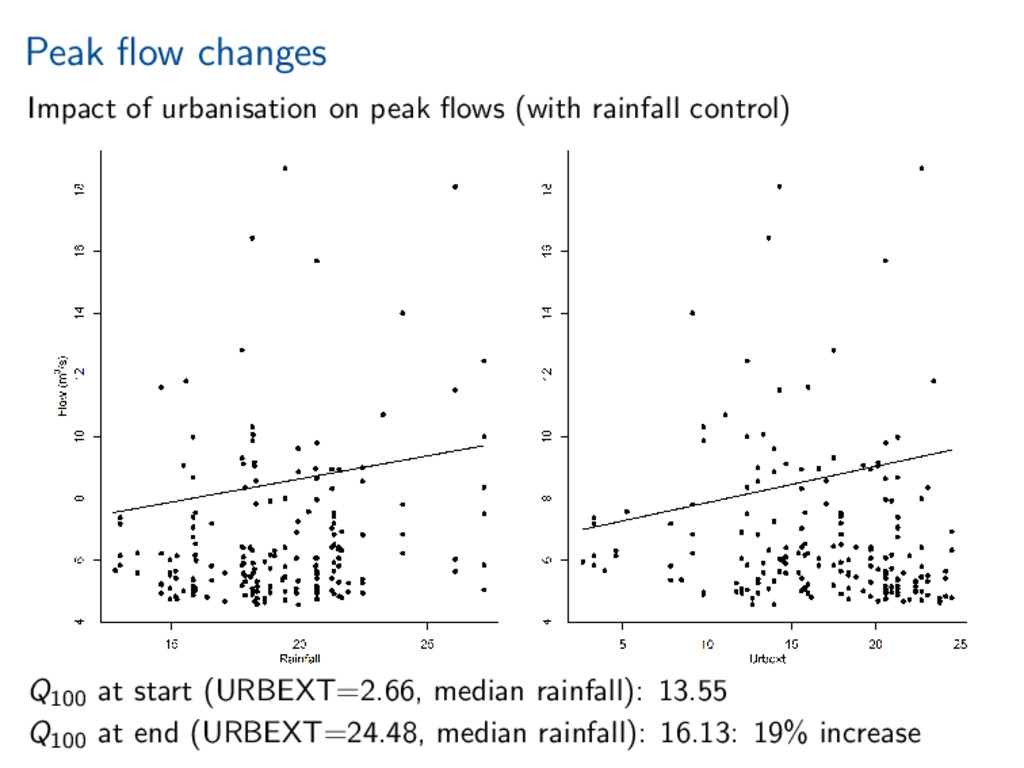
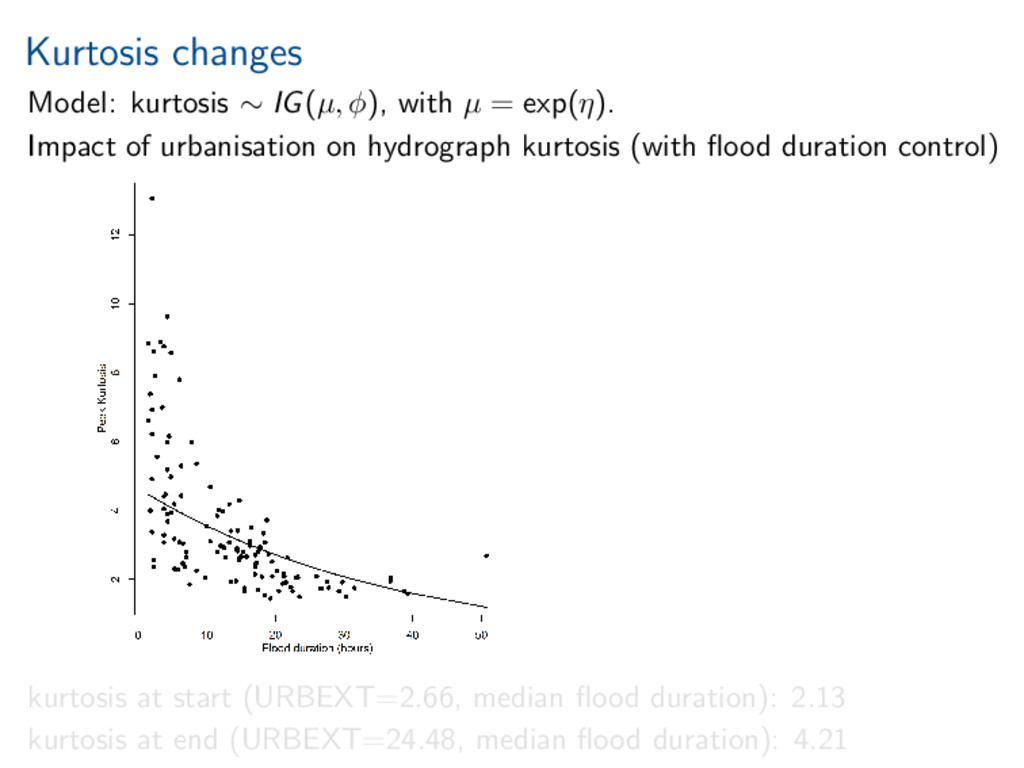
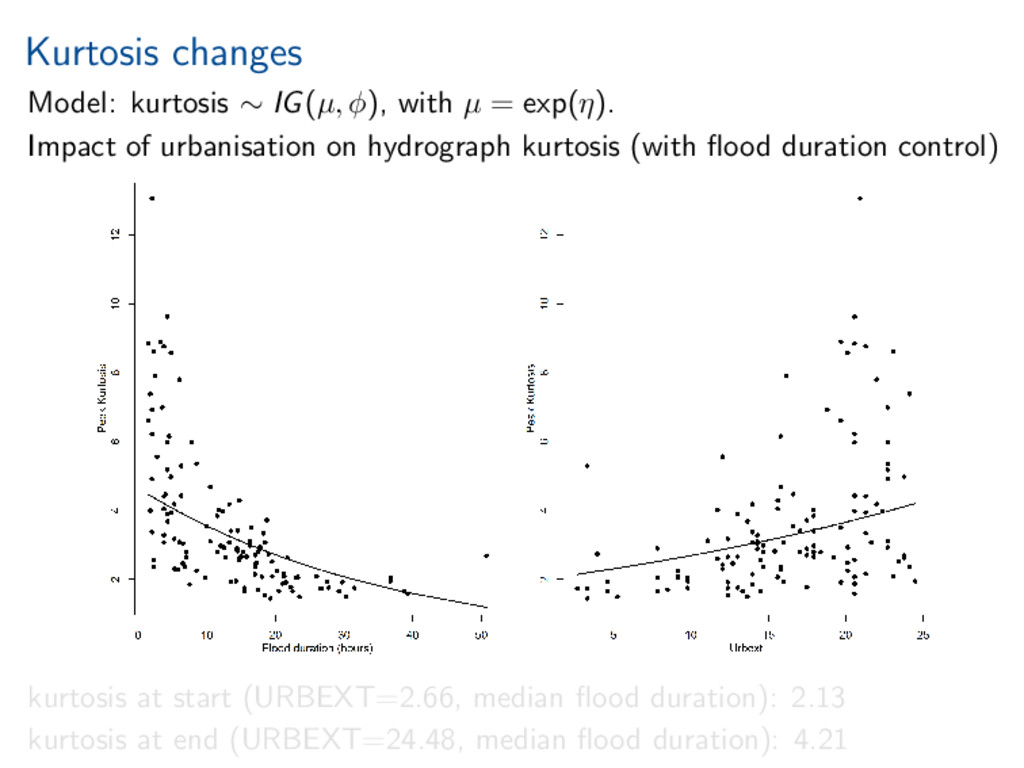
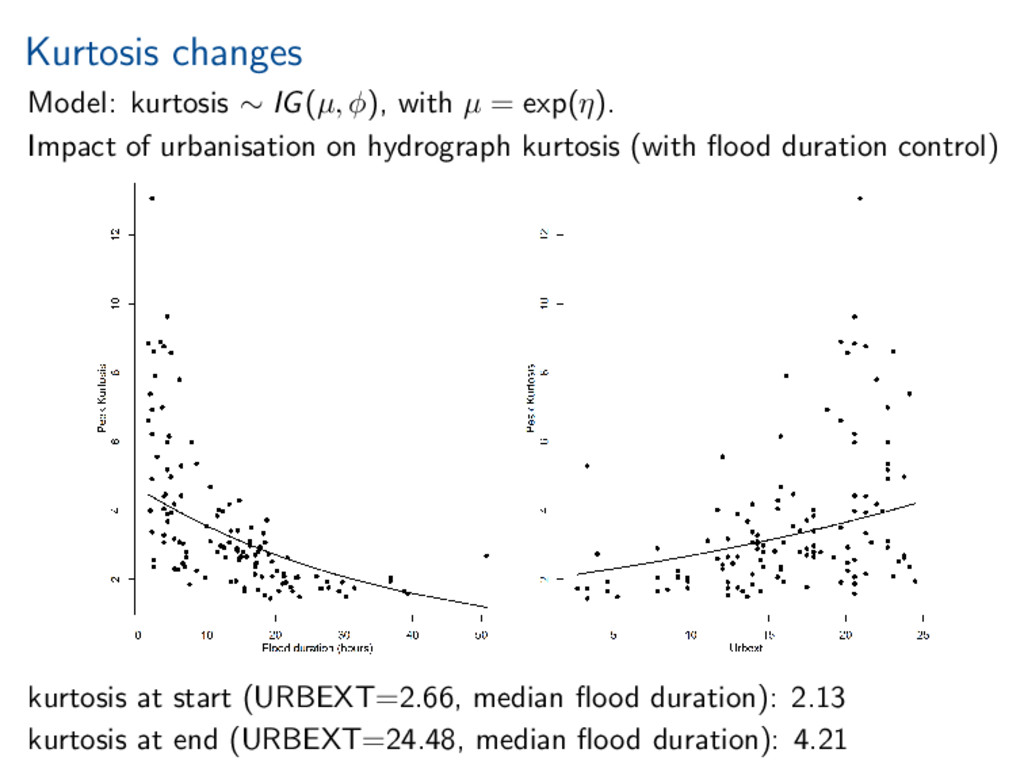
exp(η). Impact of urbanisation on hydrograph kurtosis (with flood duration control) kurtosis at start (URBEXT=2.66, median flood duration): 2.13 kurtosis at end (URBEXT=24.48, median flood duration): 4.21
exp(η). Impact of urbanisation on hydrograph kurtosis (with flood duration control) kurtosis at start (URBEXT=2.66, median flood duration): 2.13 kurtosis at end (URBEXT=24.48, median flood duration): 4.21
exp(η). Impact of urbanisation on hydrograph kurtosis (with flood duration control) kurtosis at start (URBEXT=2.66, median flood duration): 2.13 kurtosis at end (URBEXT=24.48, median flood duration): 4.21
exp(η). Impact of urbanisation on hydrograph kurtosis (with flood duration control) kurtosis at start (URBEXT=2.66, median flood duration): 2.13 kurtosis at end (URBEXT=24.48, median flood duration): 4.21
exp(η). Impact of urbanisation on hydrograph kurtosis (with flood duration control) kurtosis at start (URBEXT=2.66, median flood duration): 2.13 kurtosis at end (URBEXT=24.48, median flood duration): 4.21
worth it). Statistical investigation of impacts of urbanisation on flow behaviour. Increased urbanisation impacts several aspects of flood hydrograph. References Miller, and Grebby (2014), Mapping long-term temporal change in imperviousness using topographic maps, Int. J. Appl. Earth Obs. Geoinform., 30, 920, doi:10.1016/j.jag.2014.01.002 Prosdocimi, Kjeldsen, and Miller (2015), Detection and attribution of urbanization effect on flood extremes using nonstationary flood-frequency models, Water Resour. Res., 51, 42444262, doi:10.1002/2015WR017065.
worth it). Statistical investigation of impacts of urbanisation on flow behaviour. Increased urbanisation impacts several aspects of flood hydrograph. References Miller, and Grebby (2014), Mapping long-term temporal change in imperviousness using topographic maps, Int. J. Appl. Earth Obs. Geoinform., 30, 920, doi:10.1016/j.jag.2014.01.002 Prosdocimi, Kjeldsen, and Miller (2015), Detection and attribution of urbanization effect on flood extremes using nonstationary flood-frequency models, Water Resour. Res., 51, 42444262, doi:10.1002/2015WR017065.
worth it). Statistical investigation of impacts of urbanisation on flow behaviour. Increased urbanisation impacts several aspects of flood hydrograph. References Miller, and Grebby (2014), Mapping long-term temporal change in imperviousness using topographic maps, Int. J. Appl. Earth Obs. Geoinform., 30, 920, doi:10.1016/j.jag.2014.01.002 Prosdocimi, Kjeldsen, and Miller (2015), Detection and attribution of urbanization effect on flood extremes using nonstationary flood-frequency models, Water Resour. Res., 51, 42444262, doi:10.1002/2015WR017065.
worth it). Statistical investigation of impacts of urbanisation on flow behaviour. Increased urbanisation impacts several aspects of flood hydrograph. References Miller, and Grebby (2014), Mapping long-term temporal change in imperviousness using topographic maps, Int. J. Appl. Earth Obs. Geoinform., 30, 920, doi:10.1016/j.jag.2014.01.002 Prosdocimi, Kjeldsen, and Miller (2015), Detection and attribution of urbanization effect on flood extremes using nonstationary flood-frequency models, Water Resour. Res., 51, 42444262, doi:10.1002/2015WR017065.
worth it). Statistical investigation of impacts of urbanisation on flow behaviour. Increased urbanisation impacts several aspects of flood hydrograph. References Miller, and Grebby (2014), Mapping long-term temporal change in imperviousness using topographic maps, Int. J. Appl. Earth Obs. Geoinform., 30, 920, doi:10.1016/j.jag.2014.01.002 Prosdocimi, Kjeldsen, and Miller (2015), Detection and attribution of urbanization effect on flood extremes using nonstationary flood-frequency models, Water Resour. Res., 51, 42444262, doi:10.1002/2015WR017065.