Share
Embed
Full Observability for Kyverno with Observability-as-Code
Adopting Kyverno solves the challenge of Policy-as-Code. However, a new question emerges: what happens when a slow policy rule adds latency? A slow admission webhook can degrade performance across the k8s cluster. Tracing the webhook's lifecycle is the fastest way to pinpoint any bottlenecking rule.
The next step in your GitOps journey is to make your monitoring as declarative as your policies. In the live demo, you’ll learn how to monitor Kyverno's operational cycle using Prometheus, Tempo, and Grafana.
Join to learn how to close your GitOps loop and achieve operational control over Kyverno.
immavalls
November 17, 2026
Transcript
20 slides
-
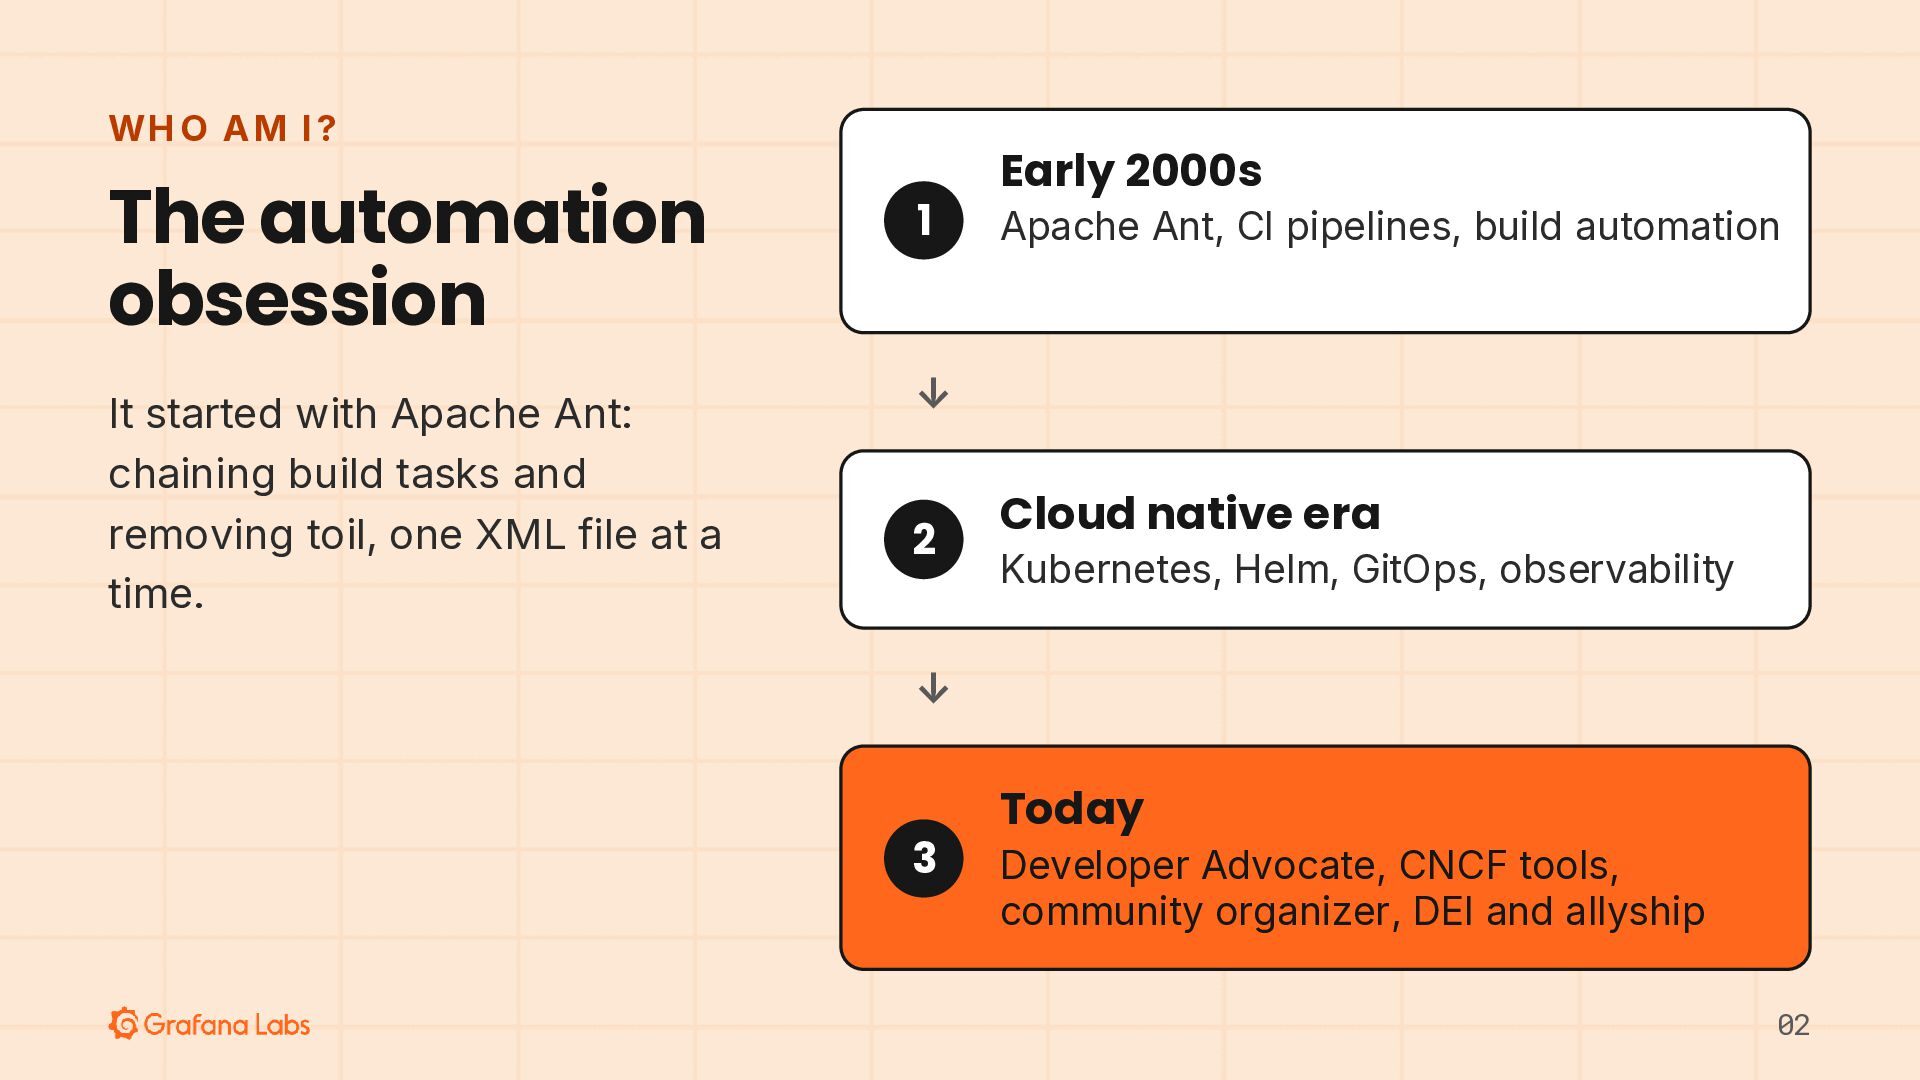
WH O AM I ? The automation obsession It started
with Apache Ant: chaining build tasks and removing toil, one XML file at a time. 1 Early 2000s Apache Ant, CI pipelines, build automation ↓ 2 Cloud native era Kubernetes, Helm, GitOps, observability ↓ 3 Today Developer Advocate, CNCF tools, community organizer, DEI and allyship 02 -
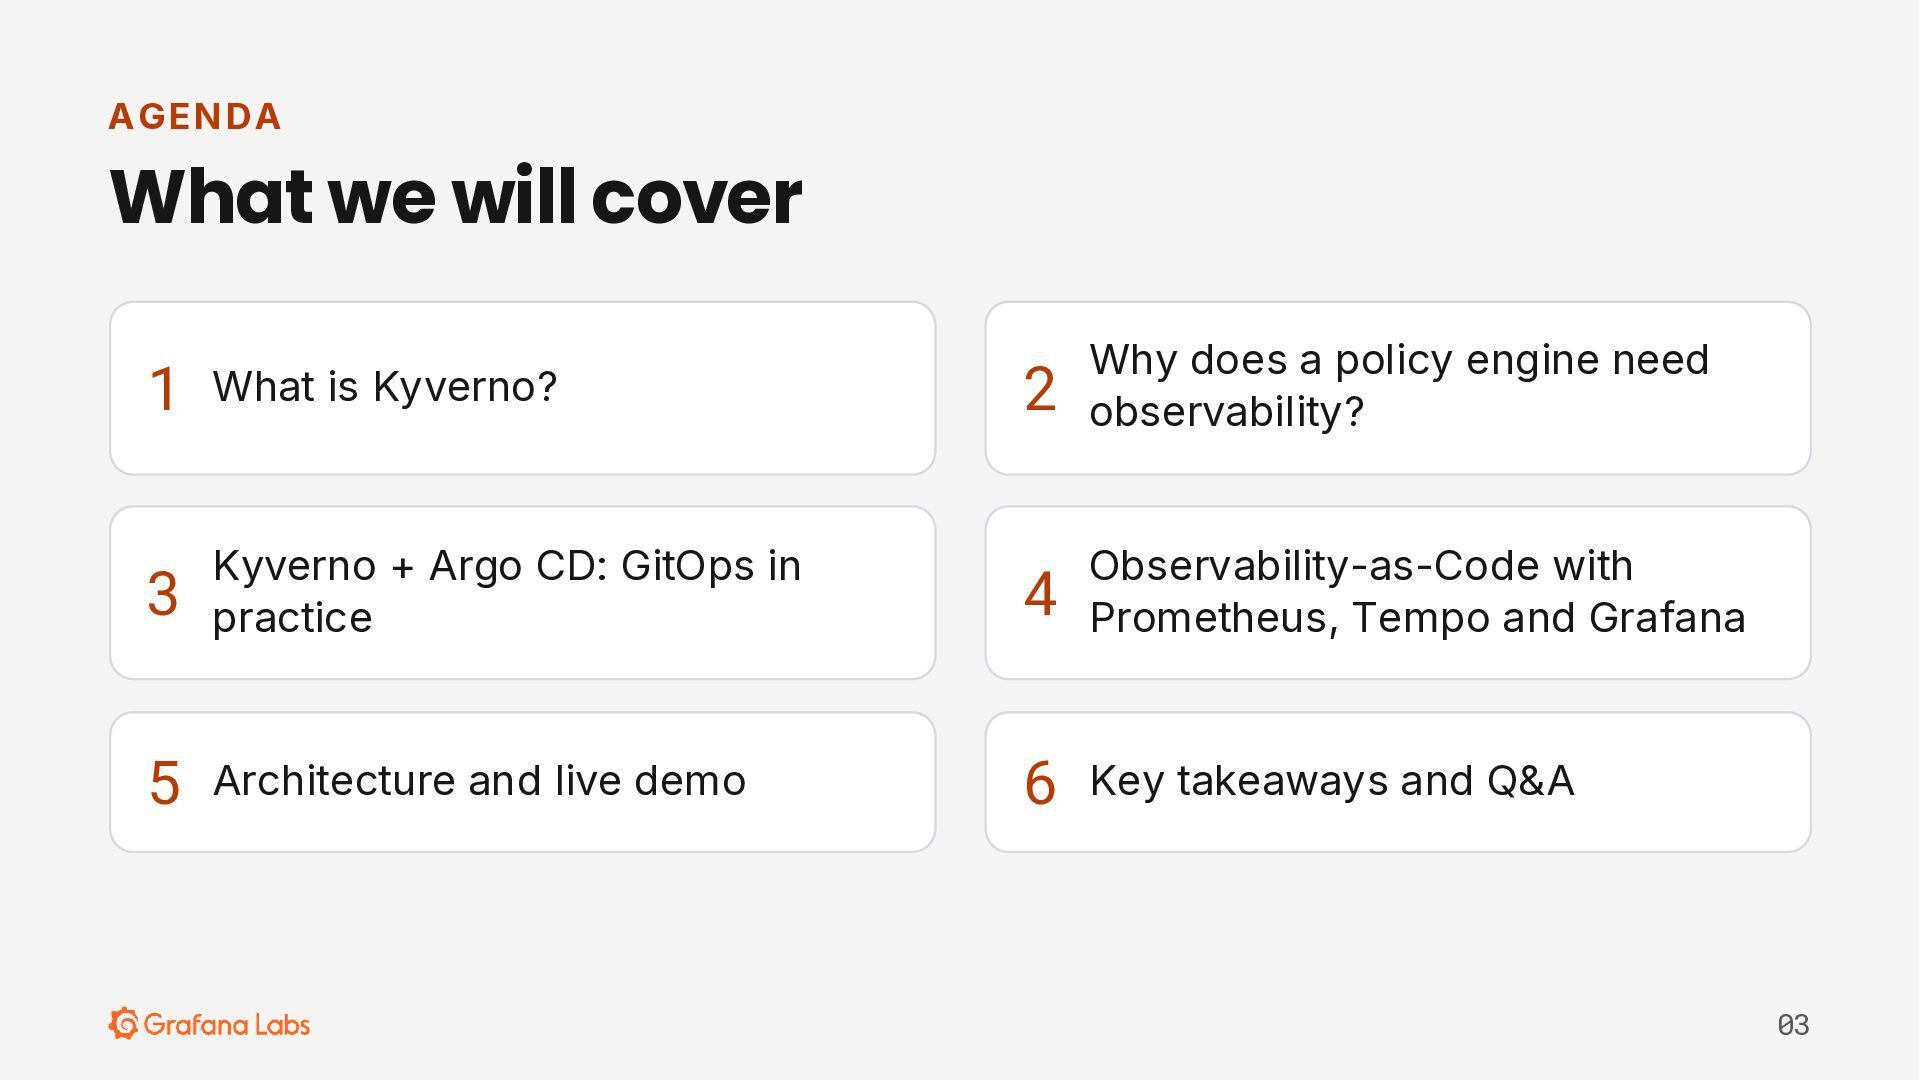
AGE N DA What we will cover 1 What is
Kyverno? 3 Kyverno + Argo CD: GitOps in practice 5 Architecture and live demo 2 Why does a policy engine need observability? 4 Observability-as-Code with Prometheus, Tempo and Grafana 6 Key takeaways and Q&A 03 -
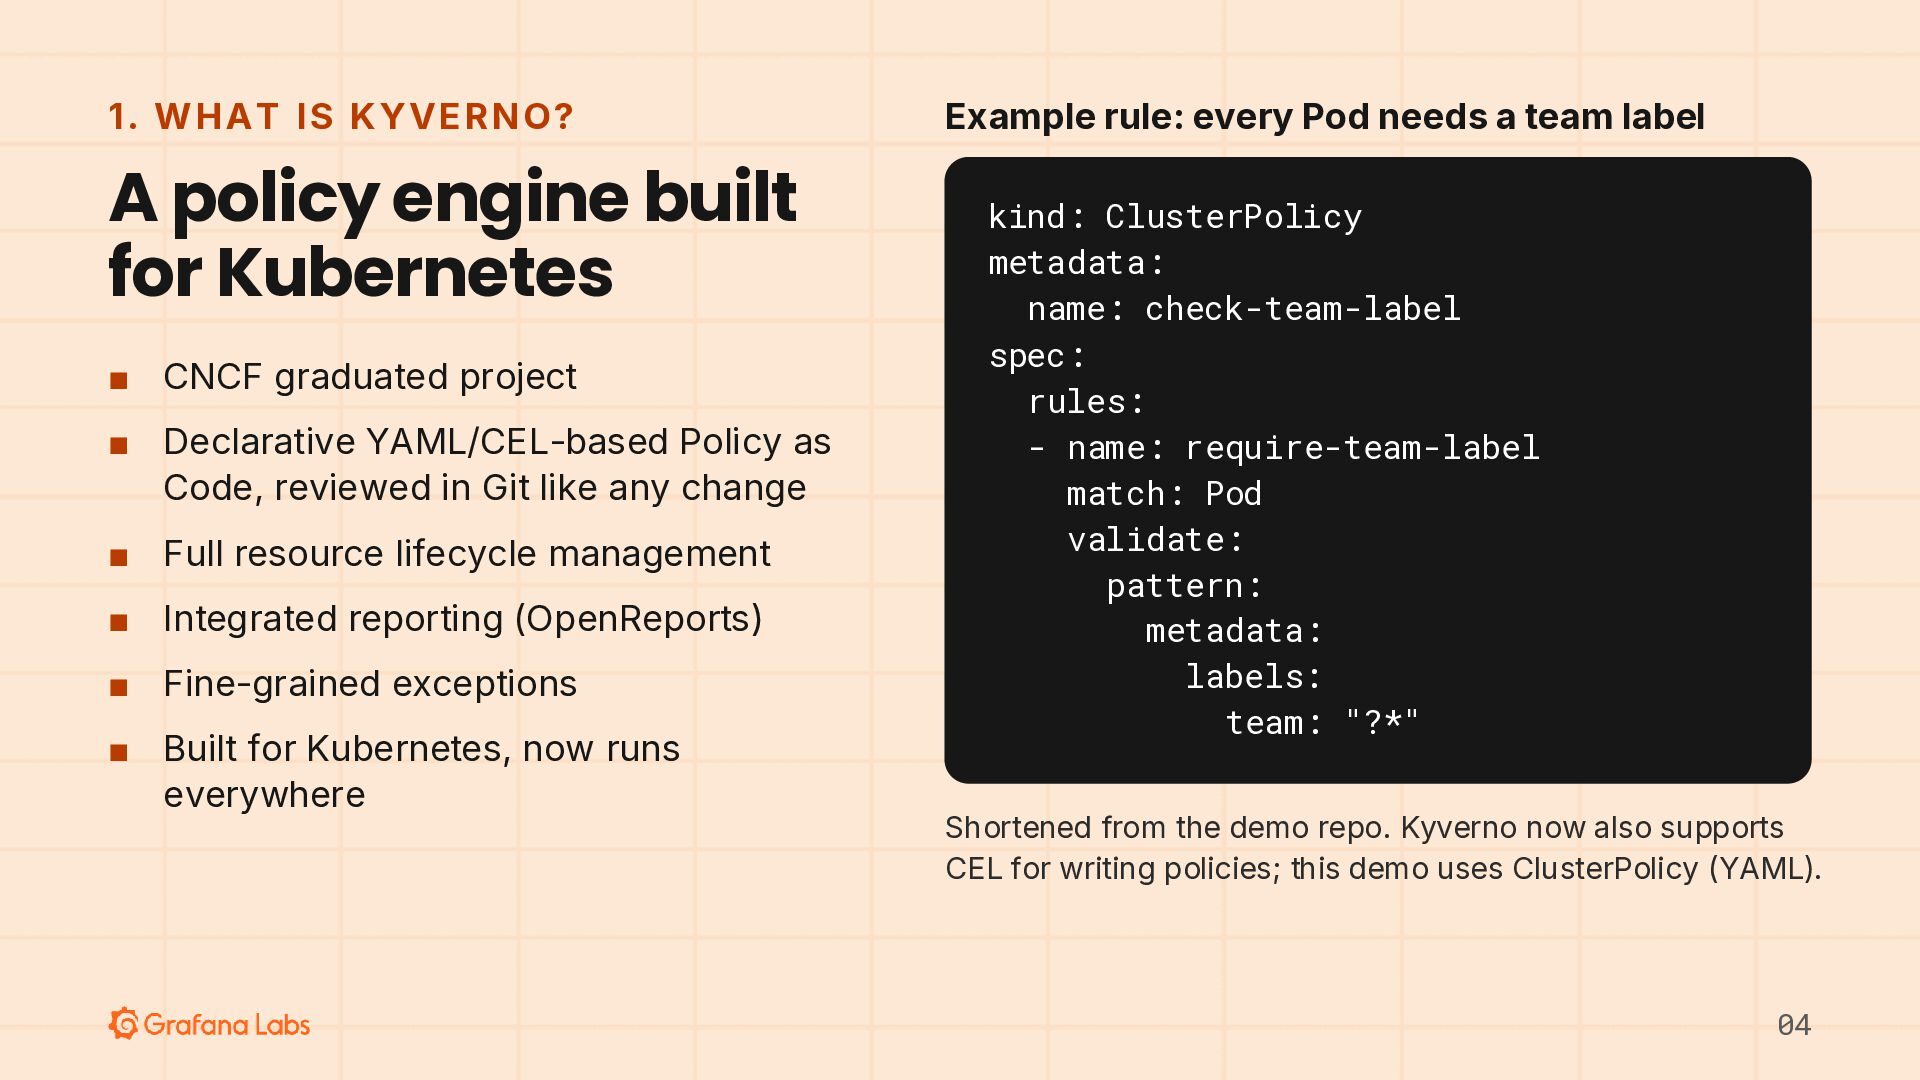
1. W HAT IS KY VE R NO ? A
policy engine built for Kubernetes ▪ CNCF graduated project ▪ Declarative YAML/CEL-based Policy as Code, reviewed in Git like any change ▪ Full resource lifecycle management ▪ Integrated reporting (OpenReports) ▪ Fine-grained exceptions ▪ Built for Kubernetes, now runs everywhere Example rule: every Pod needs a team label kind: ClusterPolicy metadata: name: check-team-label spec: rules: - name: require-team-label match: Pod validate: pattern: metadata: labels: team: "?*" Shortened from the demo repo. Kyverno now also supports CEL for writing policies; this demo uses ClusterPolicy (YAML). 04 -
1. W HAT IS KY VE R NO ? What
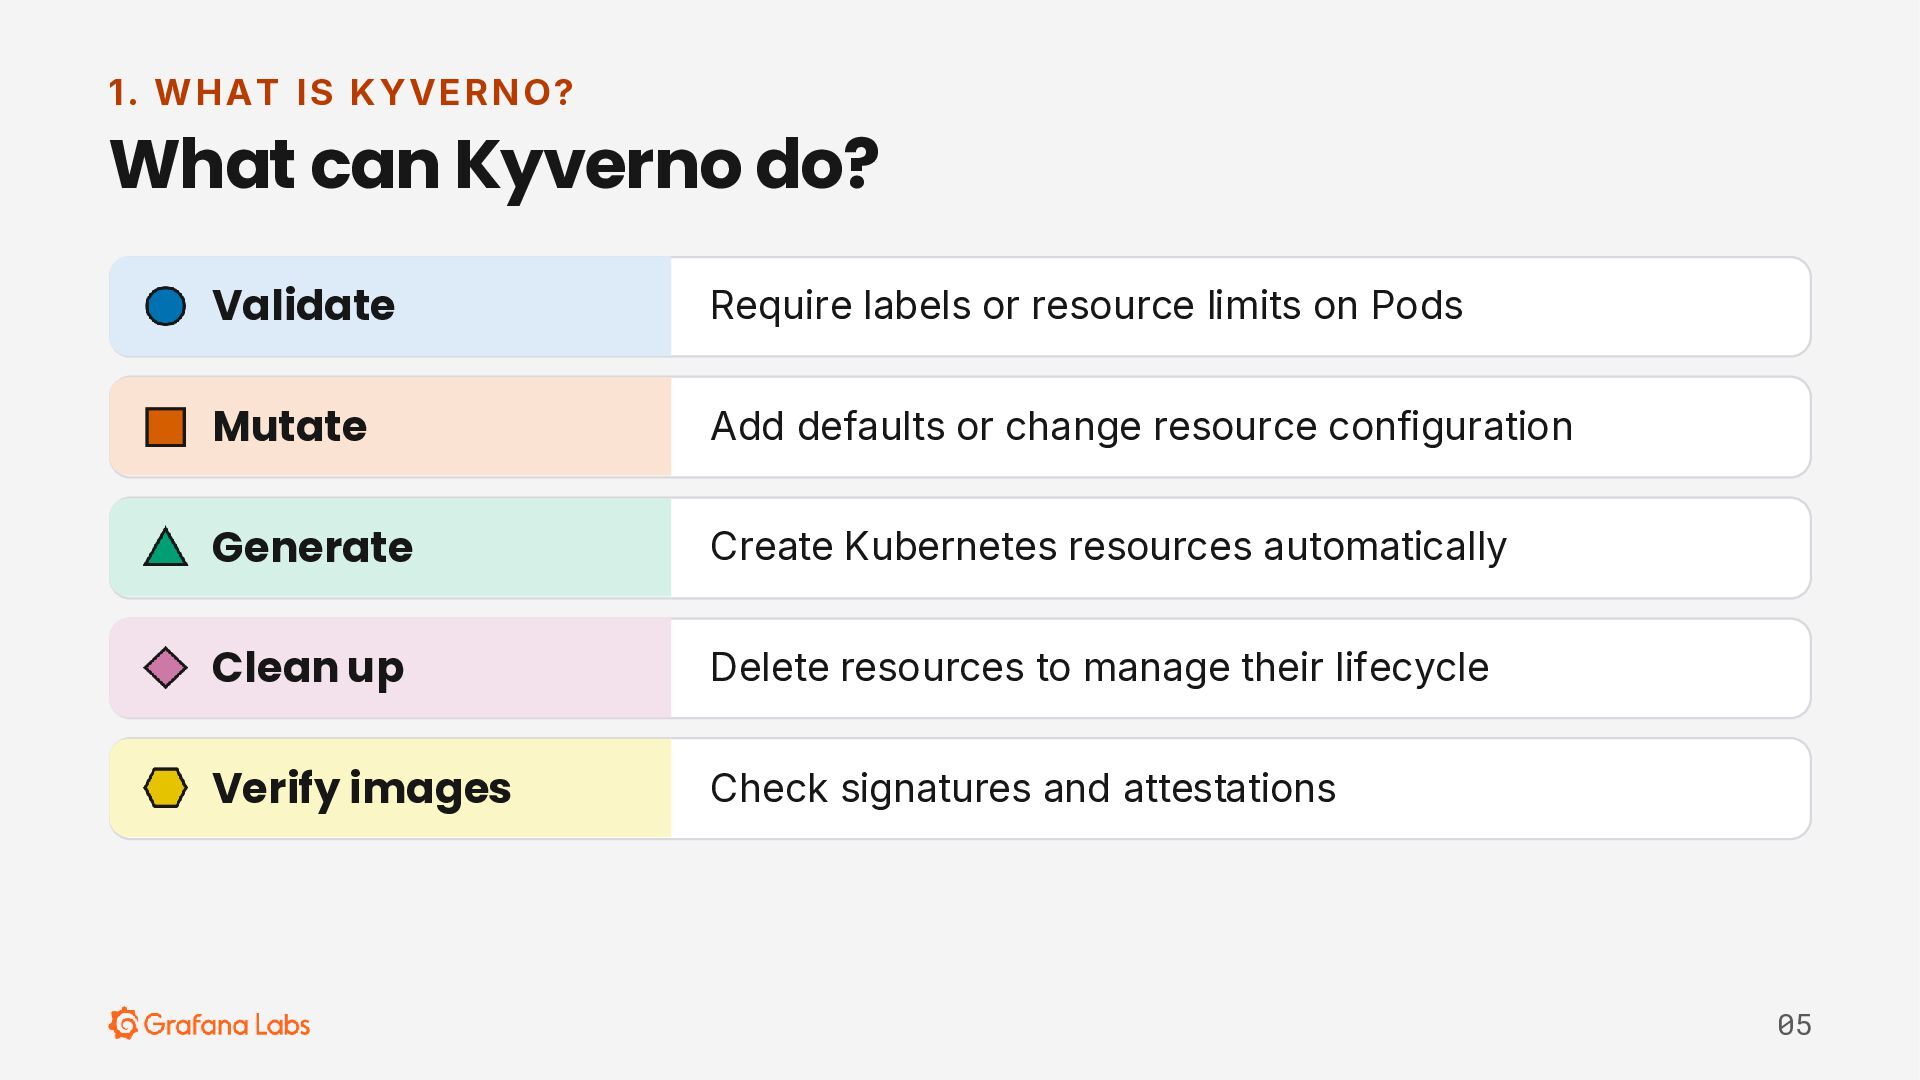
can Kyverno do? Validate Require labels or resource limits on Pods Mutate Add defaults or change resource configuration Generate Create Kubernetes resources automatically Clean up Delete resources to manage their lifecycle Verify images Check signatures and attestations 05 -
1. W HAT IS KY VE R NO ? How
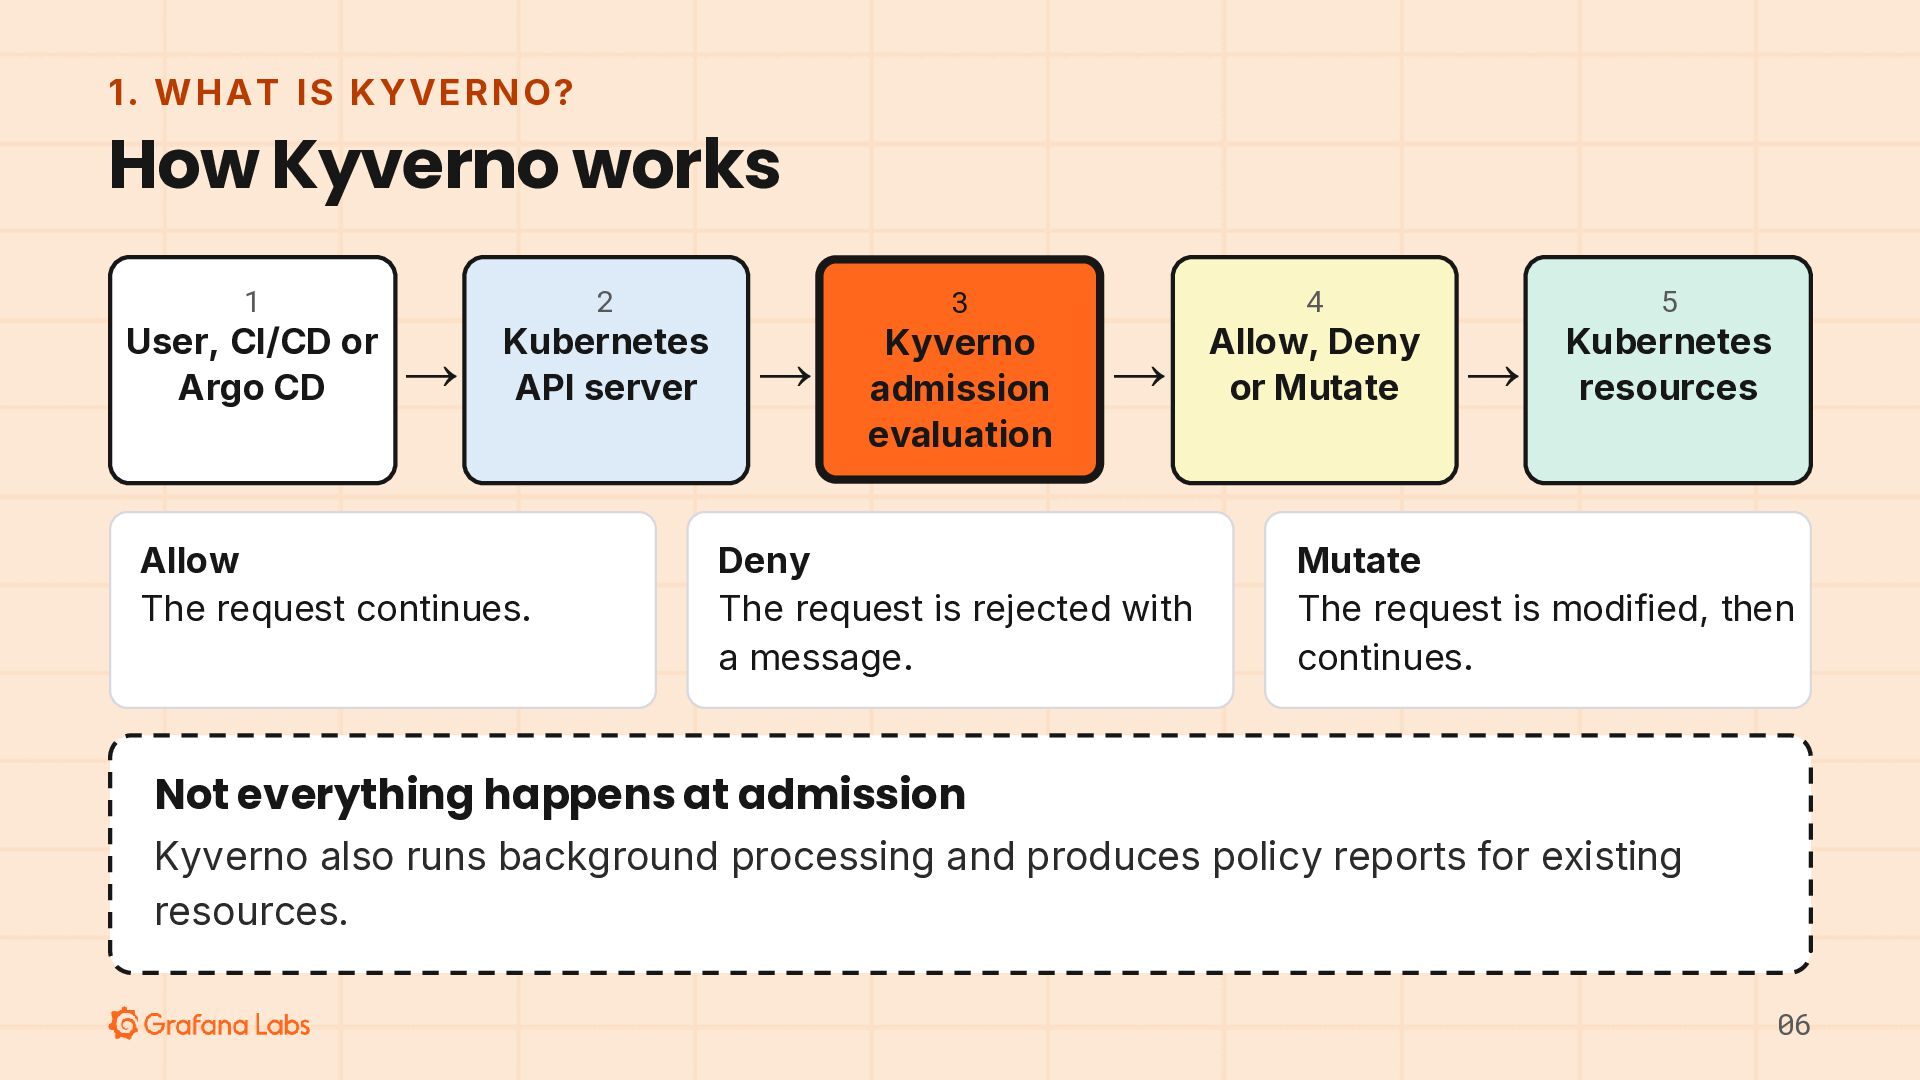
Kyverno works 1 User, CI/CD or Argo CD 2 → Kubernetes API server Allow The request continues. 4 3 → Kyverno admission evaluation → Deny The request is rejected with a message. Allow, Deny or Mutate 5 → Kubernetes resources Mutate The request is modified, then continues. Not everything happens at admission Kyverno also runs background processing and produces policy reports for existing resources. 06 -
L EAR N IN G R ES O U R
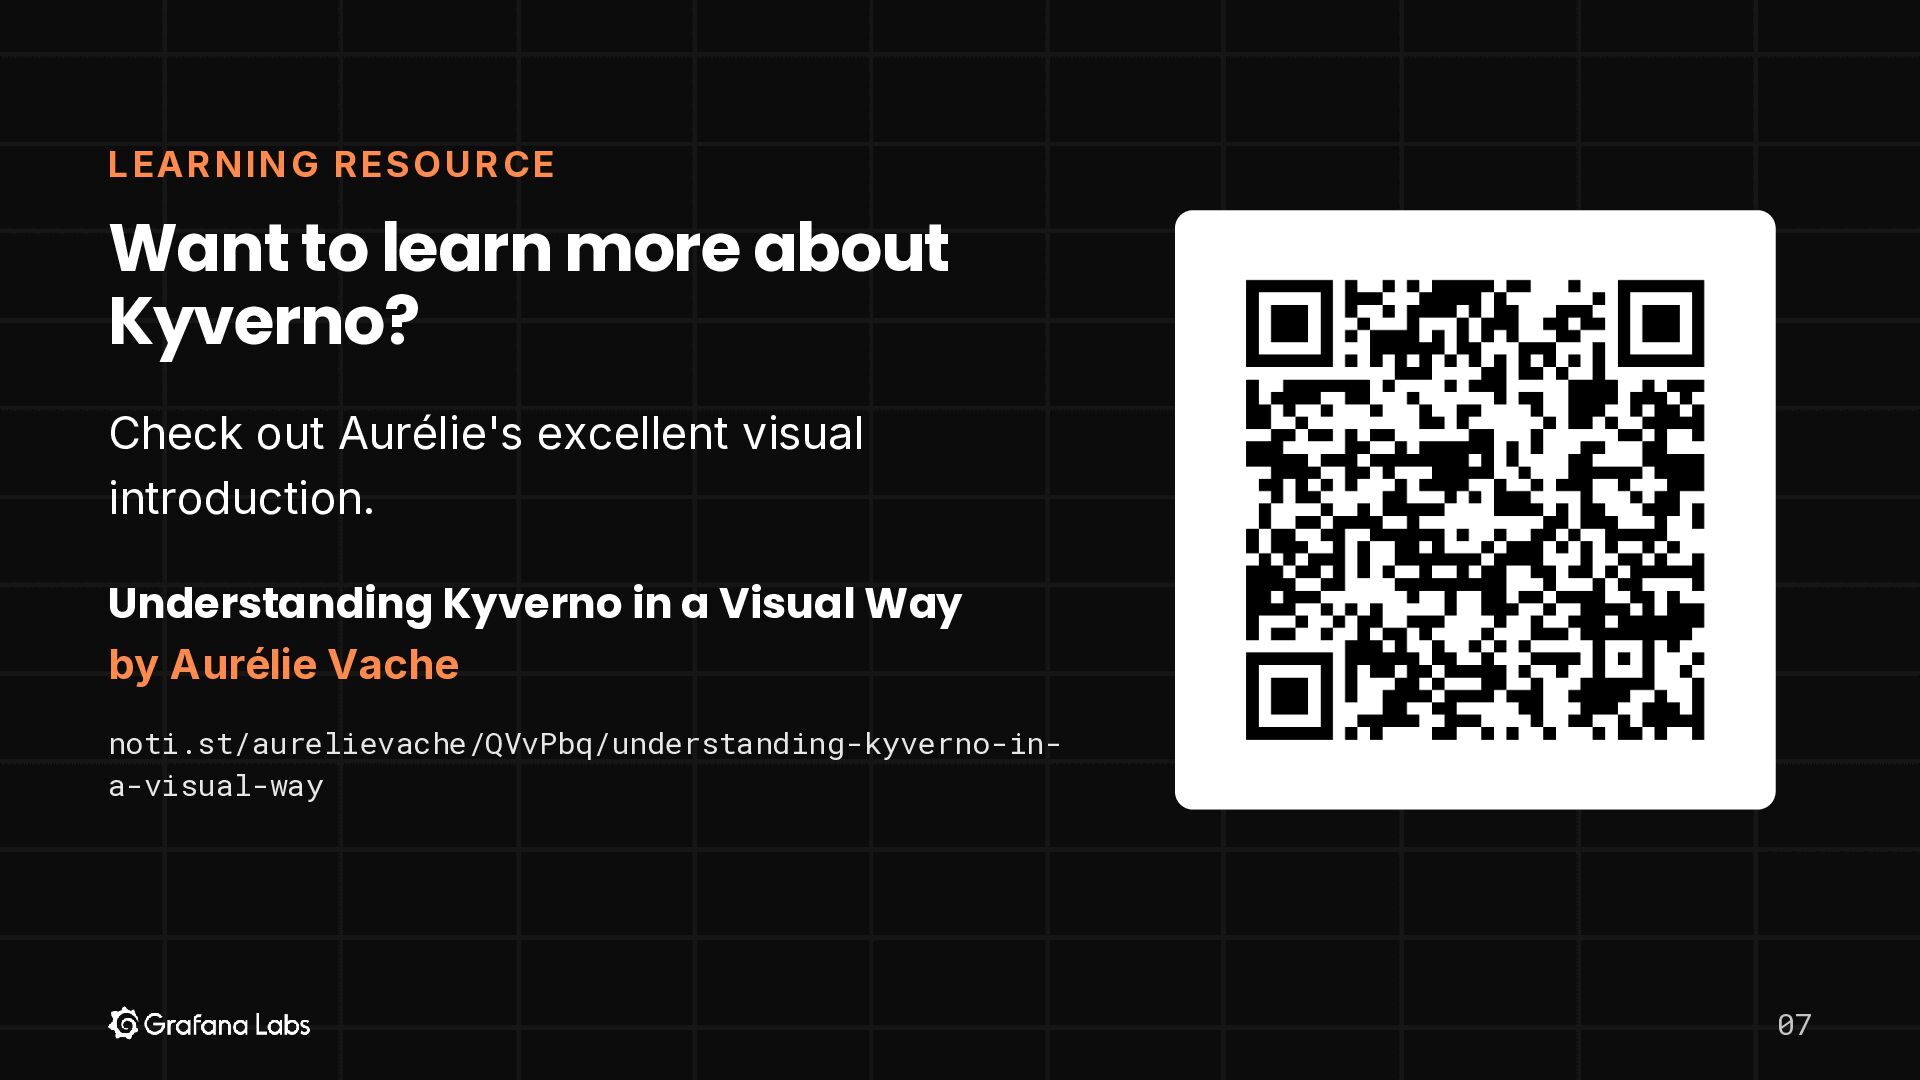
CE Want to learn more about Kyverno? Check out Aurélie's excellent visual introduction. Understanding Kyverno in a Visual Way by Aurélie Vache noti.st/aurelievache/QVvPbq/understanding-kyverno-ina-visual-way 07 -
2. WHY O BS ER V E A P O
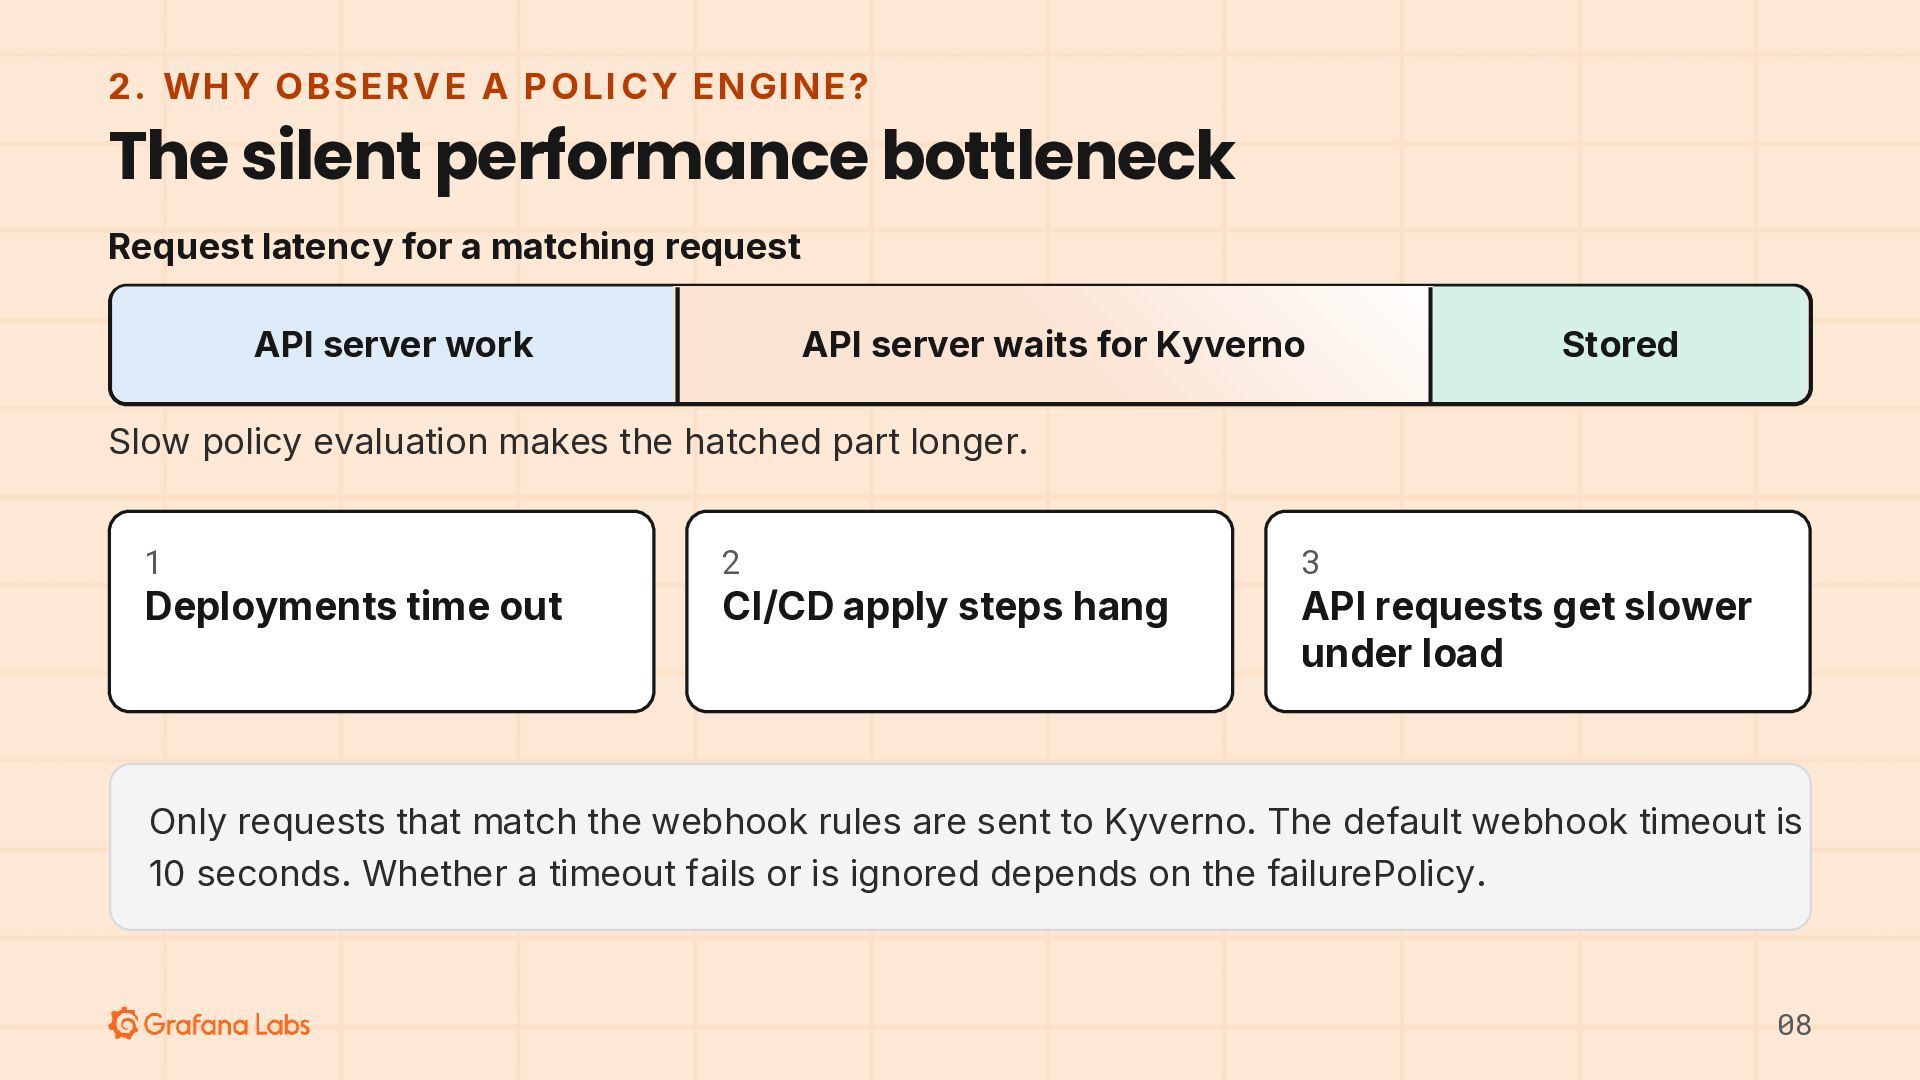
LI CY E NGI NE ? The silent performance bottleneck Request latency for a matching request API server work API server waits for Kyverno Stored Slow policy evaluation makes the hatched part longer. 1 Deployments time out 2 CI/CD apply steps hang 3 API requests get slower under load Only requests that match the webhook rules are sent to Kyverno. The default webhook timeout is 10 seconds. Whether a timeout fails or is ignored depends on the failurePolicy. 08 -
2. WHY O BS ER V E A P O
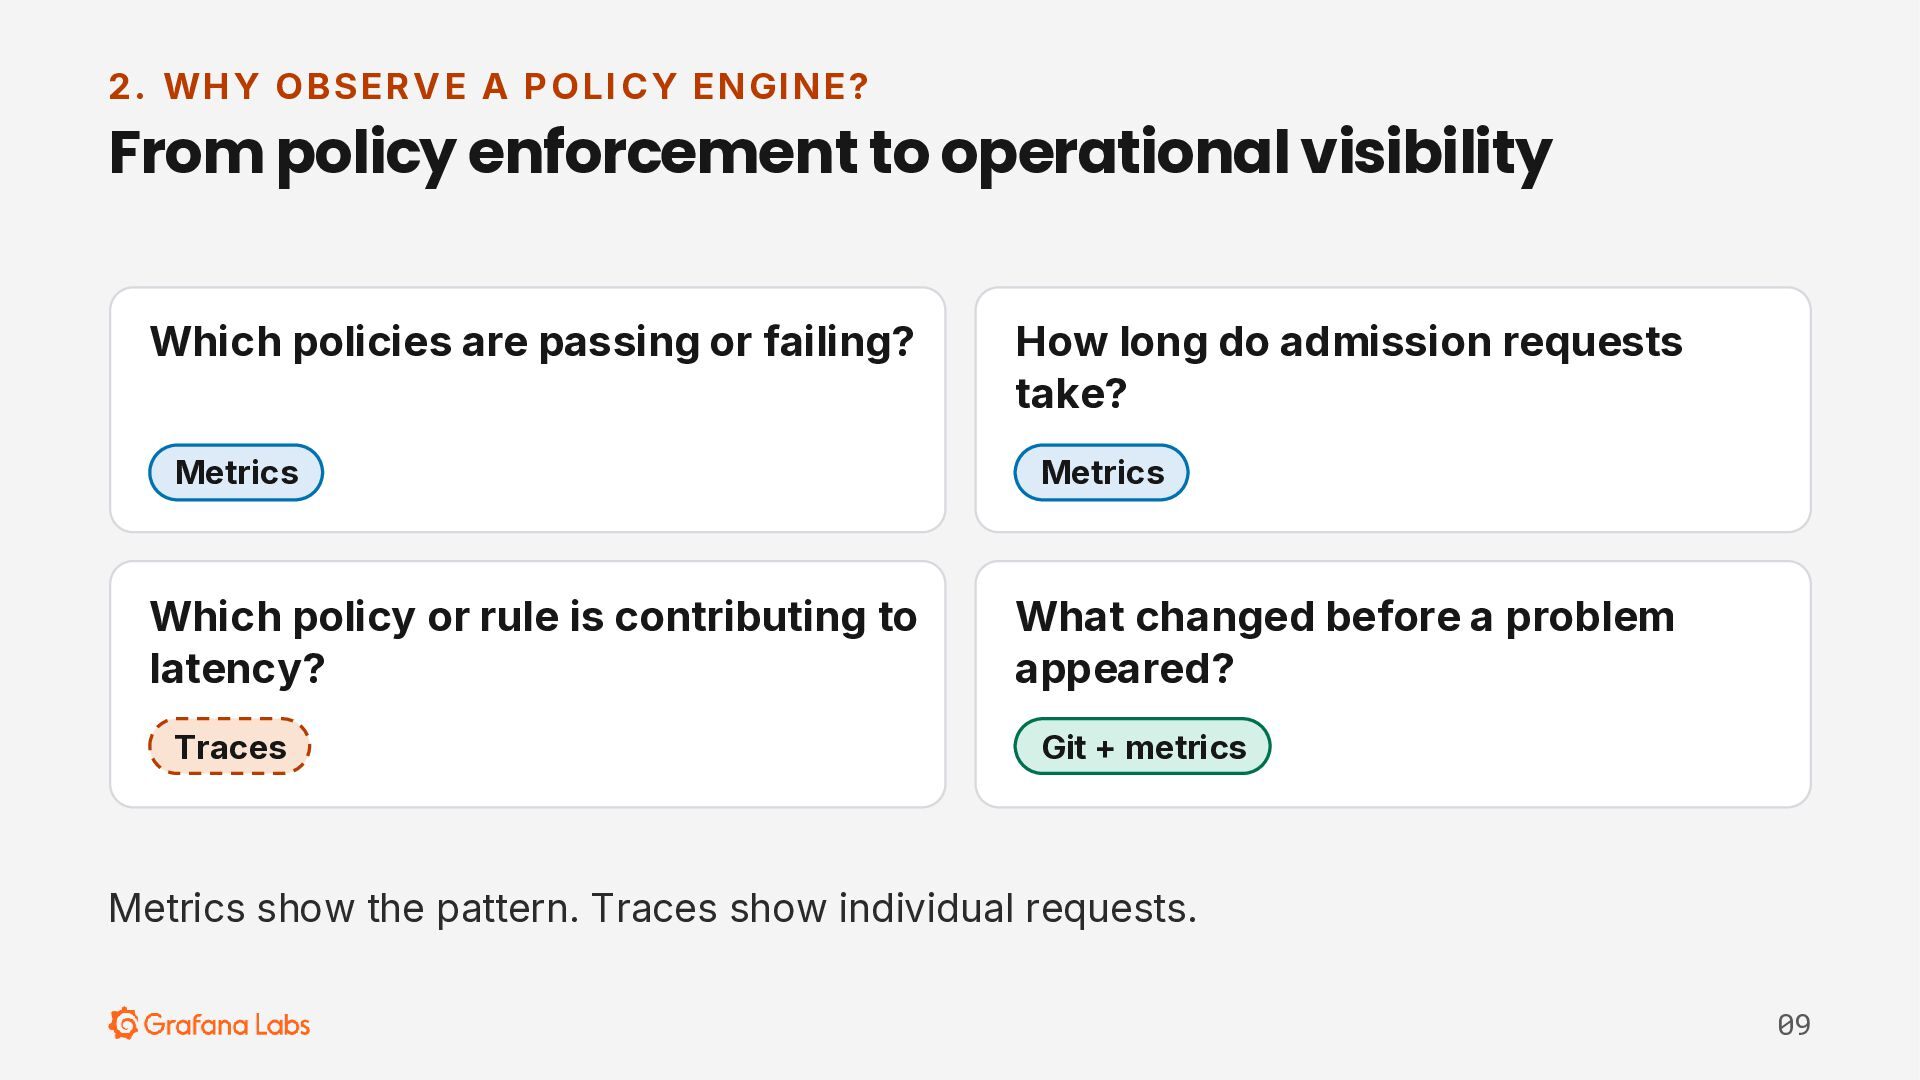
LI CY E NGI NE ? From policy enforcement to operational visibility Which policies are passing or failing? Metrics Which policy or rule is contributing to latency? Traces How long do admission requests take? Metrics What changed before a problem appeared? Git + metrics Metrics show the pattern. Traces show individual requests. 09 -
3 . GI TOP S A ND K YV ER
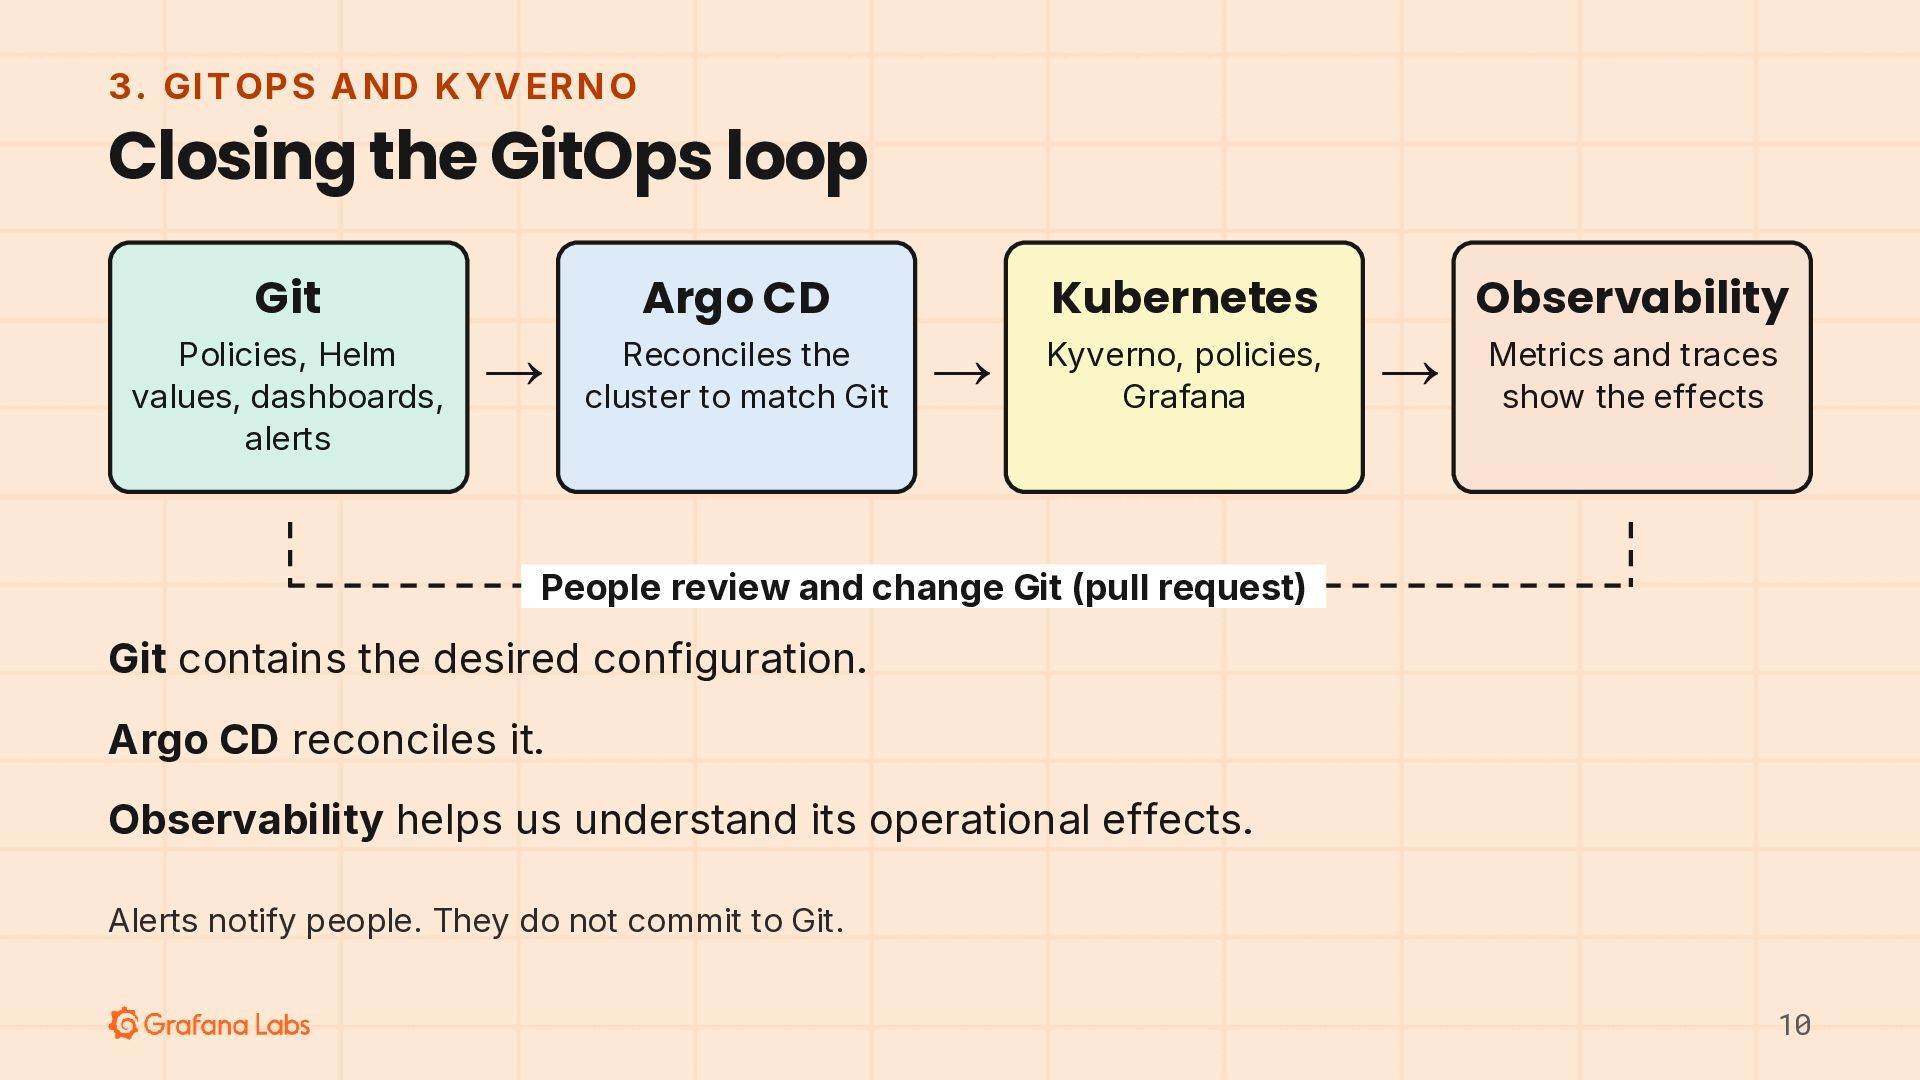
N O Closing the GitOps loop Git Argo CD Kubernetes Policies, Helm values, dashboards, alerts Reconciles the → cluster → to match Git Kyverno, policies, Grafana Observability → Metrics and traces show the effects People review and change Git (pull request) Git contains the desired configuration. Argo CD reconciles it. Observability helps us understand its operational effects. Alerts notify people. They do not commit to Git. 10 -
3 . GI TOP S A ND K YV ER
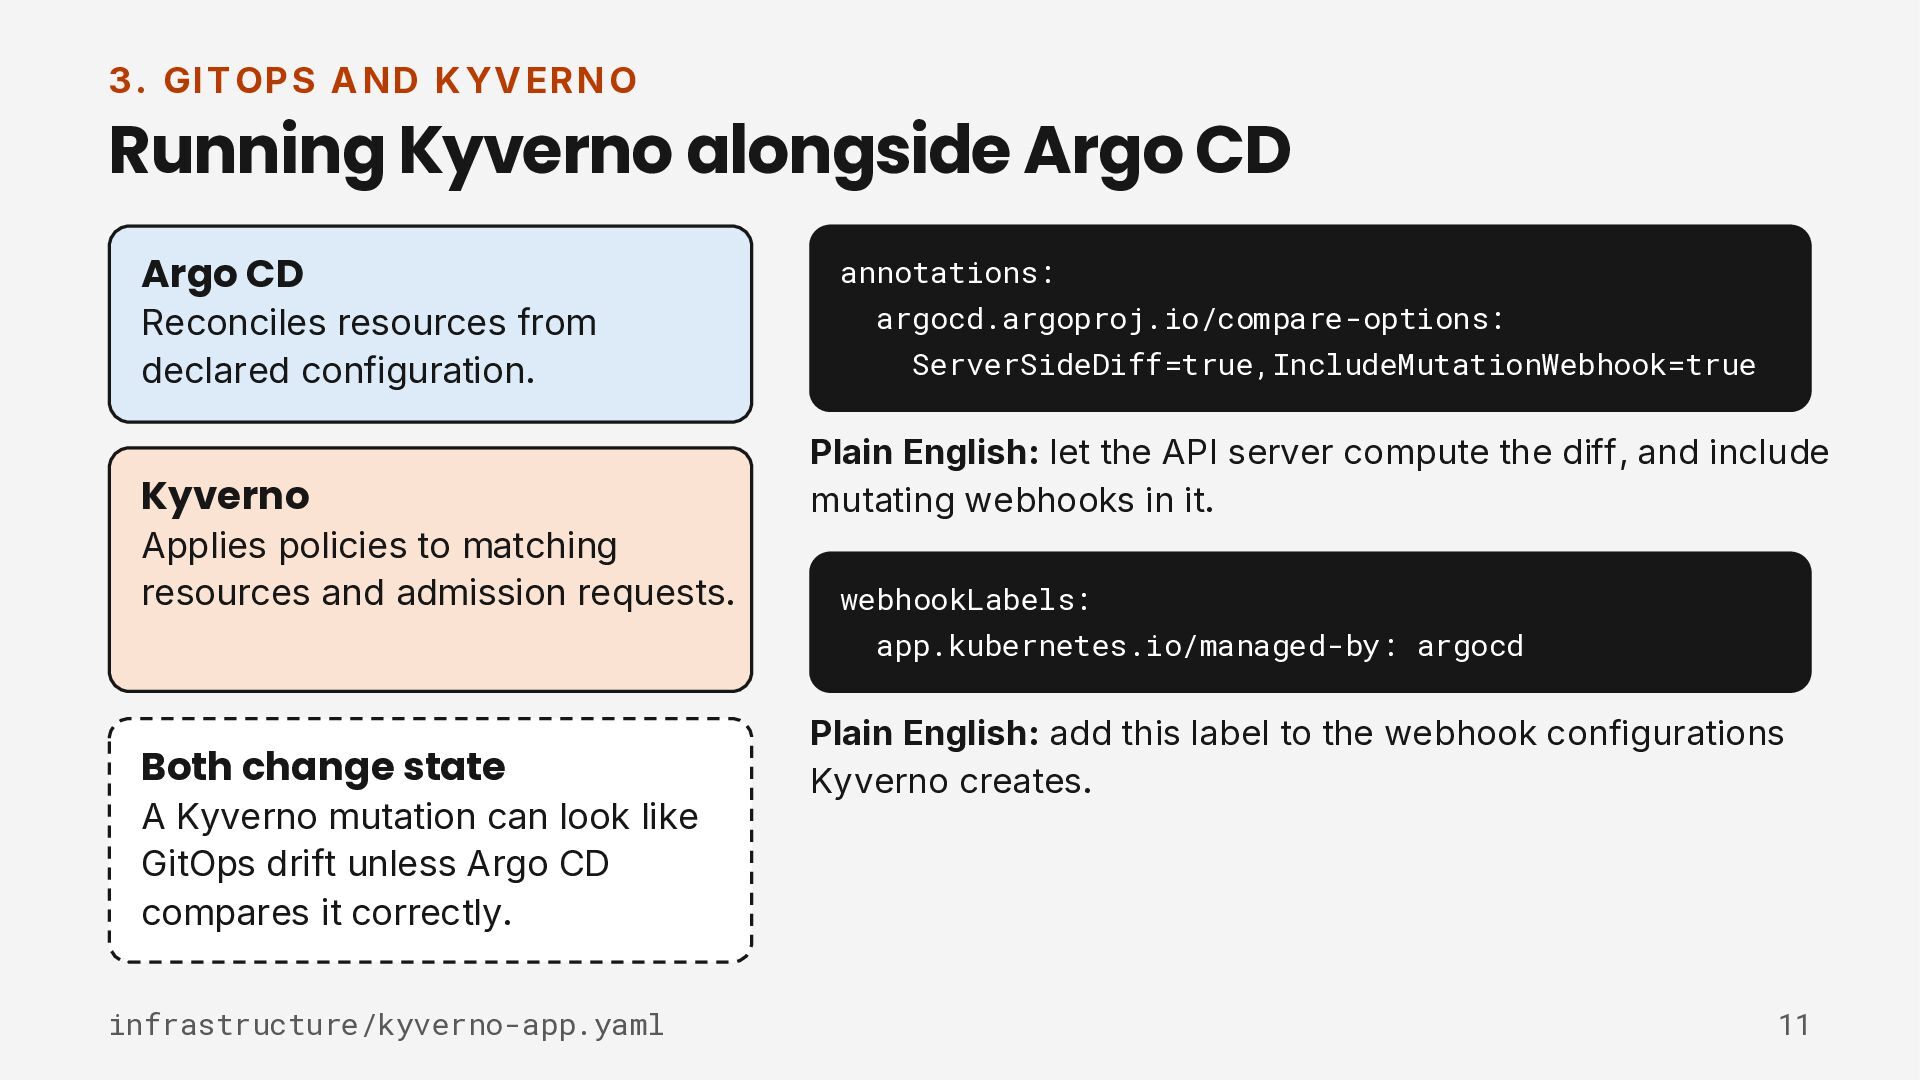
N O Running Kyverno alongside Argo CD Argo CD Reconciles resources from declared configuration. Kyverno Applies policies to matching resources and admission requests. annotations: argocd.argoproj.io/compare-options: ServerSideDiff=true,IncludeMutationWebhook=true Plain English: let the API server compute the diff, and include mutating webhooks in it. webhookLabels: app.kubernetes.io/managed-by: argocd Both change state A Kyverno mutation can look like GitOps drift unless Argo CD compares it correctly. infrastructure/kyverno-app.yaml Plain English: add this label to the webhook configurations Kyverno creates. 11 -
3 . GI TOP S A ND K YV ER
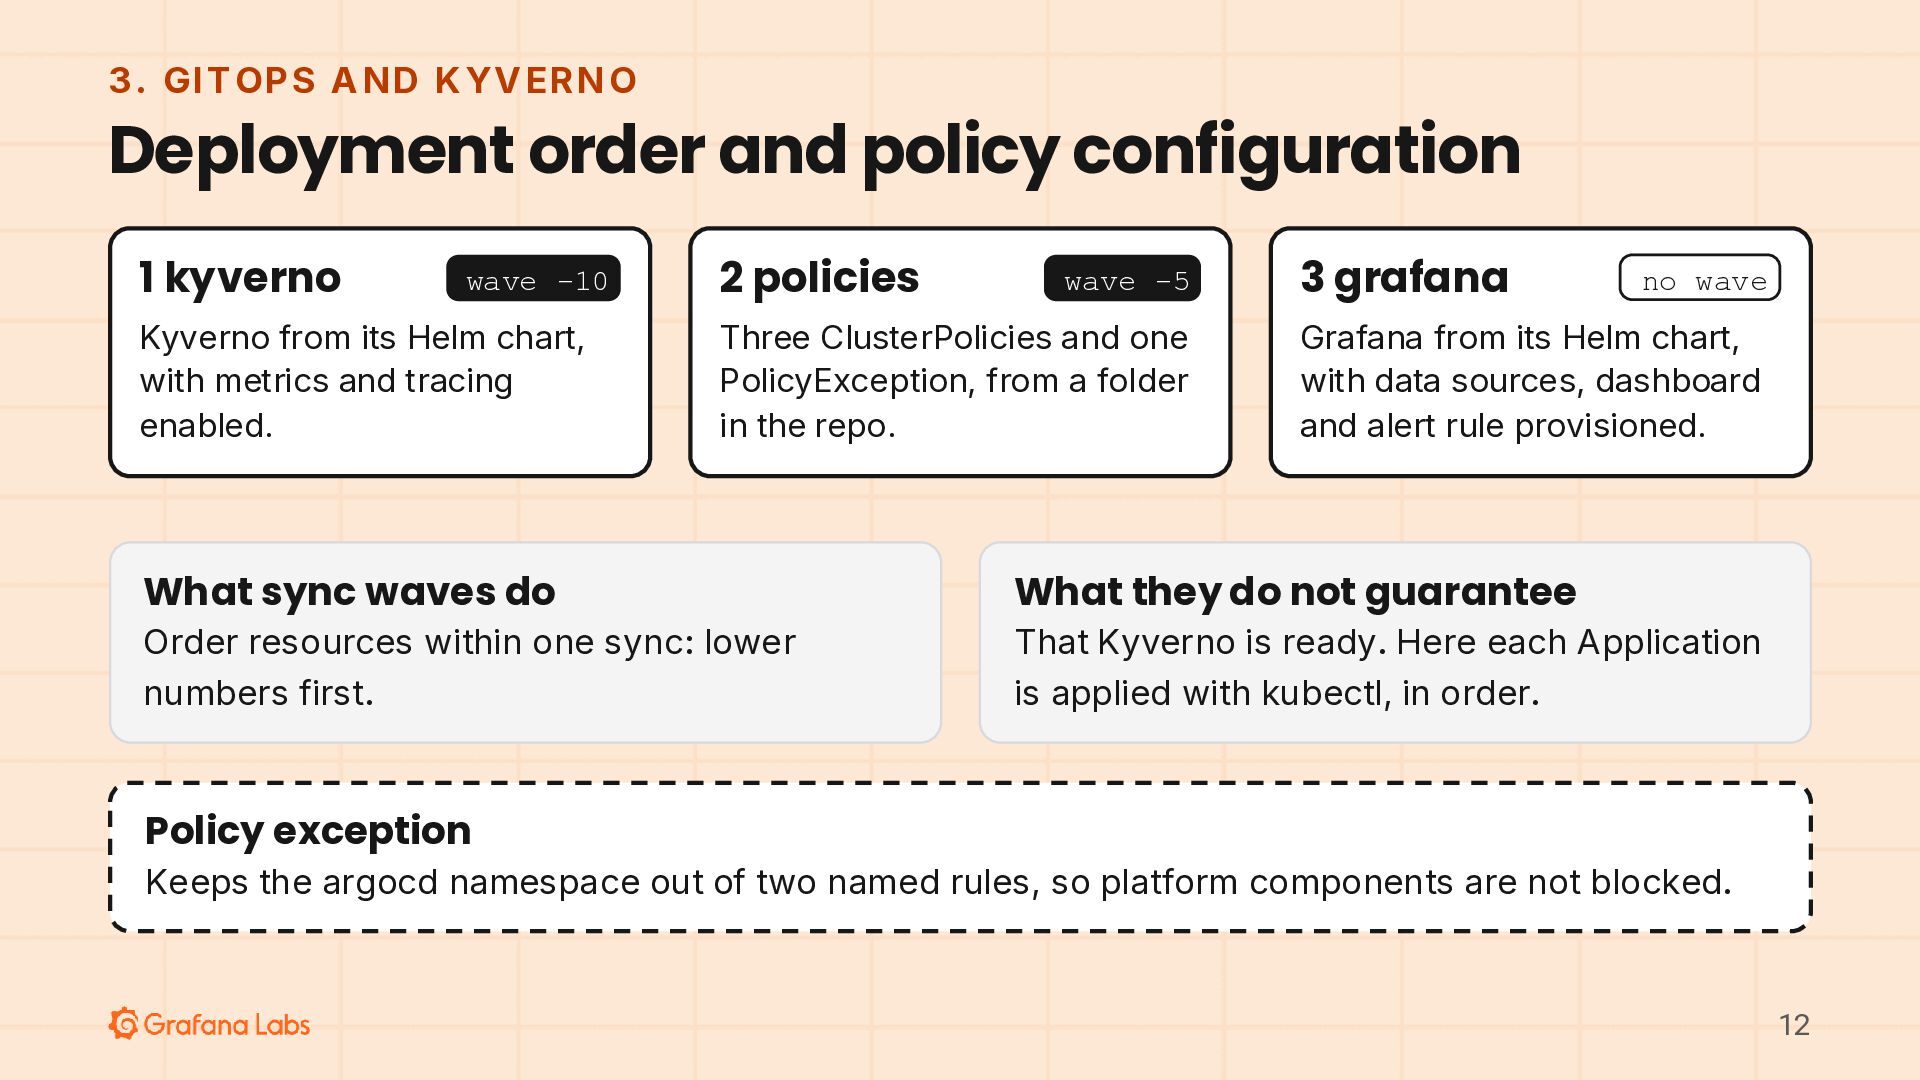
N O Deployment order and policy configuration 1 kyverno wave -10 Kyverno from its Helm chart, with metrics and tracing enabled. 2 policies wave -5 Three ClusterPolicies and one PolicyException, from a folder in the repo. 3 grafana no wave Grafana from its Helm chart, with data sources, dashboard and alert rule provisioned. What sync waves do What they do not guarantee Order resources within one sync: lower numbers first. That Kyverno is ready. Here each Application is applied with kubectl, in order. Policy exception Keeps the argocd namespace out of two named rules, so platform components are not blocked. 12 -
4. OBS E R VABI LI TY AN D DE
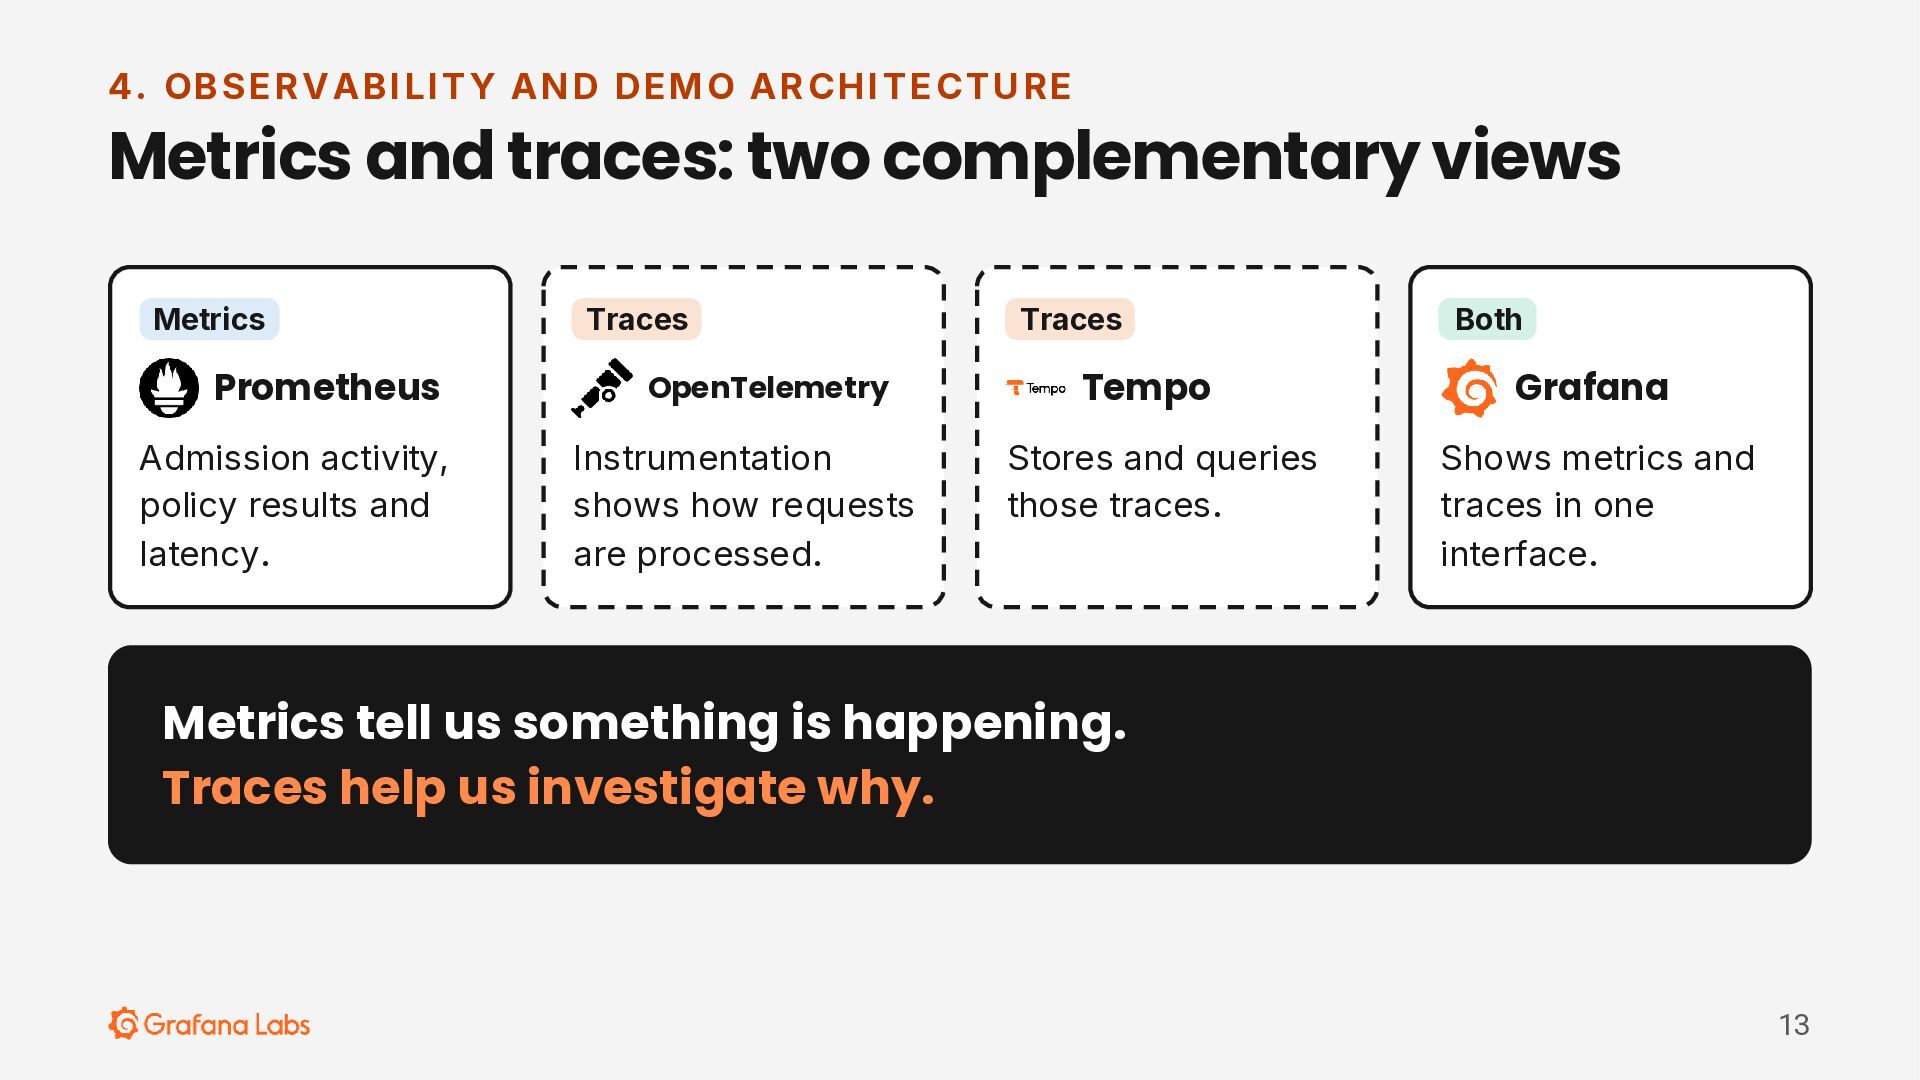
M O AR CHI TE CTU RE Metrics and traces: two complementary views Metrics Prometheus Admission activity, policy results and latency. Traces OpenTelemetry Instrumentation shows how requests are processed. Traces Both Tempo Grafana Stores and queries those traces. Shows metrics and traces in one interface. Metrics tell us something is happening. Traces help us investigate why. 13 -
Demo architecture L OCA L KI ND CL US TE
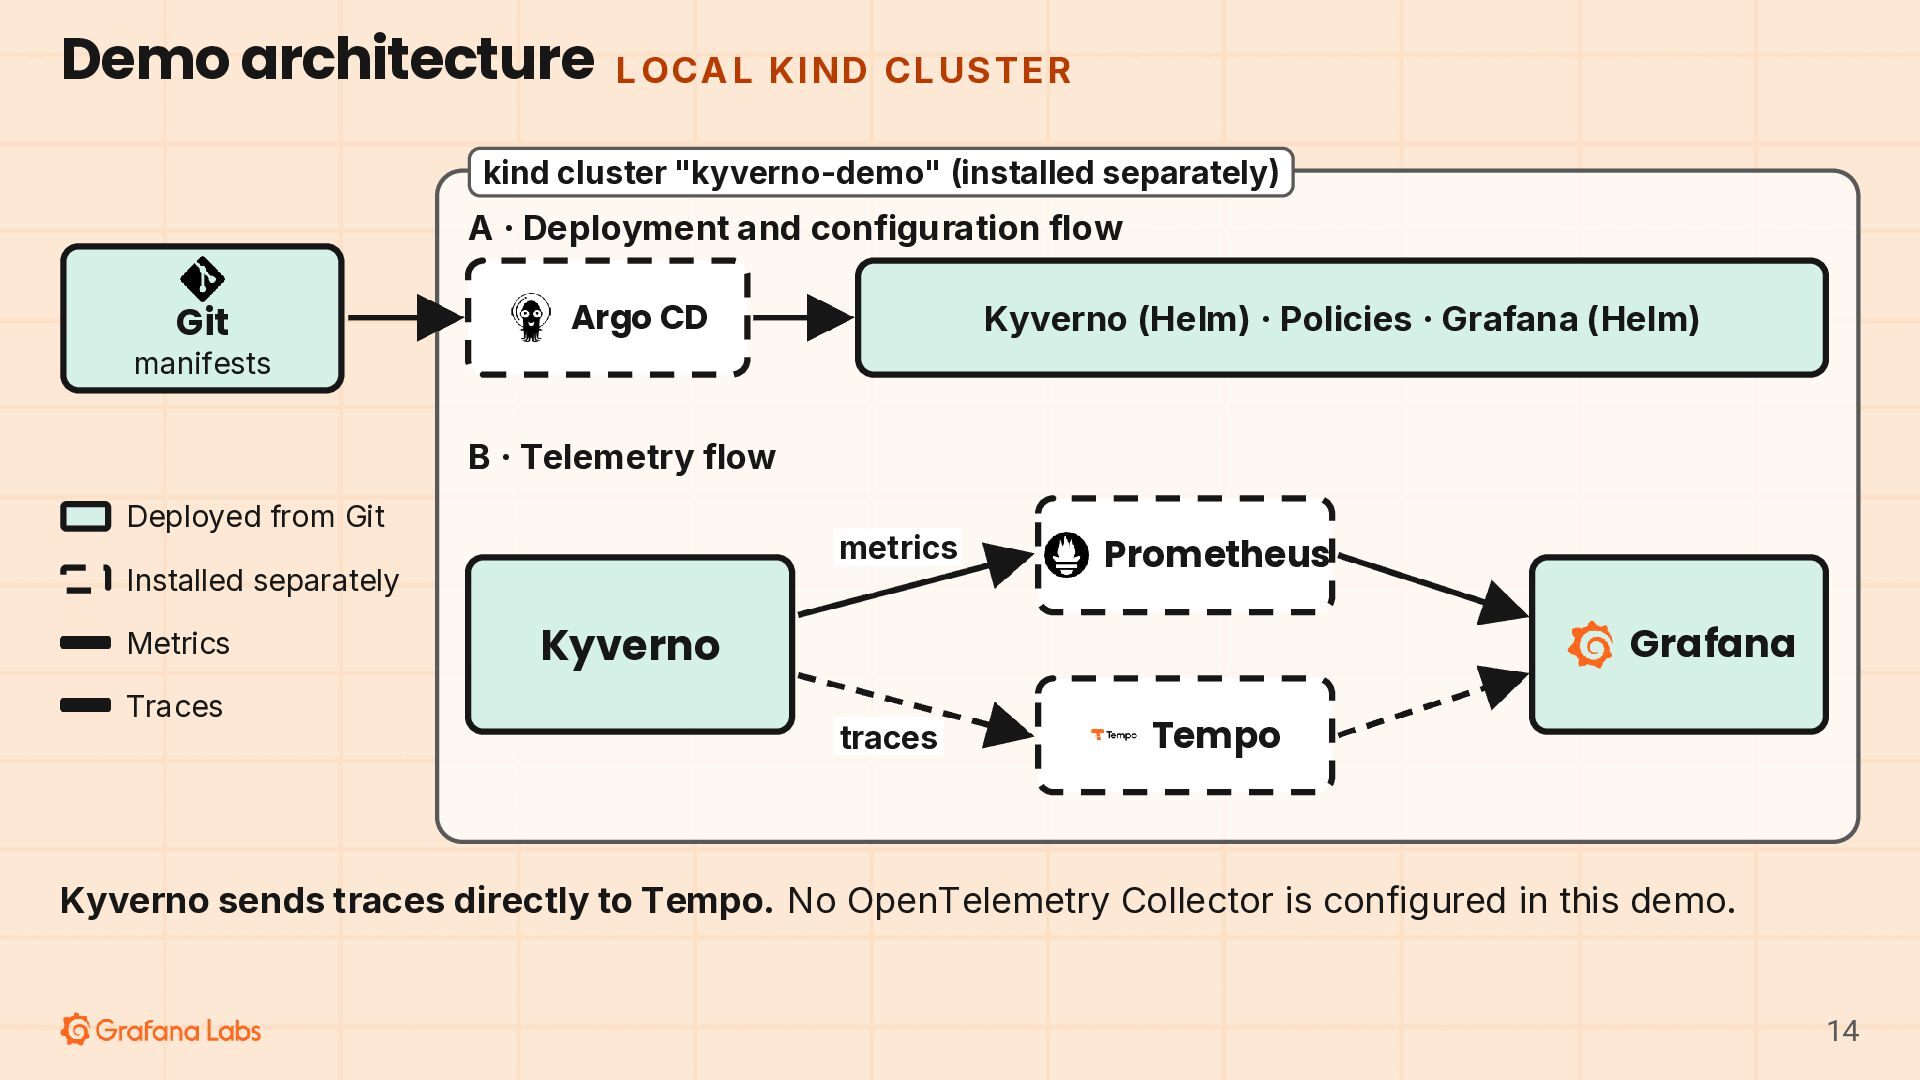
R kind cluster "kyverno-demo" (installed separately) A · Deployment and configuration flow Git Argo CD Kyverno (Helm) · Policies · Grafana (Helm) manifests B · Telemetry flow Deployed from Git metrics Installed separately Metrics Traces Prometheus Kyverno Grafana traces Tempo Kyverno sends traces directly to Tempo. No OpenTelemetry Collector is configured in this demo. 14 -
4. OBS E R VABI LI TY AN D DE
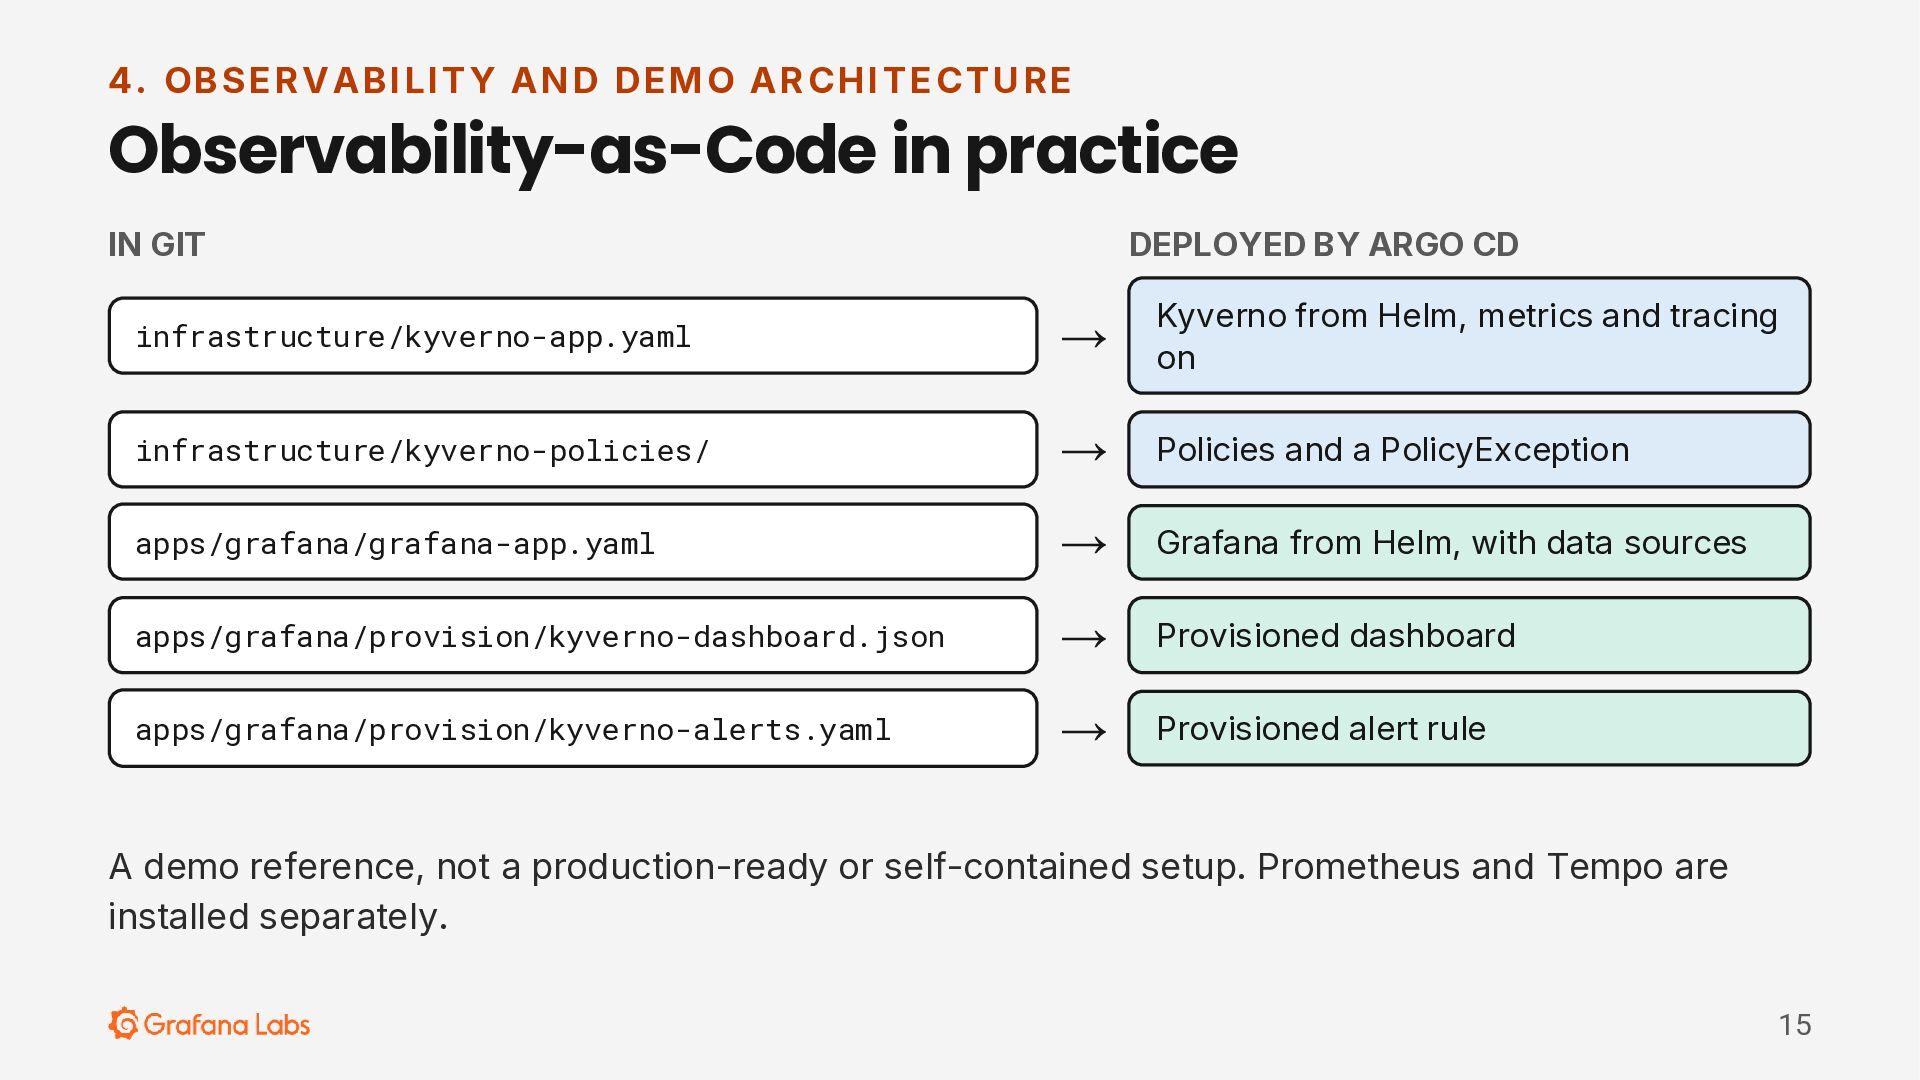
M O AR CHI TE CTU RE Observability-as-Code in practice IN GIT DEPLOYED BY ARGO CD infrastructure/kyverno-app.yaml → Kyverno from Helm, metrics and tracing on infrastructure/kyverno-policies/ → Policies and a PolicyException apps/grafana/grafana-app.yaml → Grafana from Helm, with data sources apps/grafana/provision/kyverno-dashboard.json → Provisioned dashboard apps/grafana/provision/kyverno-alerts.yaml → Provisioned alert rule A demo reference, not a production-ready or self-contained setup. Prometheus and Tempo are installed separately. 15 -
5. T HE DE M O S CEN AR I
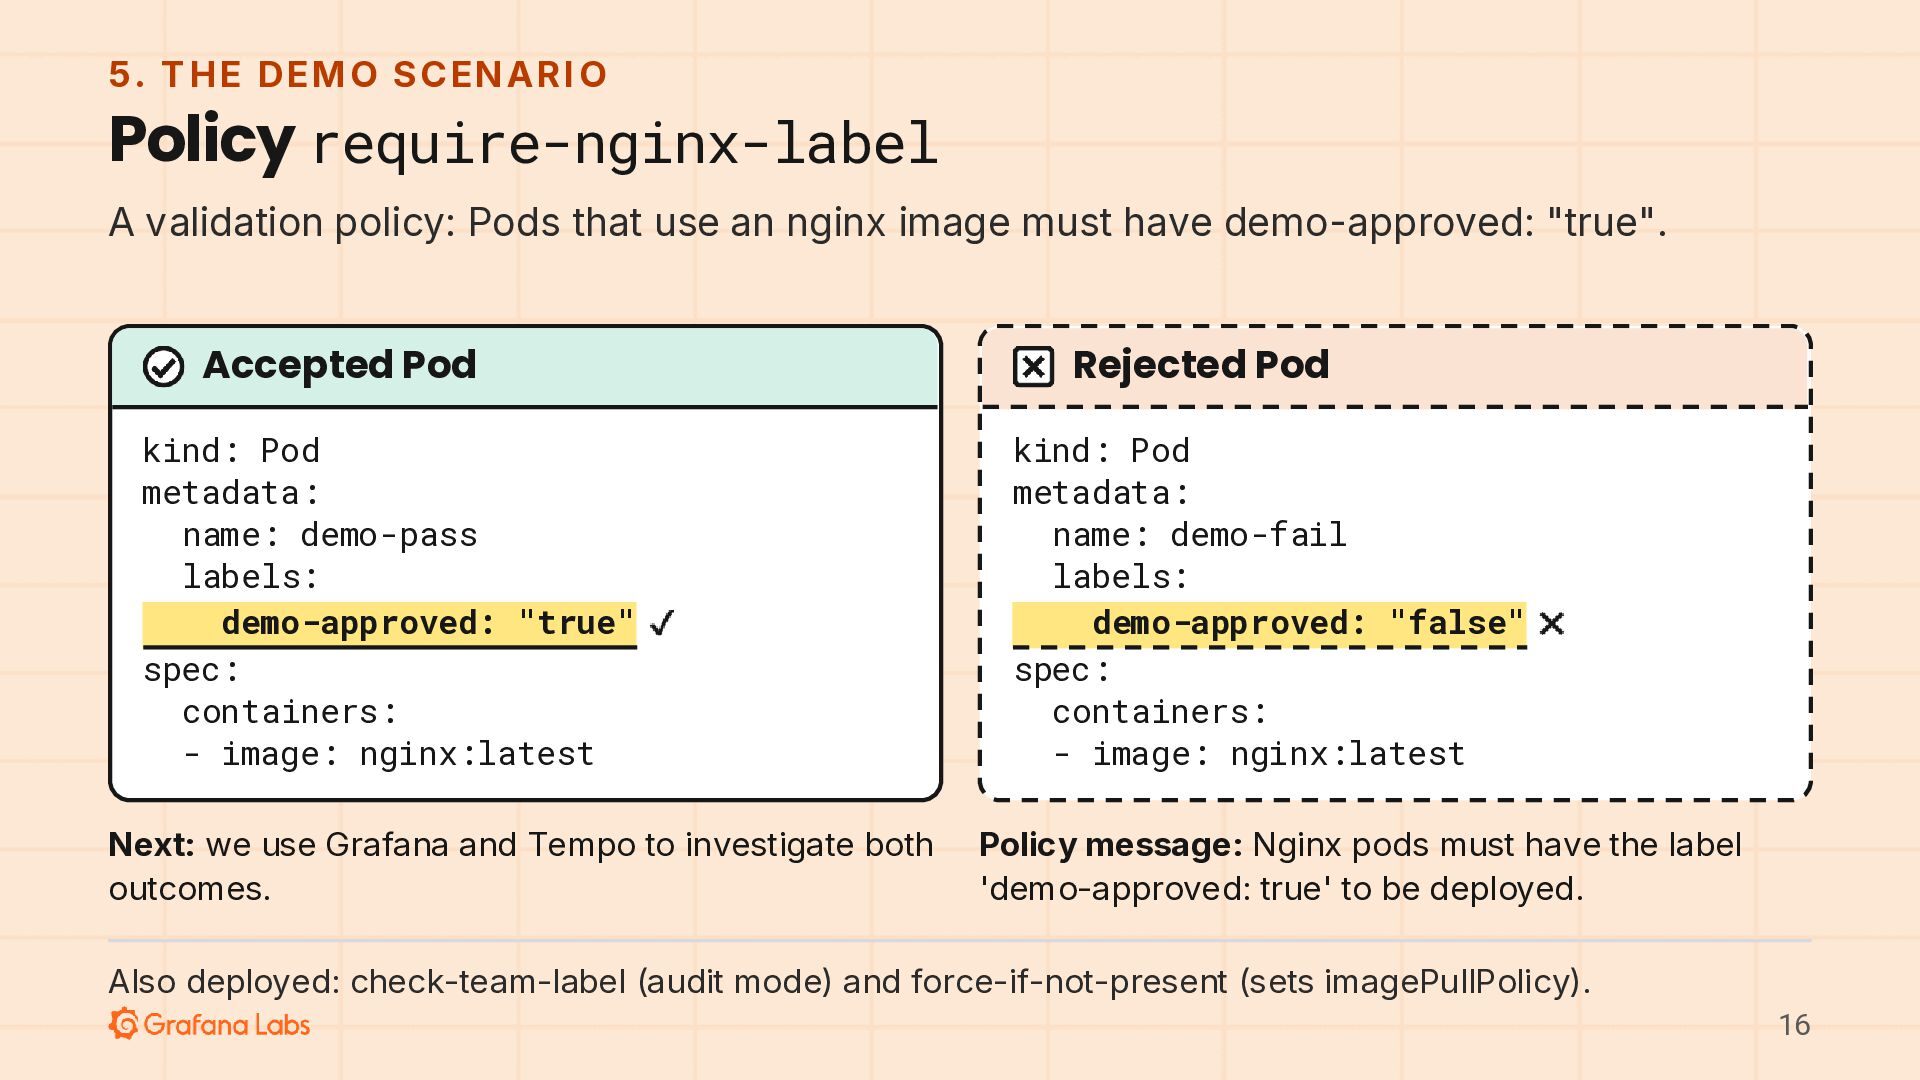
O Policy require-nginx-label A validation policy: Pods that use an nginx image must have demo-approved: "true". Accepted Pod kind: Pod metadata: name: demo-pass labels: demo-approved: "true" spec: containers: - image: nginx:latest Next: we use Grafana and Tempo to investigate both outcomes. Rejected Pod kind: Pod metadata: name: demo-fail labels: demo-approved: "false" spec: containers: - image: nginx:latest Policy message: Nginx pods must have the label 'demo-approved: true' to be deployed. Also deployed: check-team-label (audit mode) and force-if-not-present (sets imagePullPolicy). 16 -
5. T HE DE M O S CEN AR I
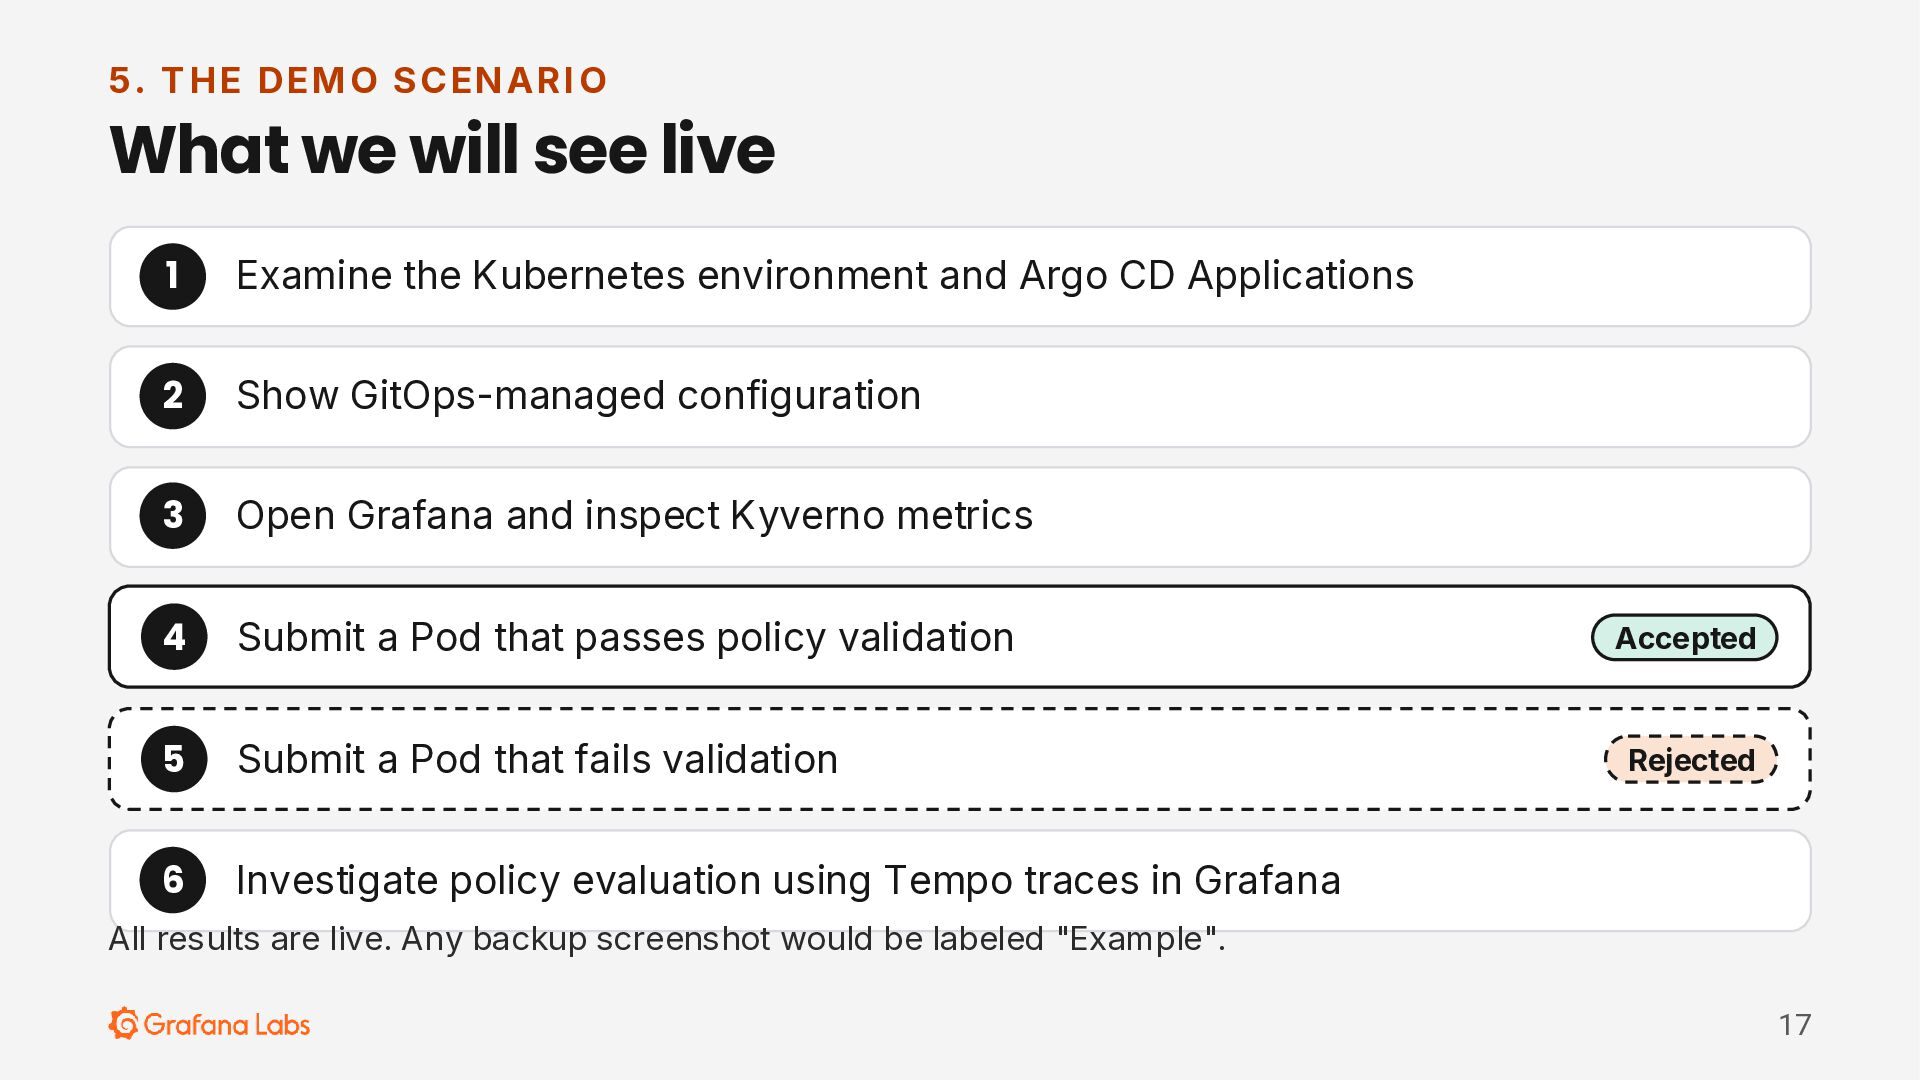
O What we will see live 1 Examine the Kubernetes environment and Argo CD Applications 2 Show GitOps-managed configuration 3 Open Grafana and inspect Kyverno metrics 4 Submit a Pod that passes policy validation Accepted 5 Submit a Pod that fails validation Rejected 6 Investigate policy evaluation using Tempo traces in Grafana All results are live. Any backup screenshot would be labeled "Example". 17 -
D EM O T I ME Live Demo GitOps, Kyverno,
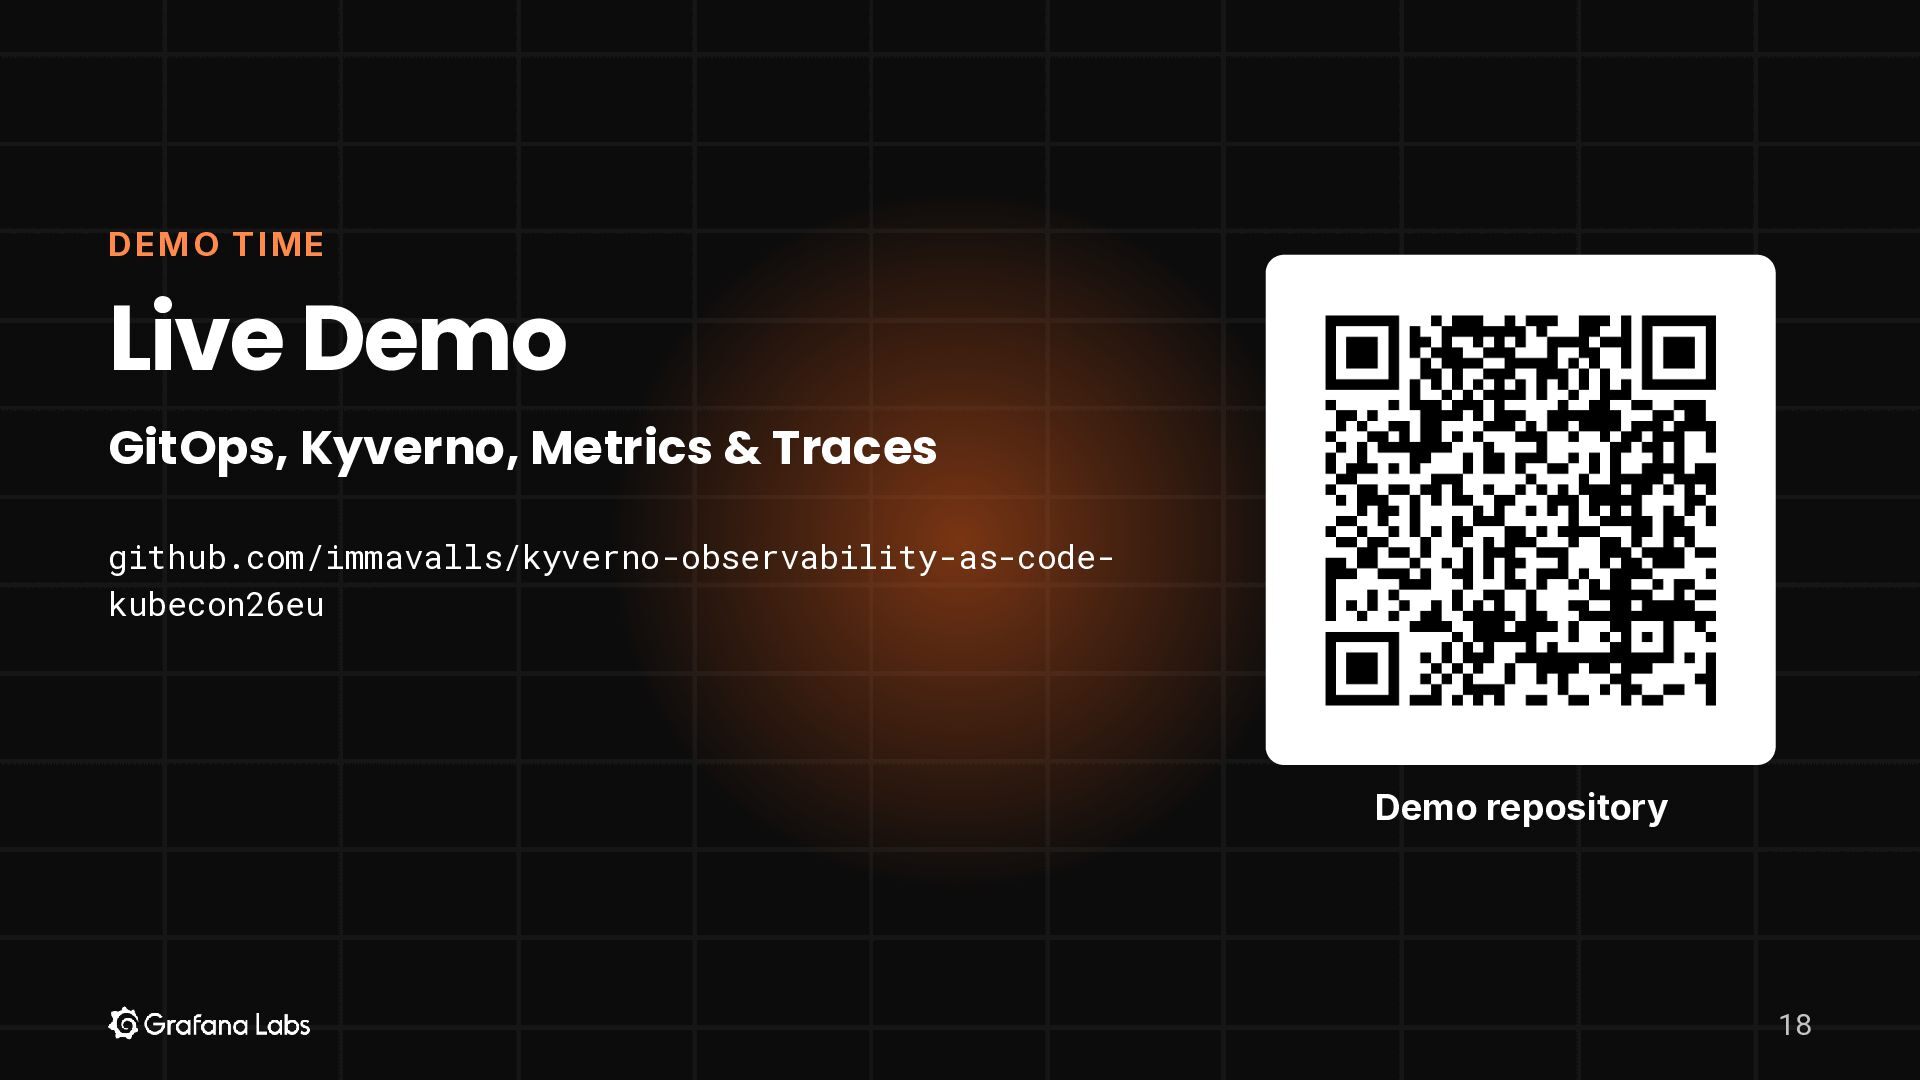
Metrics & Traces github.com/immavalls/kyverno-observability-as-codekubecon26eu Demo repository 18 -
6 . K EY TA KE AWA YS Three things
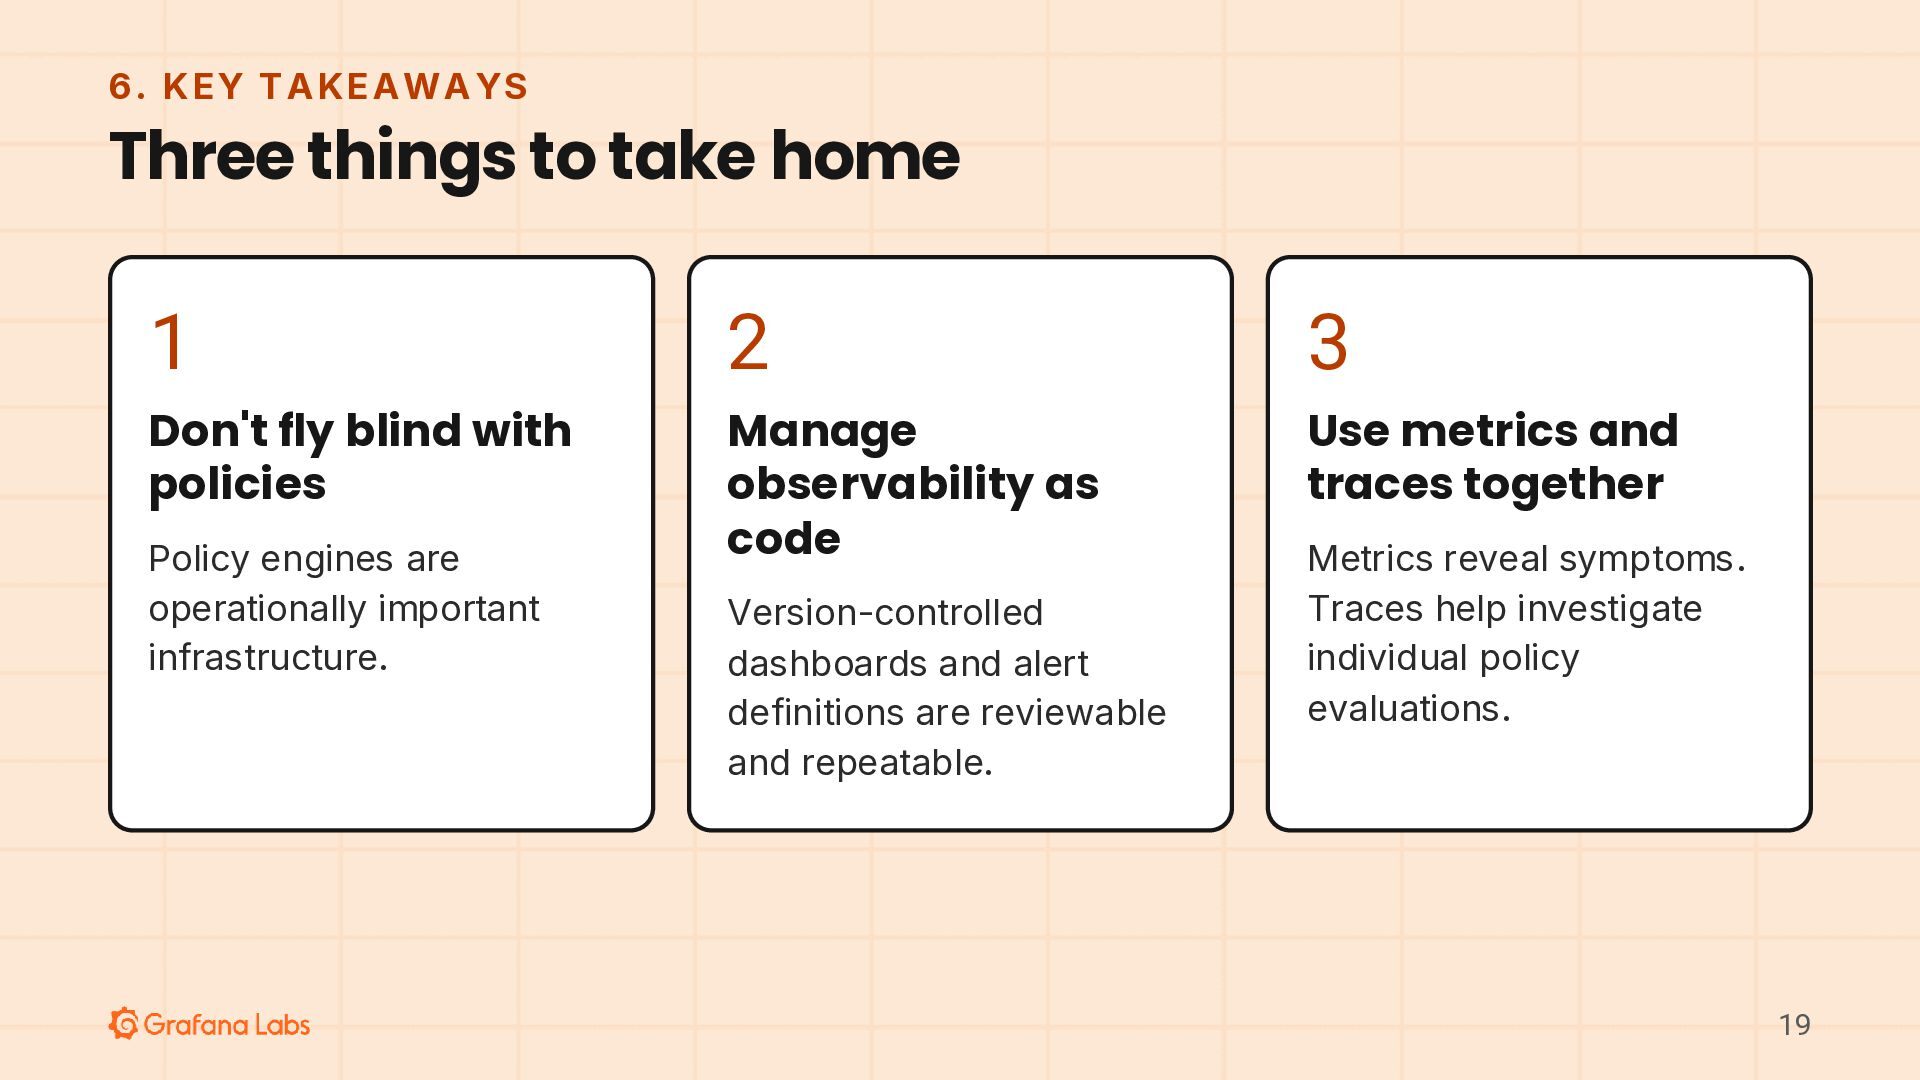
to take home 1 2 3 Don't fly blind with policies Manage observability as code Use metrics and traces together Policy engines are operationally important infrastructure. Version-controlled dashboards and alert definitions are reviewable and repeatable. Metrics reveal symptoms. Traces help investigate individual policy evaluations. 19 -
Thank you. Questions? Imma Valls · Staff Developer Advocate, Grafana
Labs Demo repository Slides github.com/immavalls/kyvernoobservability-as-codekubecon26eu eyeveebee.dev/fullobservability-forkyverno-withobservability-as-code2 20