Upgrade to Pro — share decks privately, control downloads, hide ads and more …

Integrating empirical and simulated big data in theory testing for urban systems

Integrating empirical and simulated big data in theory testing for urban systems

DENISE PUMAIN
JULIE FEN-CHONG
CLARA SCHMITT

Insite Project

May 05, 2014
Tweet

More Decks by Insite Project

Other Decks in Research

Transcript

  1. Cities and Systems of cities as generalised ICT • Cities

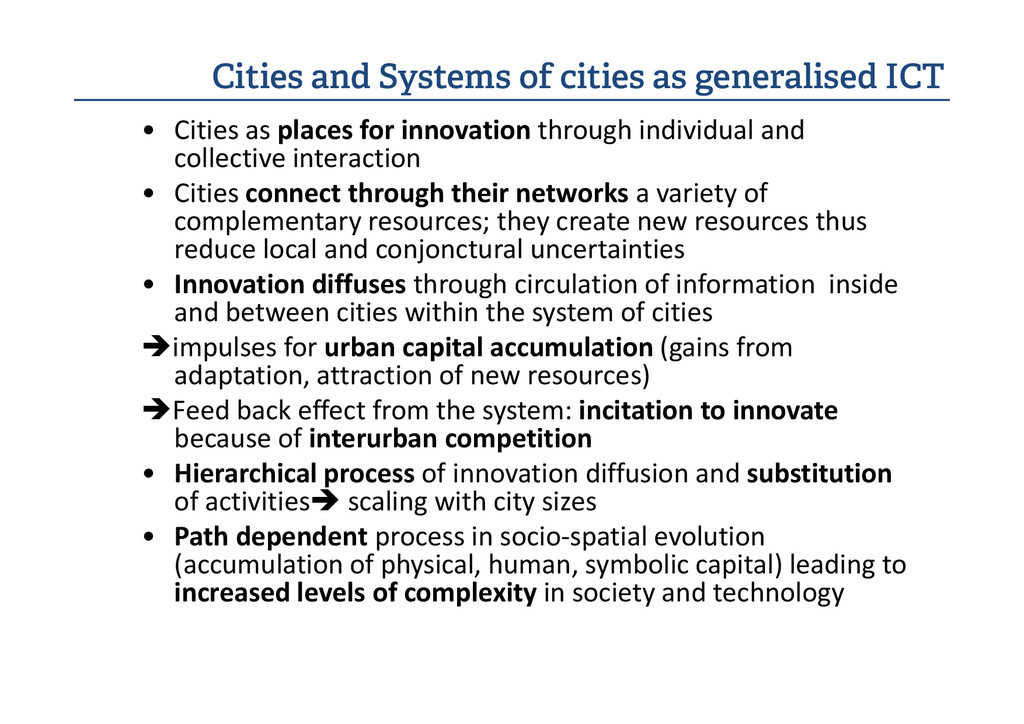
    as places for innovation through individual and collective interaction • Cities connect through their networks a variety of complementary resources; they create new resources thus reduce local and conjonctural uncertainties • Innovation diffuses through circulation of information inside and between cities within the system of cities impulses for urban capital accumulation (gains from adaptation, attraction of new resources) impulses for urban capital accumulation (gains from adaptation, attraction of new resources) Feed back effect from the system: incitation to innovate because of interurban competition • Hierarchical process of innovation diffusion and substitution of activities scaling with city sizes • Path dependent process in socio-spatial evolution (accumulation of physical, human, symbolic capital) leading to increased levels of complexity in society and technology
  2. Urban systems as societal adaptators / creators MESO-LEVEL: the city

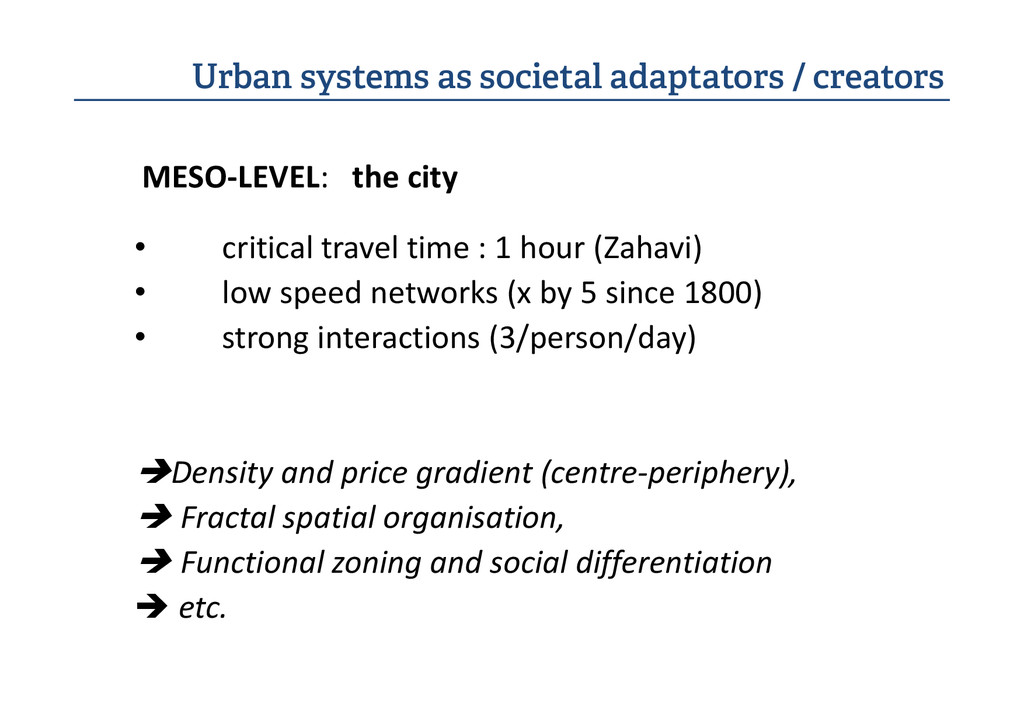
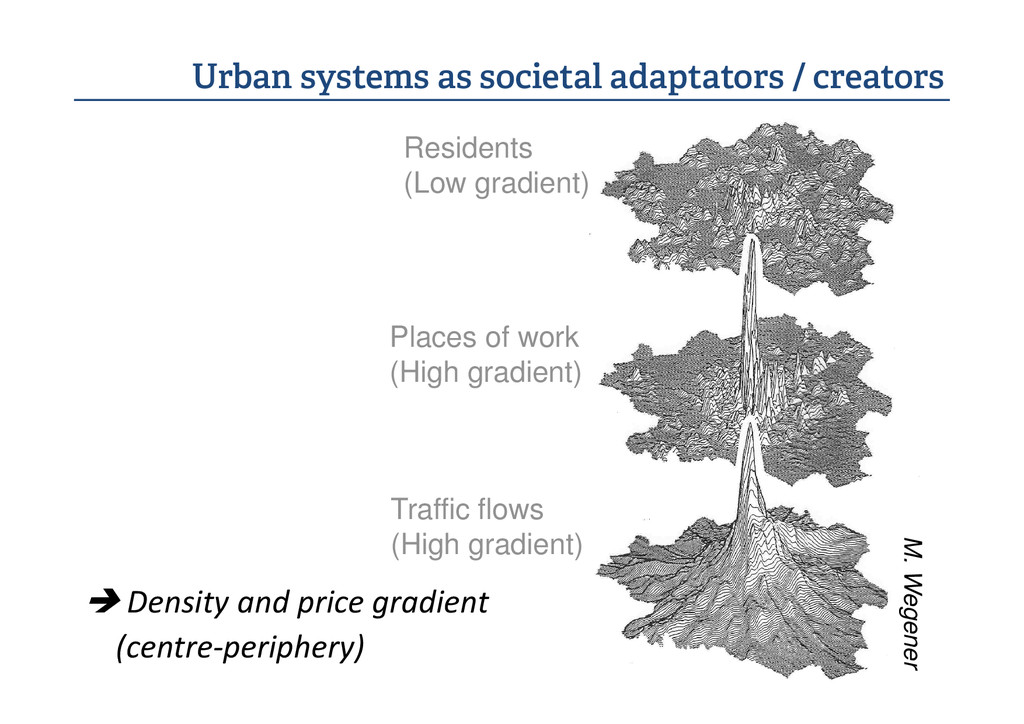
    • critical travel time : 1 hour (Zahavi) • low speed networks (x by 5 since 1800) • strong interactions (3/person/day) Density and price gradient (centre-periphery), Fractal spatial organisation, Functional zoning and social differentiation etc.
  3. Urban systems as societal adaptators / creators Residents (Low gradient)

    Places of work (High gradient) Density and price gradient (centre-periphery) M. Wegener (High gradient) Traffic flows (High gradient)
  4. • Urban theory: Observed big data and intra-urban evolution Centrality

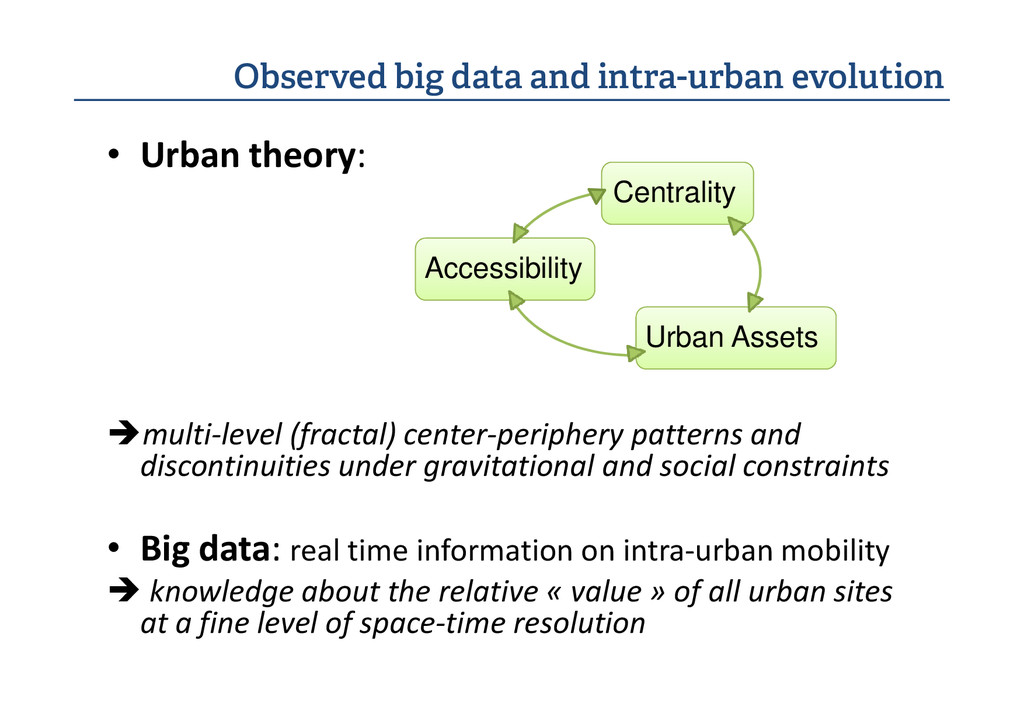
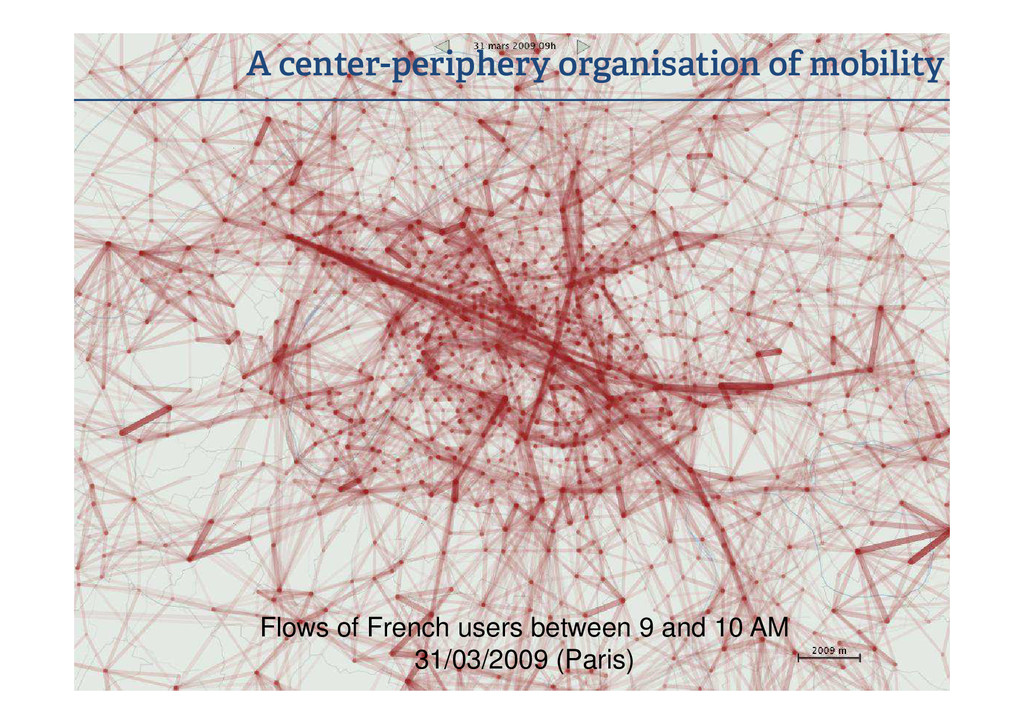
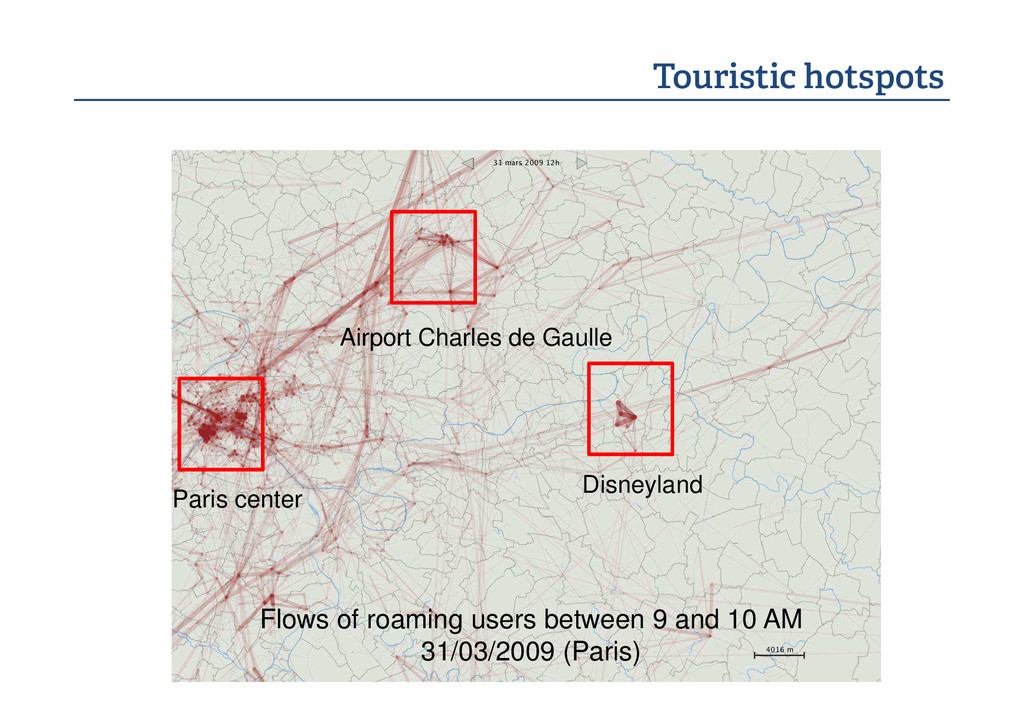
    Urban Assets Accessibility multi-level (fractal) center-periphery patterns and discontinuities under gravitational and social constraints • Big data: real time information on intra-urban mobility knowledge about the relative « value » of all urban sites at a fine level of space-time resolution
  5. • Ile-de-France Region • 12 000 square meters • Anonymous

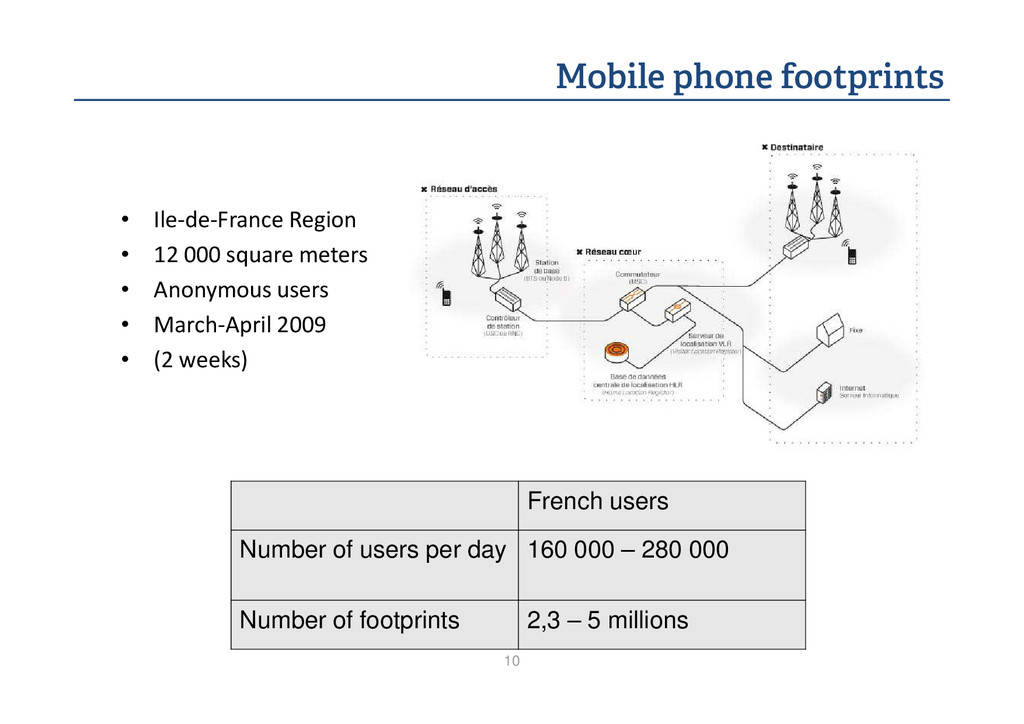
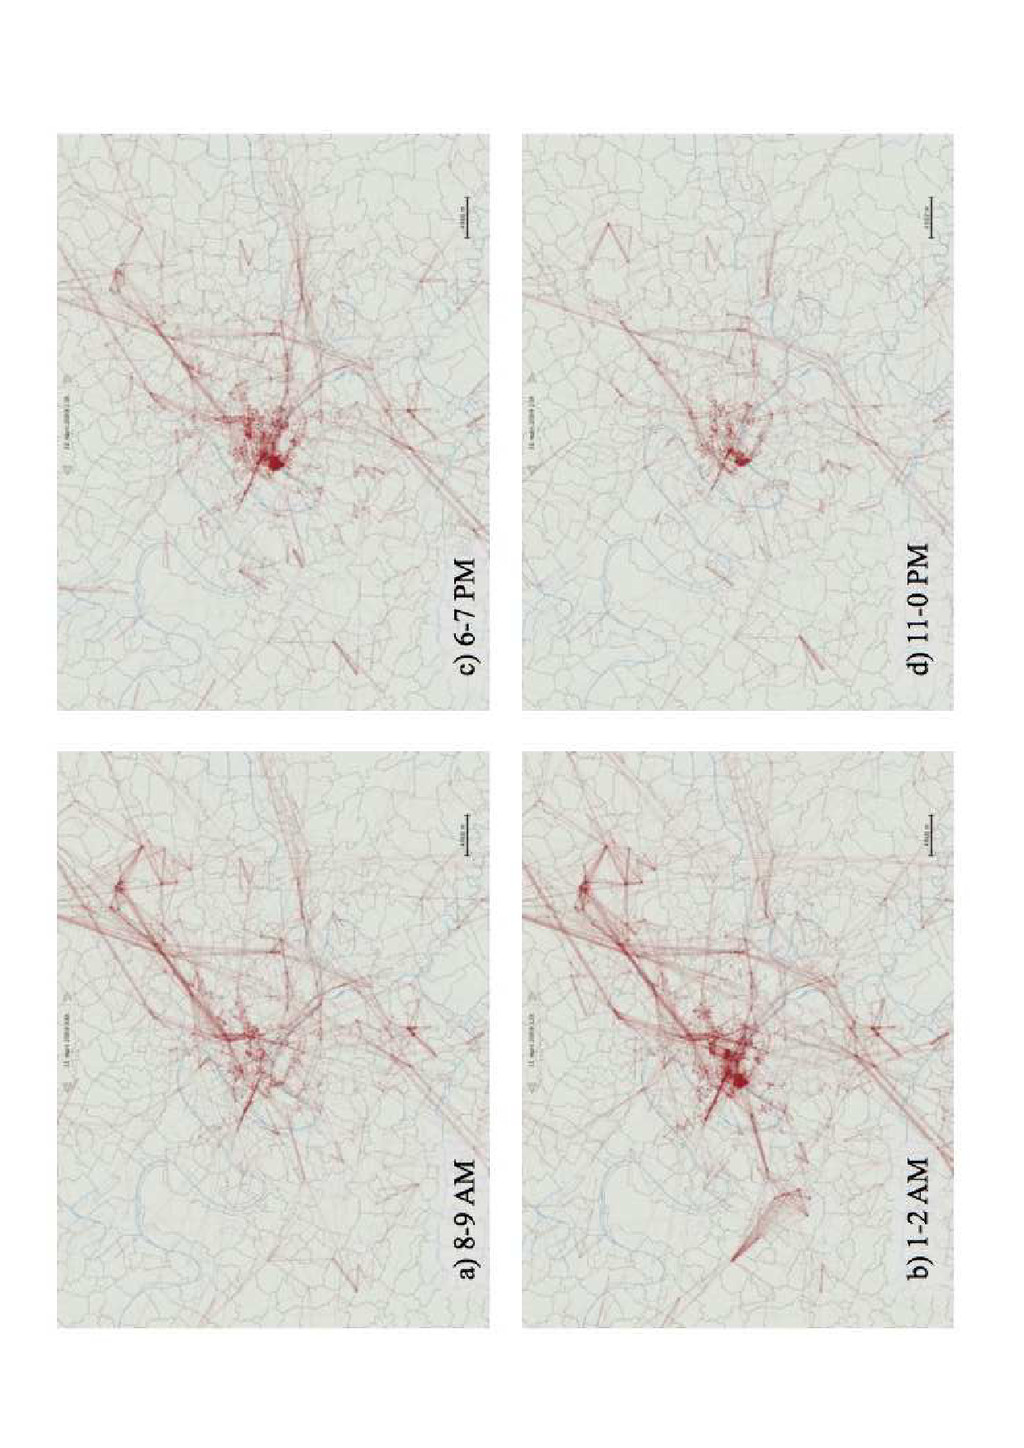
    users • March-April 2009 • (2 weeks) Mobile phone footprints 10 • (2 weeks) French users Number of users per day 160 000 – 280 000 Number of footprints 2,3 – 5 millions
  6. Cell area Cities boundaries Cell borders Imprecision issues Network imprecision

    (center/periphery gradient) Network station (x,y coordinates) Imprecise location Stop ? 12:00:00 ? 22:00:00 Temporal imprecision (uncertainty)
  7. From individual footprints to the rythms of a city First

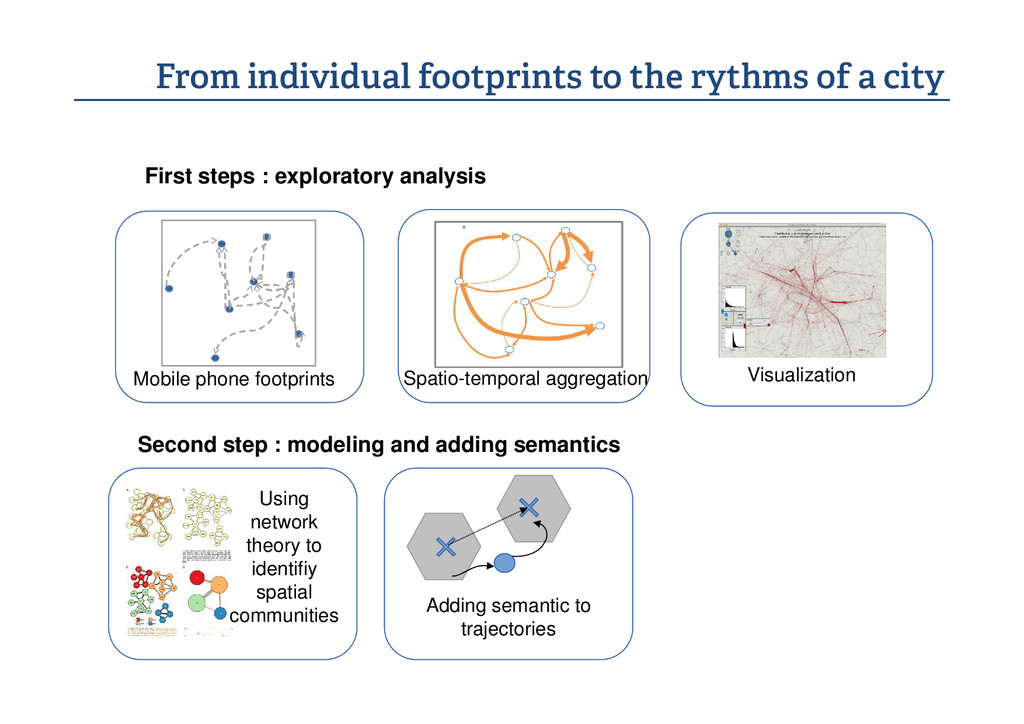
    steps : exploratory analysis Mobile phone footprints Visualization Spatio-temporal aggregation Second step : modeling and adding semantics Using network theory to identifiy spatial communities Adding semantic to trajectories
  8. The rythms of the city Mean vectors of flows at

    6 PM Mean vectors of flows at 9 AM
  9. Airport Charles de Gaulle Touristic hotspots Disneyland Paris center Flows

    of roaming users between 9 and 10 AM 31/03/2009 (Paris)
  10. Urban systems as societal adaptators / creators MACRO-LEVEL: system of

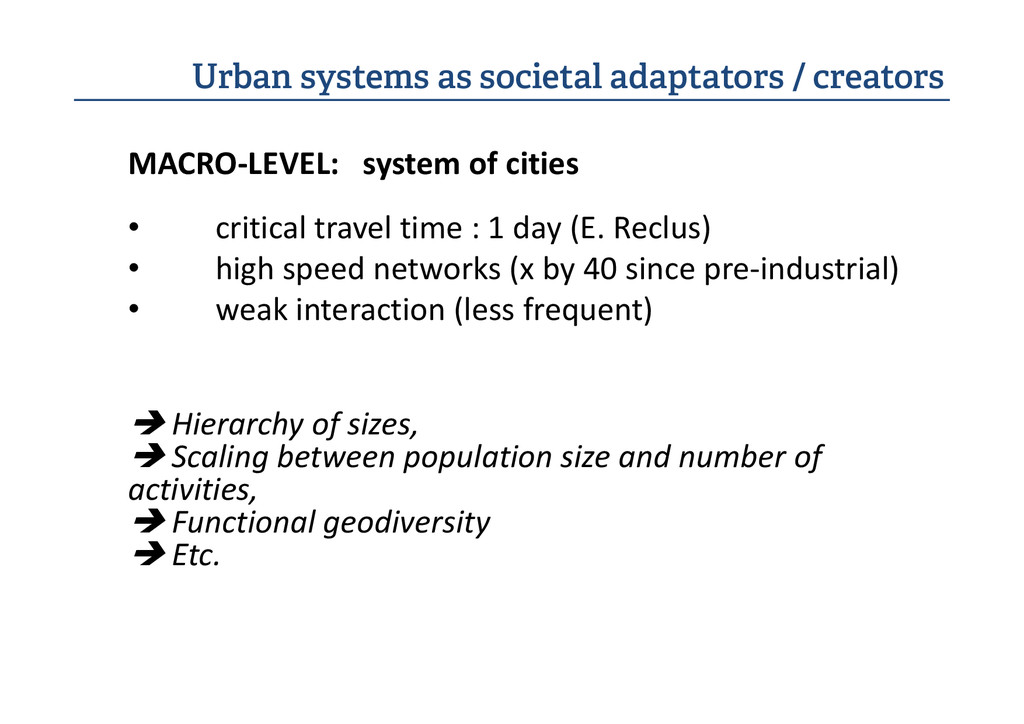
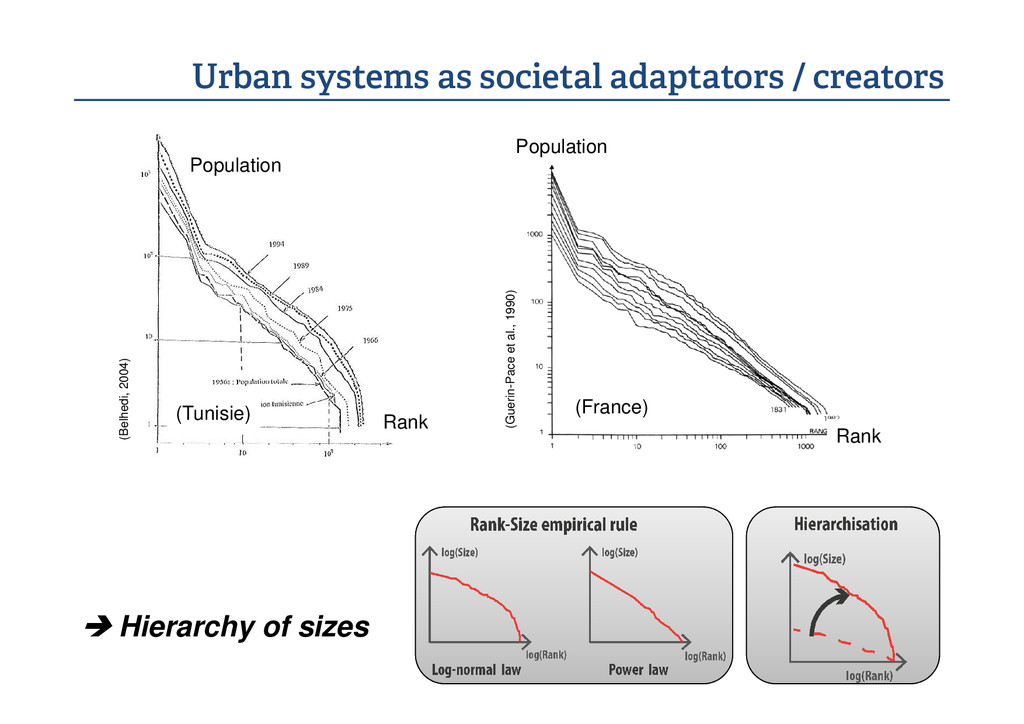
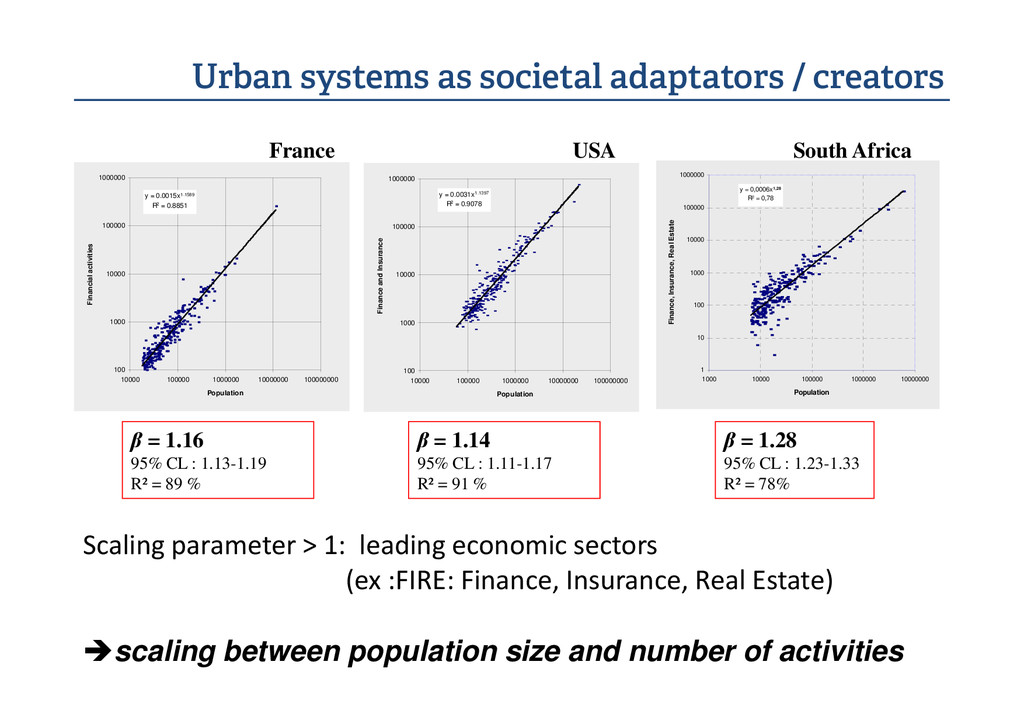
    cities • critical travel time : 1 day (E. Reclus) • high speed networks (x by 40 since pre-industrial) • weak interaction (less frequent) Hierarchy of sizes, Scaling between population size and number of activities, Functional geodiversity Etc.
  11. Urban systems as societal adaptators / creators Population (Belhedi, 2004)

    Population Pace et al., 1990) Hierarchy of sizes Rank (France) (Tunisie) (Belhedi, 2004) Rank (Guerin-Pace et al., 1990)
  12. Urban systems as societal adaptators / creators y = 0.0015x1.1589

    R2 = 0.8851 1000 10000 100000 1000000 Financial activities y = 0.0031x1.1397 R2 = 0.9078 1000 10000 100000 1000000 Finance and Insurance France USA South Africa y = 0,0006x1,28 R2 = 0,78 10 100 1000 10000 100000 1000000 Finance, Insurance, Real Estate scaling between population size and number of activities Scaling parameter > 1: leading economic sectors (ex :FIRE: Finance, Insurance, Real Estate) 100 10000 100000 1000000 10000000 100000000 Population 100 10000 100000 1000000 10000000 100000000 Population 1 1000 10000 100000 1000000 10000000 Population β = 1.14 95% CL : 1.11-1.17 R² = 91 % β = 1.28 95% CL : 1.23-1.33 R² = 78% β = 1.16 95% CL : 1.13-1.19 R² = 89 %
  13. Simulated big data and inter-urban competition • Urban theory: City

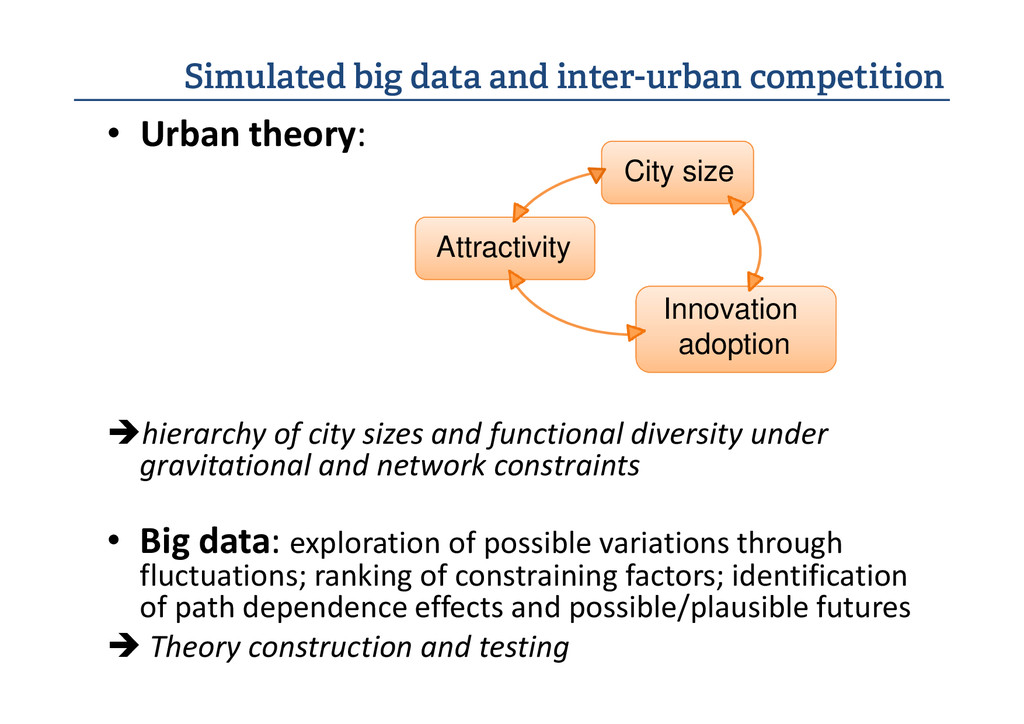
    size Innovation adoption Attractivity hierarchy of city sizes and functional diversity under gravitational and network constraints • Big data: exploration of possible variations through fluctuations; ranking of constraining factors; identification of path dependence effects and possible/plausible futures Theory construction and testing
  14. A lack of empirical data… Data & knowledge Theories y

    = 0.0031x1.1397 R2 = 0.9078 100 1000 10000 100000 1000000 10000 100000 1000000 10000000 100000000 Population Finance and Insurance y = 0,0006x1,28 R2 = 0,78 1 10 100 1000 10000 100000 1000000 1000 10000 100000 1000000 10000000 Population Finance, Insurance, Real Estate => Regularities to explains…. City size Innovation adoption Attractivity Set of hypothesis on the generative mechanisms of socio-spatial processes ? adoption
  15. A virtual laboratory to test theoritial hypothesis Simulation models Set

    of hypothesis on the generative mechanisms of socio-spatial processes Theories ? Simulation models Data & knowledge Simulation outputs
  16. SIMPOP (1996) URBAN EVOLUTIONARY THEORY SIMPOP 2 (2006) The Simpop

    familly First generation SimpopLocal & SimpopNet (2012) MARIUS (2014) (2012) Second generation
  17. Simulation models Data & Set of hypothesis on the generative

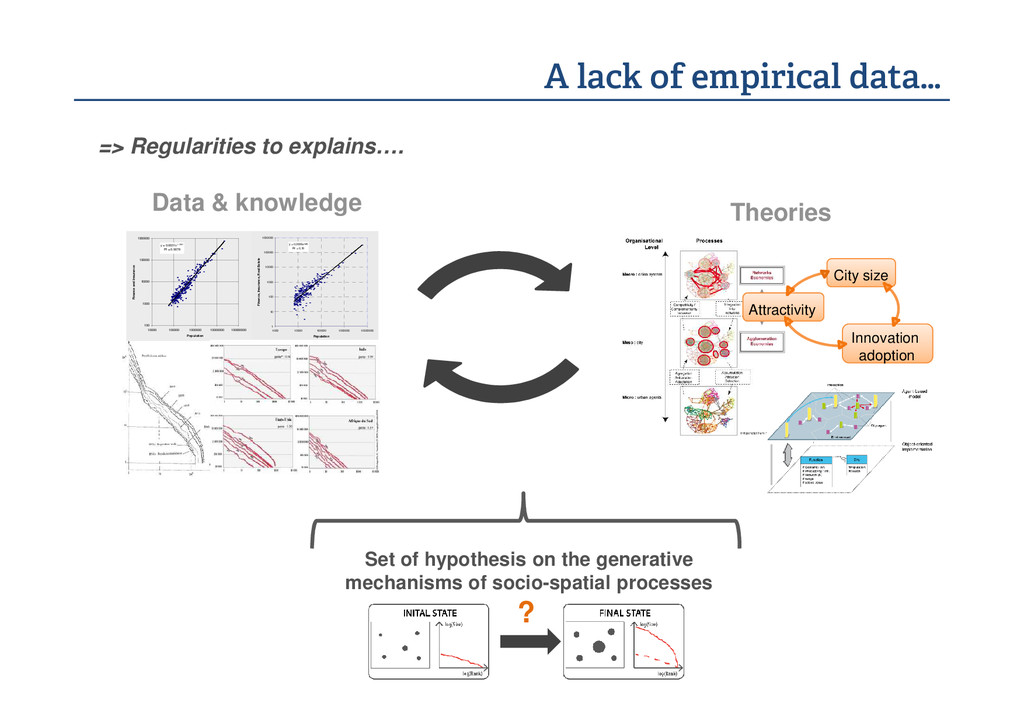
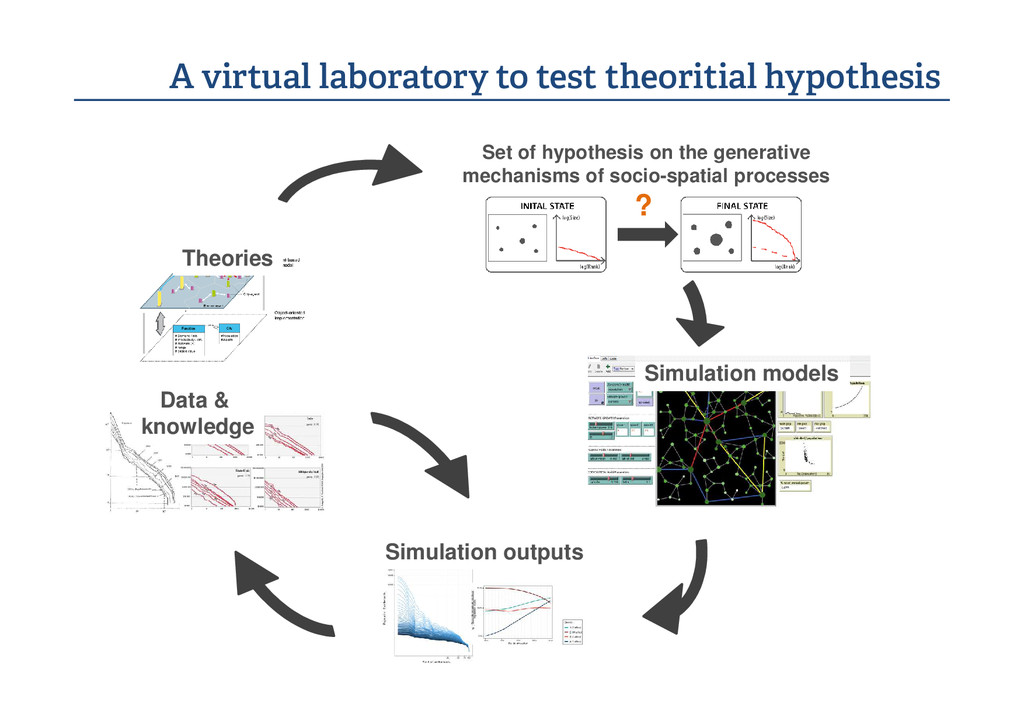
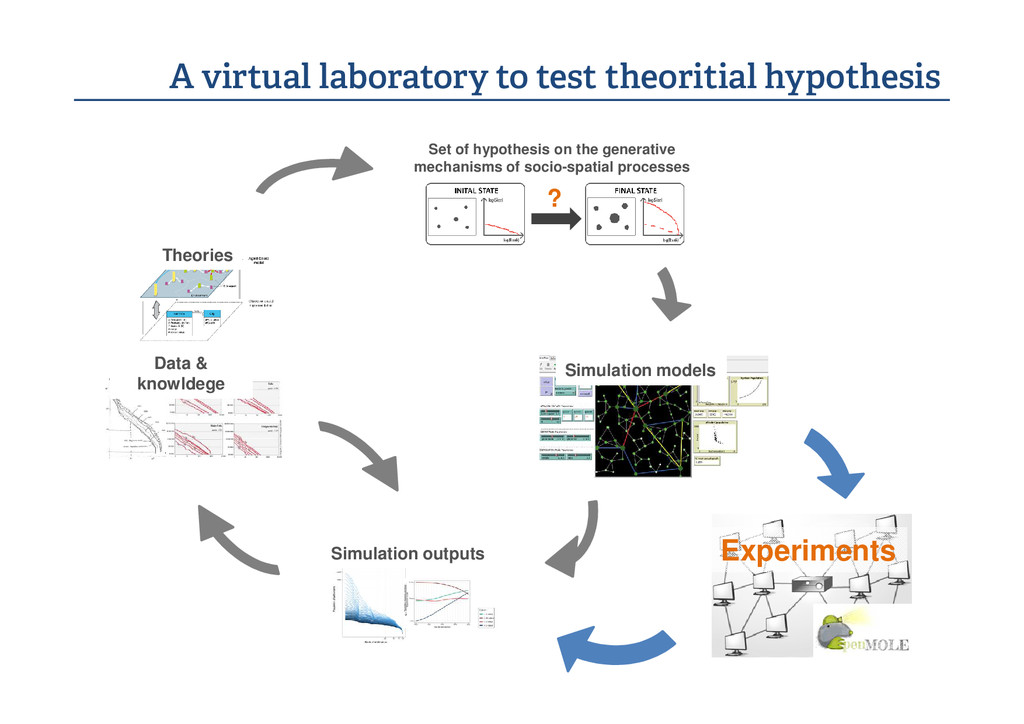
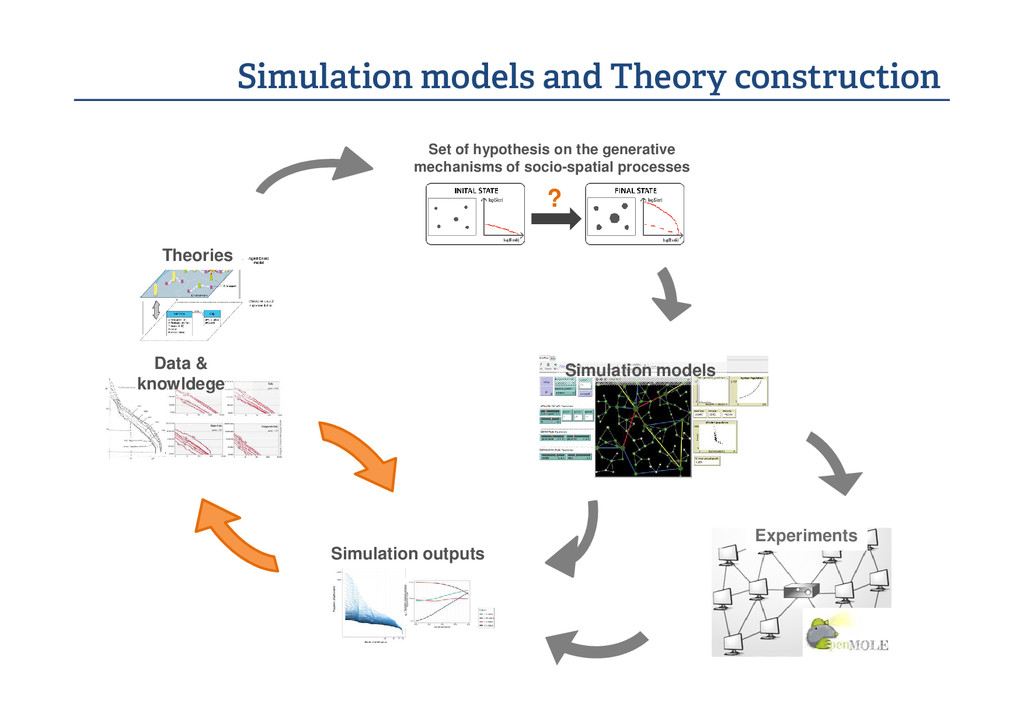
    mechanisms of socio-spatial processes Theories A virtual laboratory to test theoritial hypothesis ? Experiments Simulation models Data & knowldege Simulation outputs
  18. 1 Demographic growth 2 Innovation impact The SimpopLocal model 4

    Innovation acquistition By diffusion Pdiffusion = f(P i , P k , d ik ) Pi dik 3 Innovation acquistition by creation Pcreation = f(P i ) Pi Pk
  19. 3 1 2 3 calibration objectives : Data & Knowledge

    SimpopLocal : model evaluation by calibration Evaluation of the quality of the model calibration [calibration error]
  20. 3 1 2 Evaluation of the quality of the model

    calibration Simulation of SimpopLocal Evolutionnary algorithms SimpopLocal : model evaluation by calibration Grid computing
  21. Calibration error SimpopLocal : necessary mechanisms ? Innovation lifetime Calibration

    error Innovation diffusion probability Calibration error
  22. Simulation models Data & Set of hypothesis on the generative

    mechanisms of socio-spatial processes Theories Simulation models and Theory construction ? Experiments Simulation models Data & knowldege Simulation outputs