Upgrade to Pro — share decks privately, control downloads, hide ads and more …

Architecting Better Charts, FluentConf 2013 Keynote

Architecting Better Charts, FluentConf 2013 Keynote

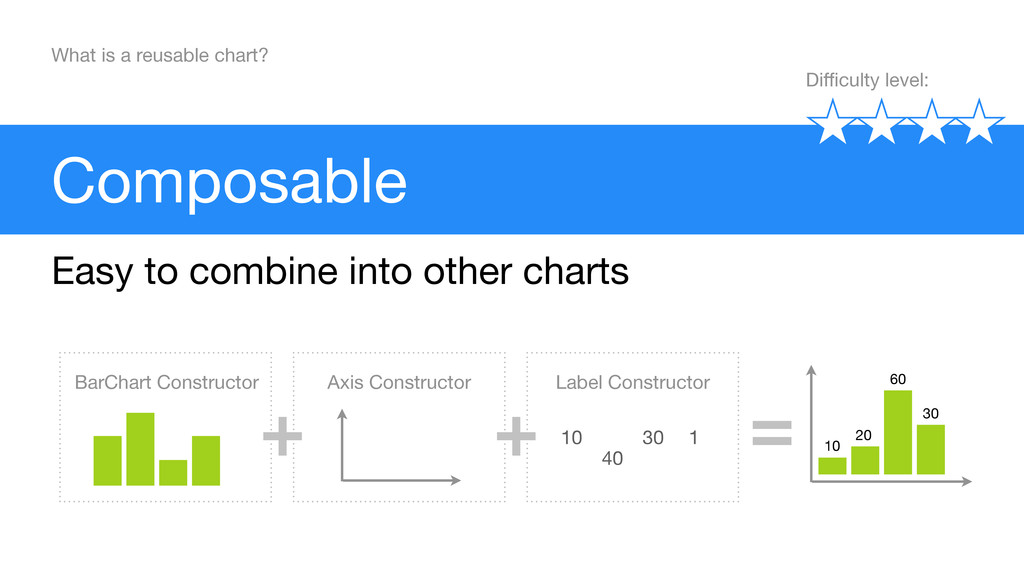
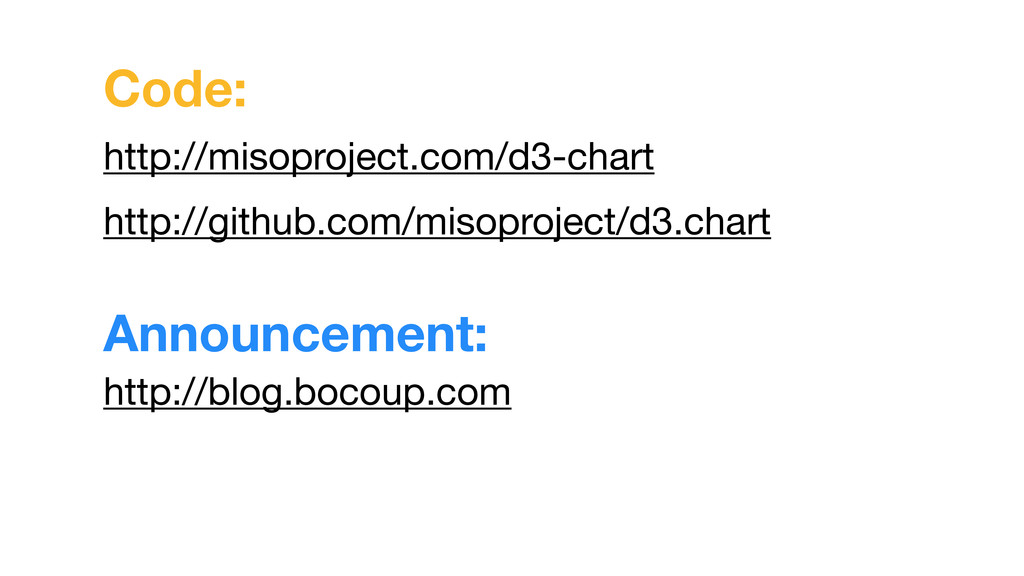
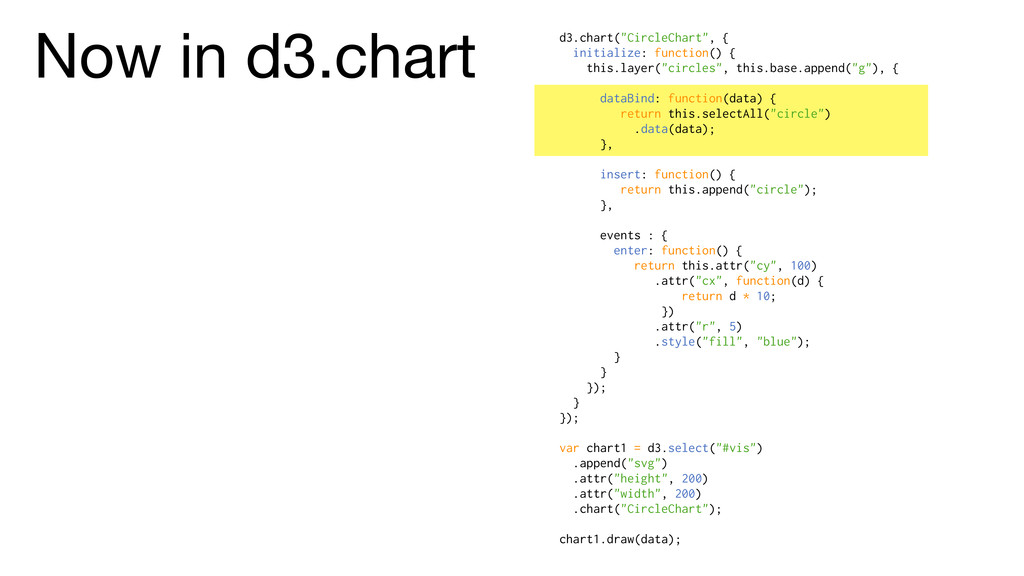
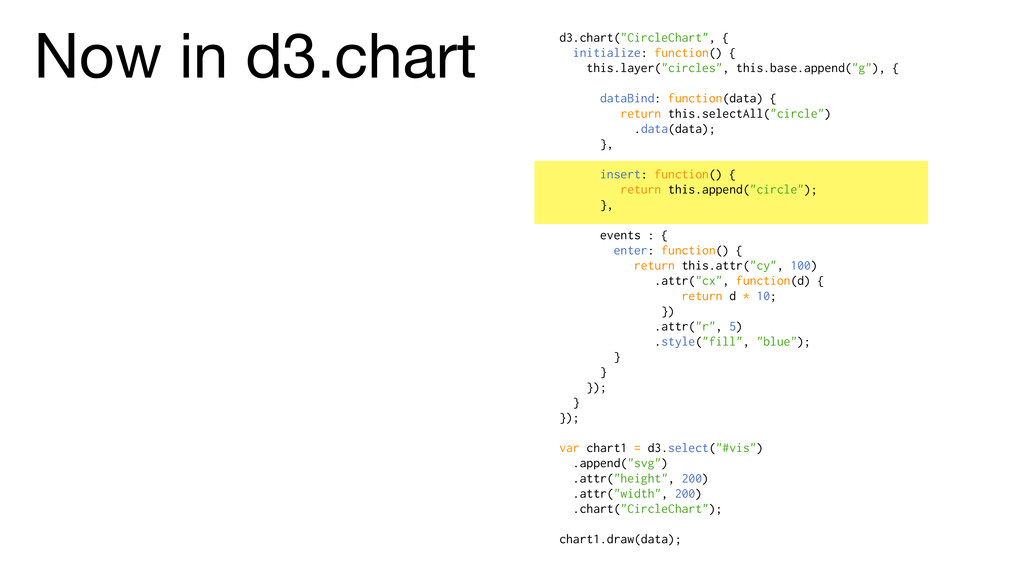
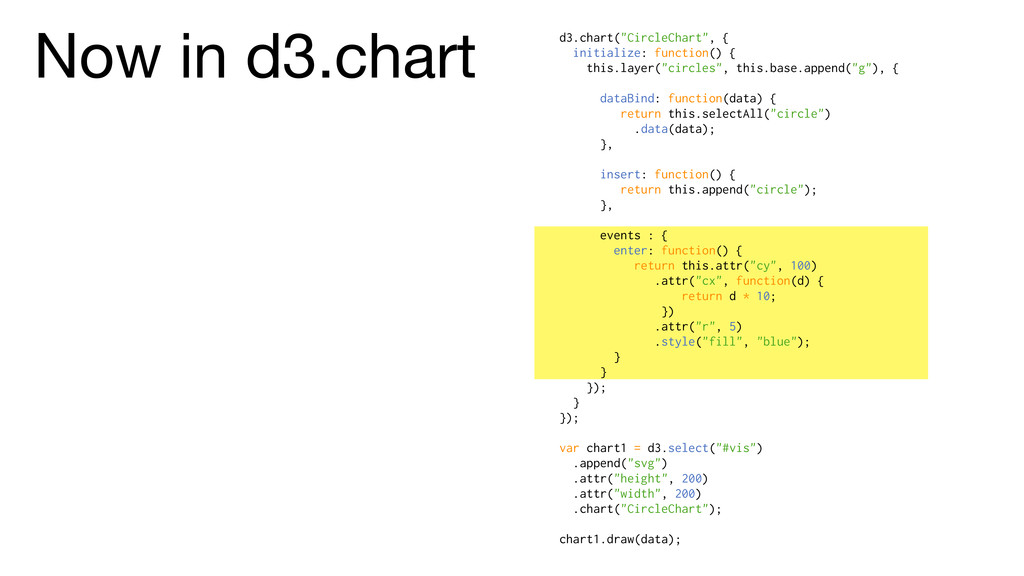
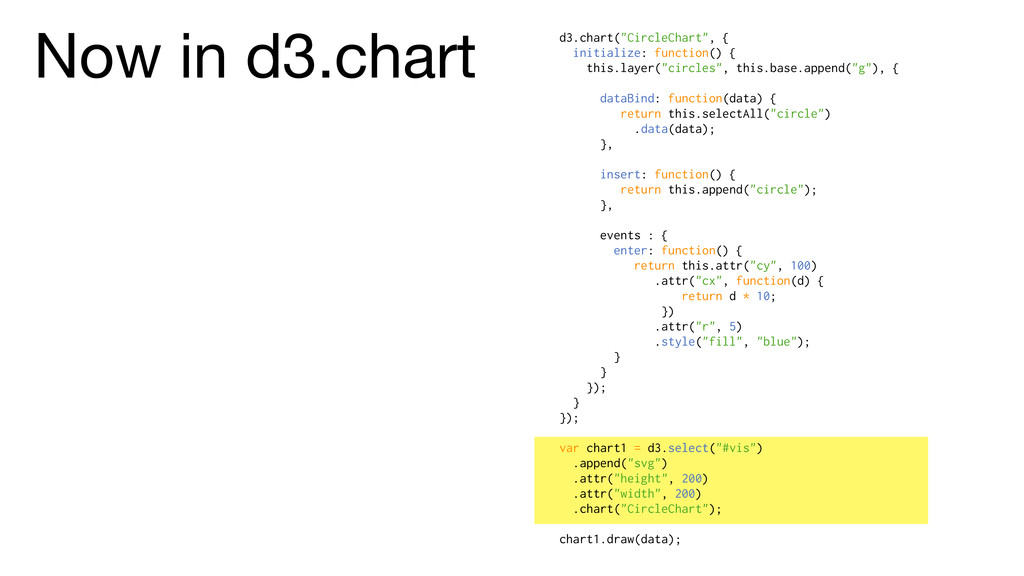
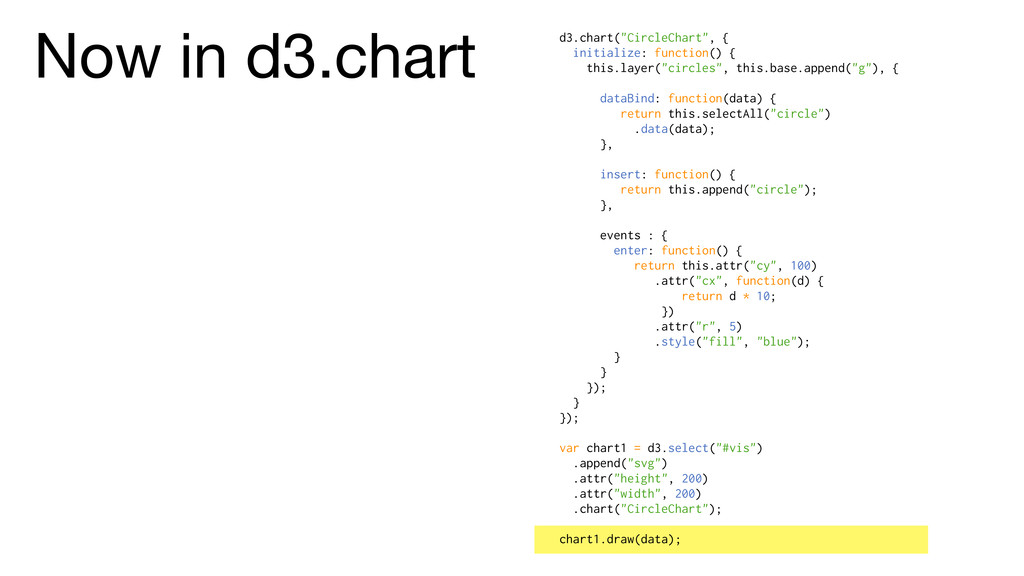
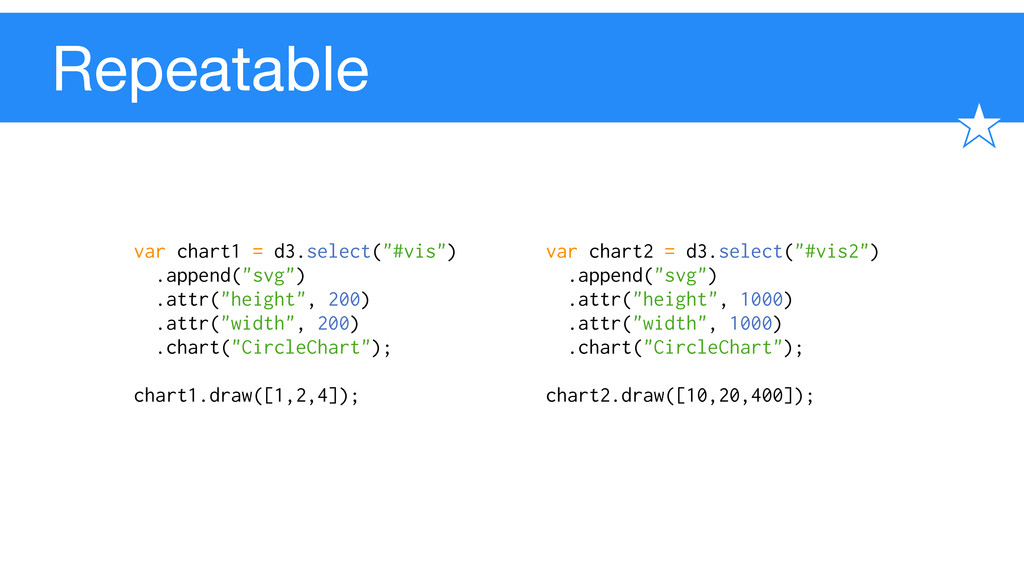
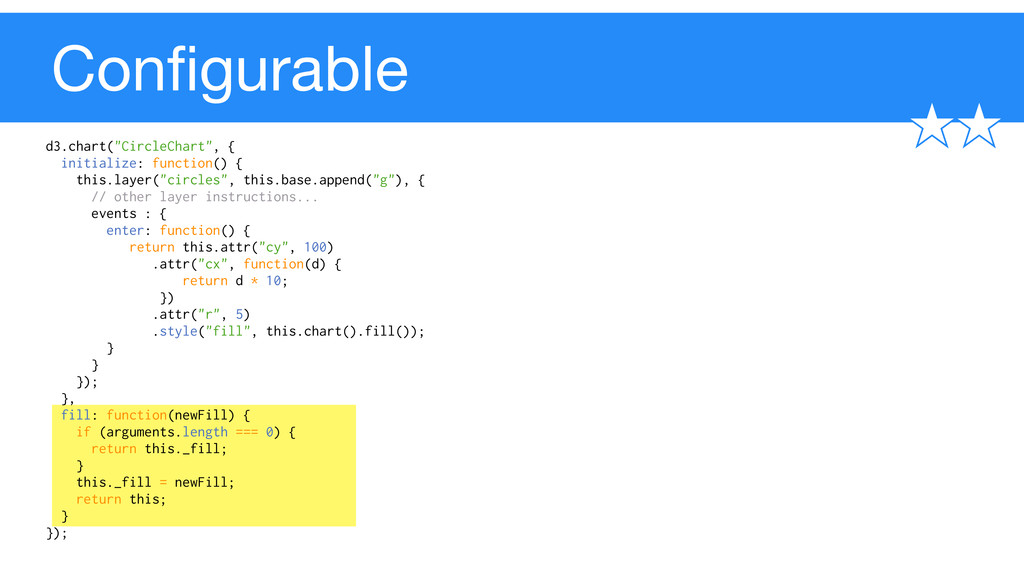
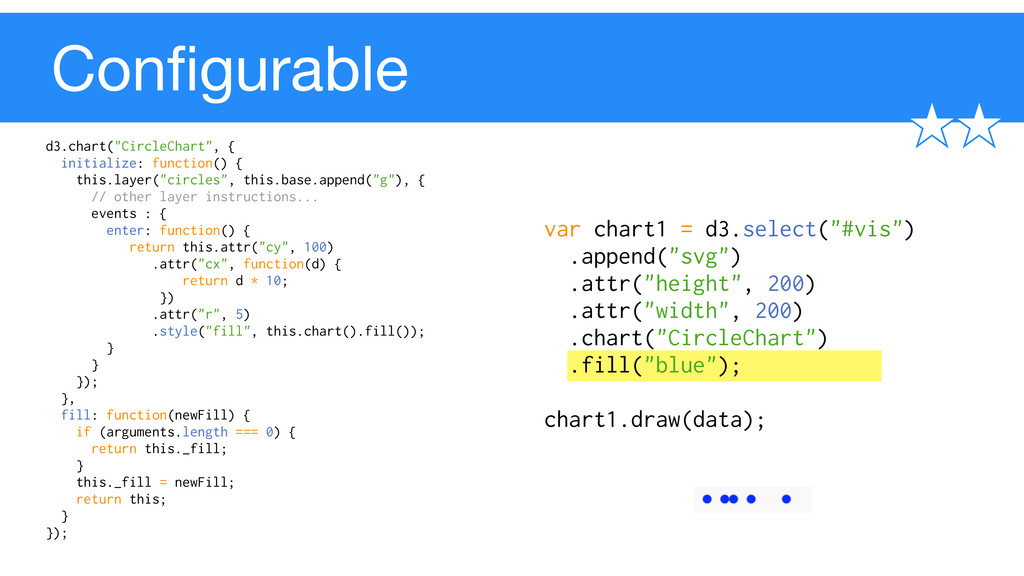
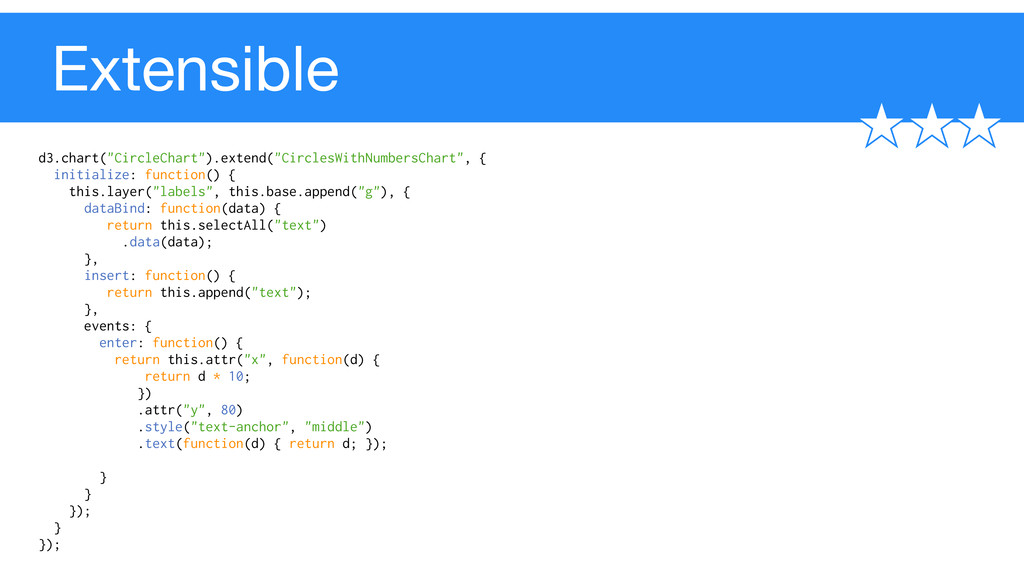
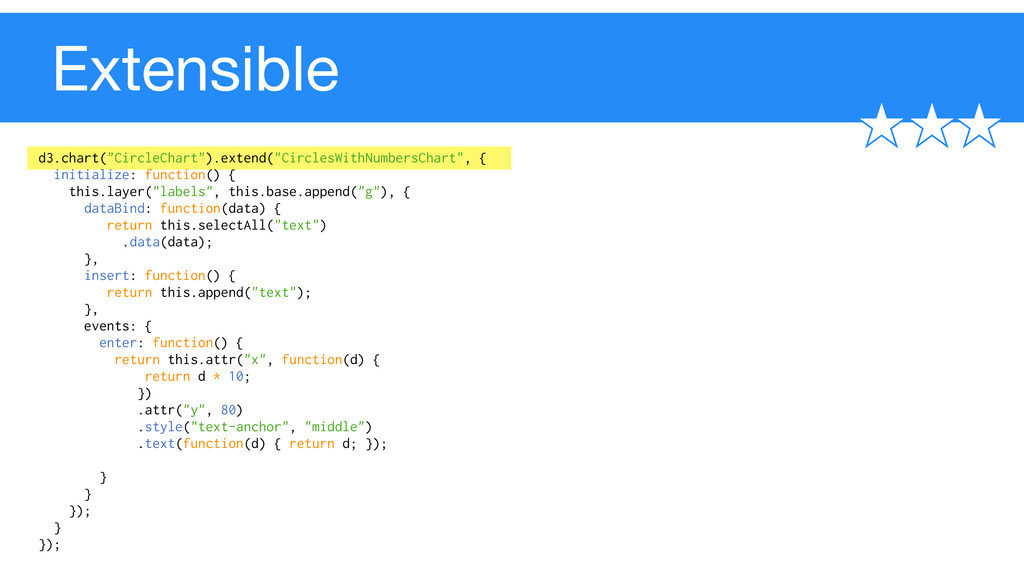
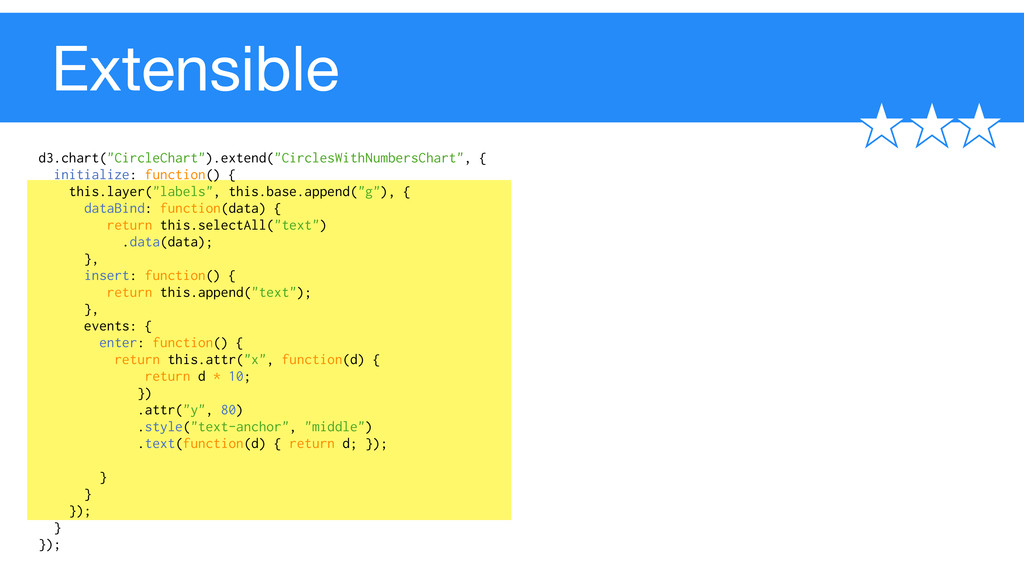
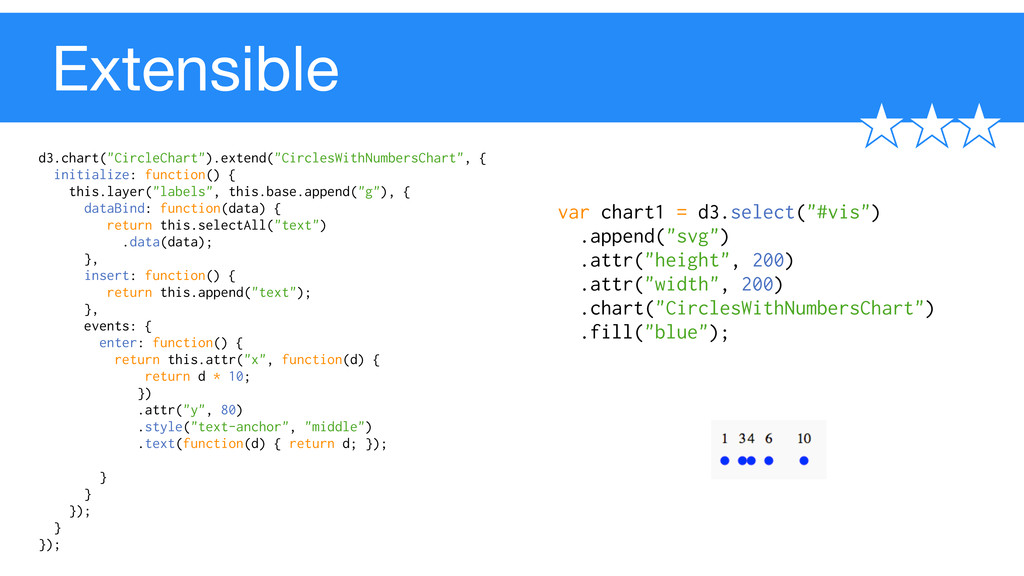
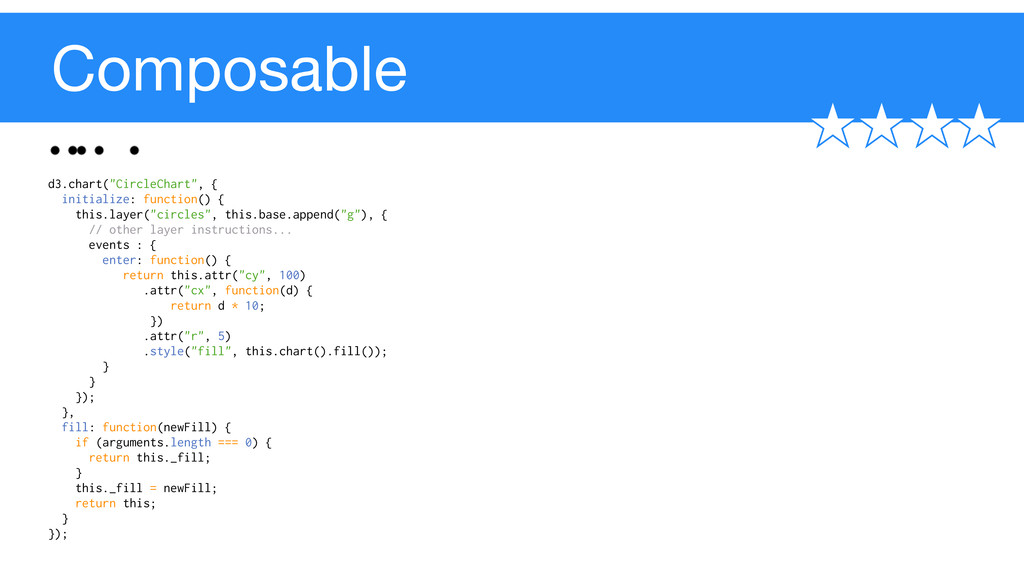
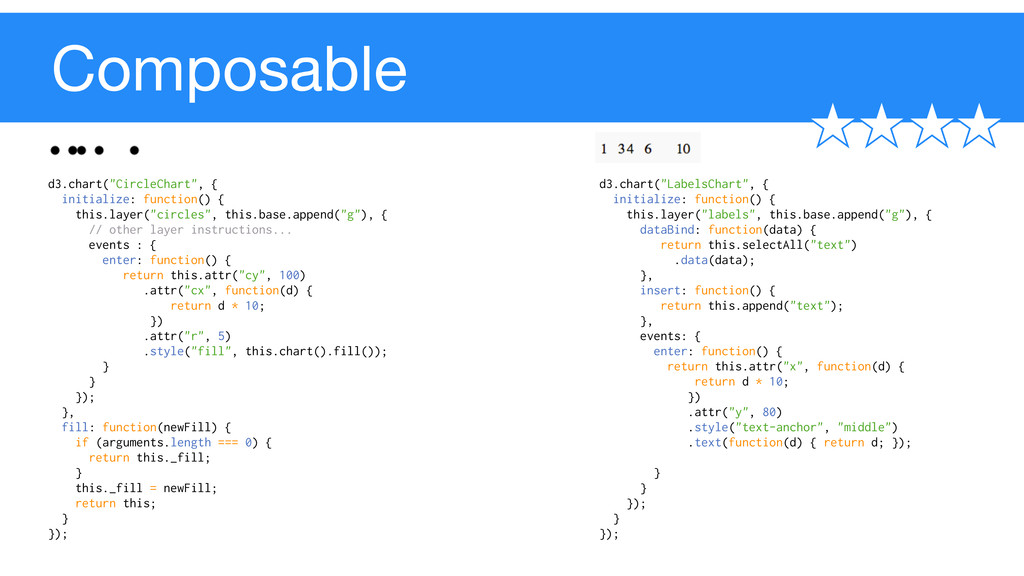
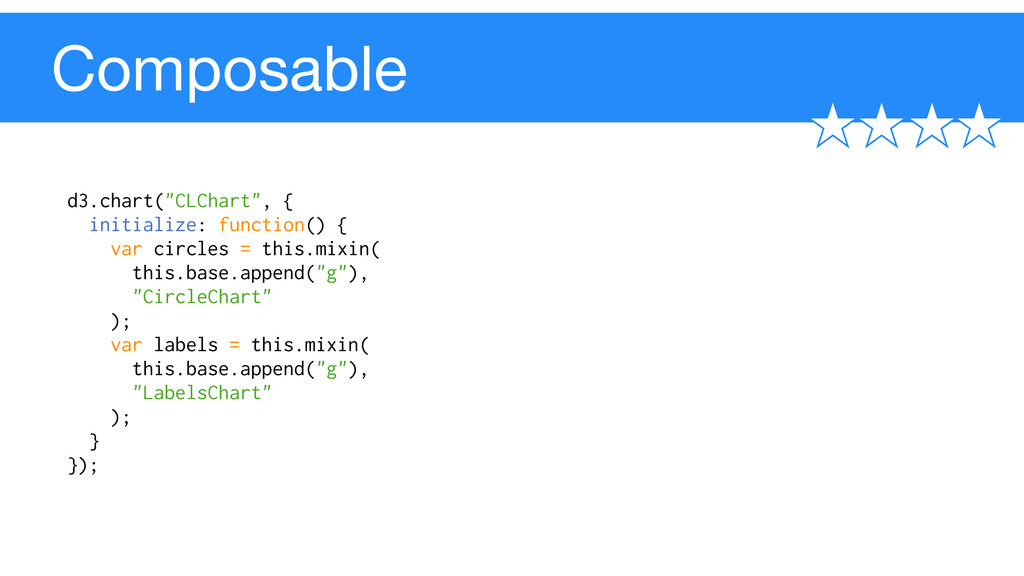
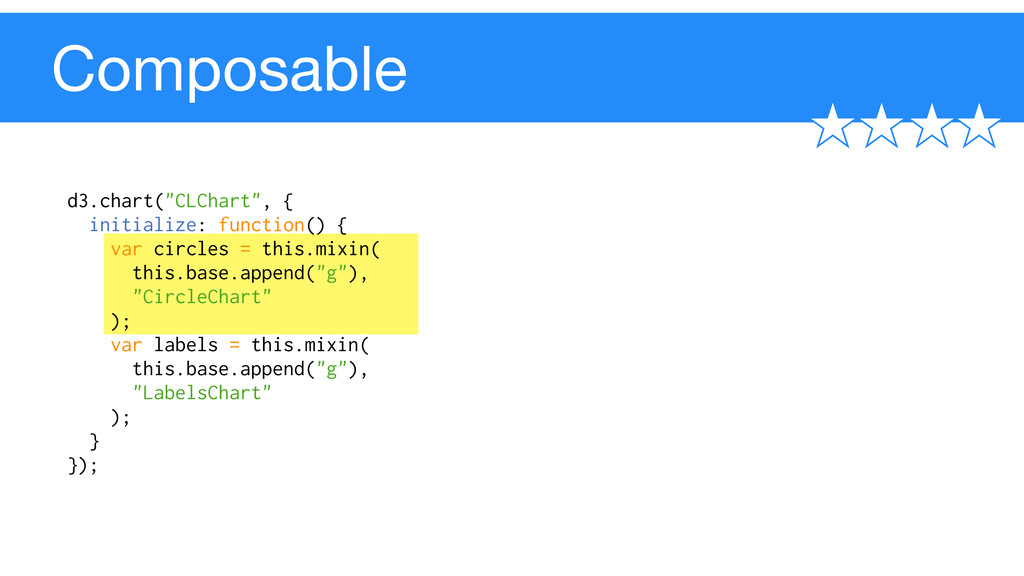
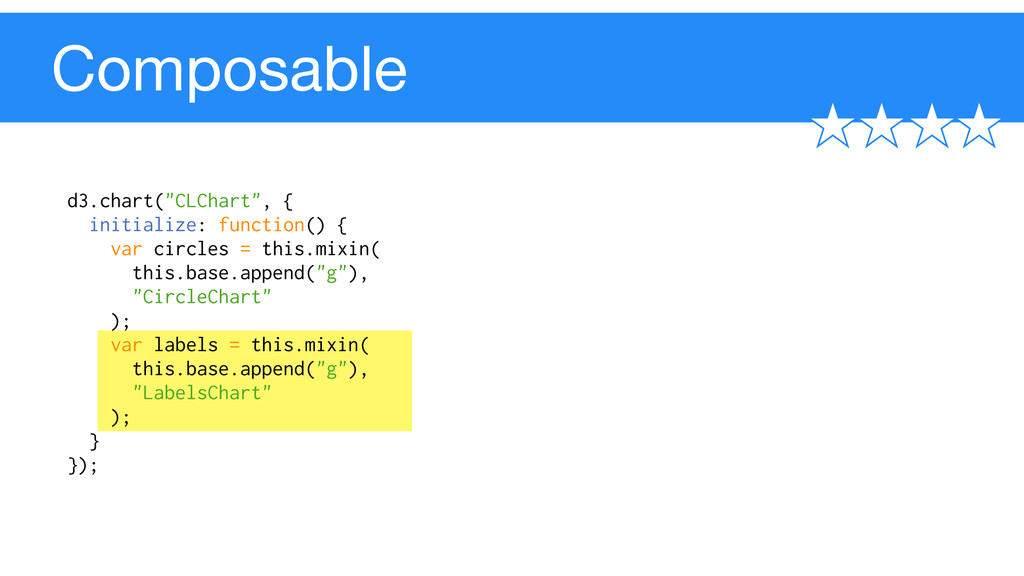
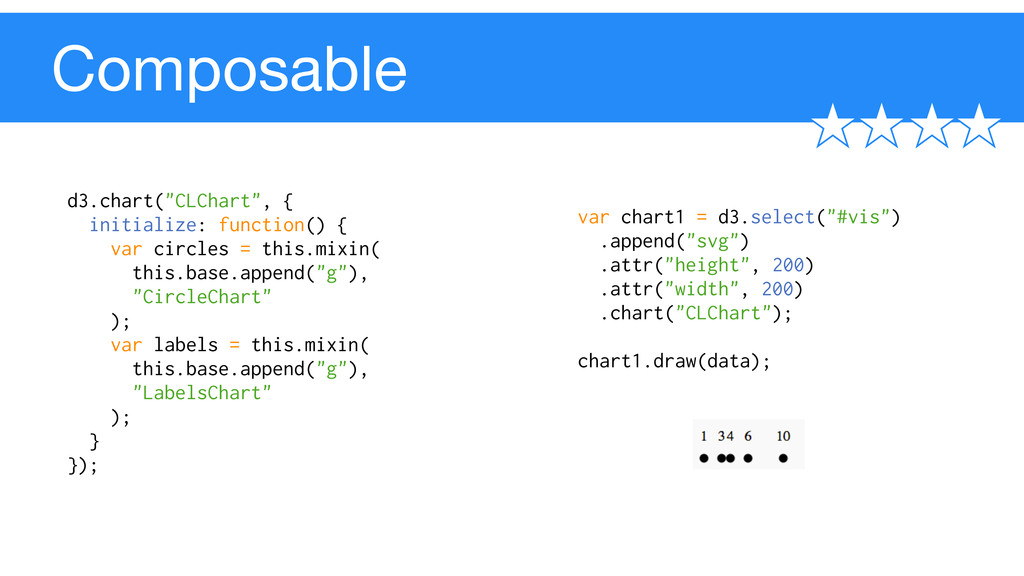
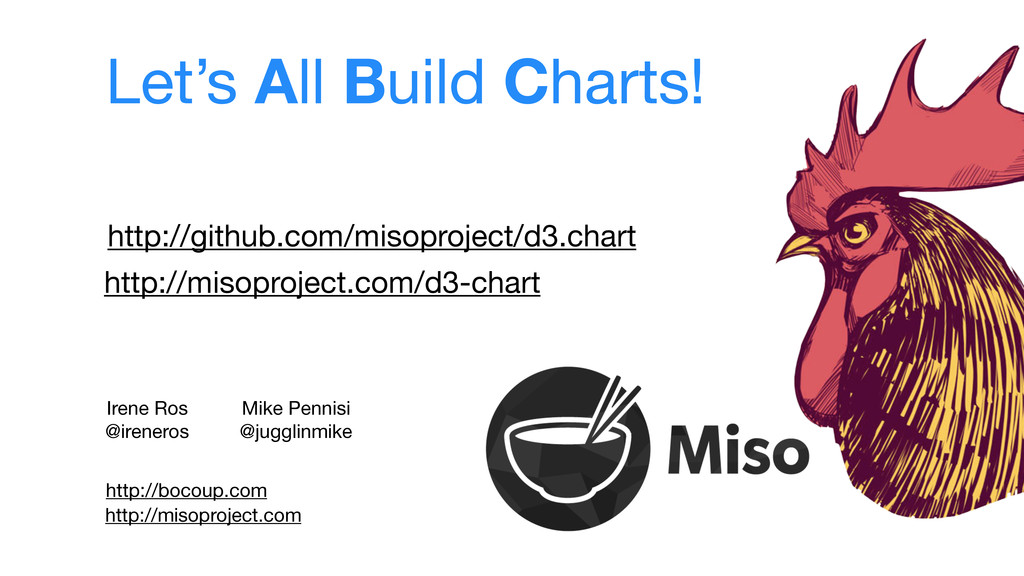
Announcing the Miso Project's latest library, d3.chart - a framework for building reusable charts with d3.js.
http://misoproject.com/d3-chart

Video: http://www.youtube.com/watch?feature=player_embedded&v=TYgSc_S0lCw&list=SP055Epbe6d5avZGXwE5u039VQq_oQFgrc

Irene Ros

May 29, 2013
Tweet

More Decks by Irene Ros

Other Decks in Technology

Transcript

  1. The ABC of Data Visualization Irene Ros @ireneros Mike Pennisi

    @jugglinmike http://bocoup.com http://misoproject.com
  2. The ABC of Data Visualization Irene Ros @ireneros Mike Pennisi

    @jugglinmike http://bocoup.com http://misoproject.com Architecting Better Charts
  3. Cleanup Transformation Analysis Visualization Is it good enough? Is the

    story right? Is the conclusion correct? Is it the right message? No
  4. Cleanup Transformation Analysis Visualization Is it good enough? Is the

    story right? Is the conclusion correct? Is it the right message? No Yes! Build it! On the web!
  5. Repeatable Easy to create multiple instances of What is a

    reusable chart? Difficulty level: BarChart Constructor
  6. Repeatable Easy to create multiple instances of What is a

    reusable chart? Difficulty level: BarChart Constructor
  7. Configurable Easy to appropriate for a specific task What is

    a reusable chart? Difficulty level: BarChart Constructor
  8. Configurable Easy to appropriate for a specific task What is

    a reusable chart? Difficulty level: BarChart Constructor
  9. Extensible Easy to extend with additional functionality What is a

    reusable chart? Difficulty level: BarChart Constructor
  10. Extensible Easy to extend with additional functionality What is a

    reusable chart? Difficulty level: BarChart Constructor 10 20 60 30
  11. Composable Easy to combine into other charts What is a

    reusable chart? Difficulty level:
  12. Composable Easy to combine into other charts What is a

    reusable chart? Difficulty level: BarChart Constructor
  13. Composable Easy to combine into other charts What is a

    reusable chart? Difficulty level: BarChart Constructor Axis Constructor +
  14. Composable Easy to combine into other charts What is a

    reusable chart? Difficulty level: BarChart Constructor Axis Constructor + Label Constructor 10 40 30 1 +
  15. Composable Easy to combine into other charts What is a

    reusable chart? Difficulty level: BarChart Constructor Axis Constructor + Label Constructor 10 40 30 1 + 10 20 60 30 =
  16. Unpacking d3: var data = [1,3,4,6,10]; var chart = d3.select("#vis")

    .append("svg") .attr("height", 200) .attr("width", 200); var circles = chart.append("g") .classed("circles", true) .selectAll("circle") .data(data) .enter() .append("circle") .attr("cy", 100) .attr("cx", function(d) { return d * 10; }) .attr("r", 5) .style("fill", "blue");
  17. Unpacking d3: var data = [1,3,4,6,10]; var chart = d3.select("#vis")

    .append("svg") .attr("height", 200) .attr("width", 200); var circles = chart.append("g") .classed("circles", true) .selectAll("circle") .data(data) .enter() .append("circle") .attr("cy", 100) .attr("cx", function(d) { return d * 10; }) .attr("r", 5) .style("fill", "blue");
  18. Unpacking d3: var data = [1,3,4,6,10]; var chart = d3.select("#vis")

    .append("svg") .attr("height", 200) .attr("width", 200); var circles = chart.append("g") .classed("circles", true) .selectAll("circle") .data(data) .enter() .append("circle") .attr("cy", 100) .attr("cx", function(d) { return d * 10; }) .attr("r", 5) .style("fill", "blue");
  19. Unpacking d3: var data = [1,3,4,6,10]; var chart = d3.select("#vis")

    .append("svg") .attr("height", 200) .attr("width", 200); var circles = chart.append("g") .classed("circles", true) .selectAll("circle") .data(data) .enter() .append("circle") .attr("cy", 100) .attr("cx", function(d) { return d * 10; }) .attr("r", 5) .style("fill", "blue");
  20. Unpacking d3: var data = [1,3,4,6,10]; var chart = d3.select("#vis")

    .append("svg") .attr("height", 200) .attr("width", 200); var circles = chart.append("g") .classed("circles", true) .selectAll("circle") .data(data) .enter() .append("circle") .attr("cy", 100) .attr("cx", function(d) { return d * 10; }) .attr("r", 5) .style("fill", "blue");
  21. Unpacking d3: var data = [1,3,4,6,10]; var chart = d3.select("#vis")

    .append("svg") .attr("height", 200) .attr("width", 200); var circles = chart.append("g") .classed("circles", true) .selectAll("circle") .data(data) .enter() .append("circle") .attr("cy", 100) .attr("cx", function(d) { return d * 10; }) .attr("r", 5) .style("fill", "blue");
  22. Unpacking d3: var data = [1,3,4,6,10]; var chart = d3.select("#vis")

    .append("svg") .attr("height", 200) .attr("width", 200); var circles = chart.append("g") .classed("circles", true) .selectAll("circle") .data(data) .enter() .append("circle") .attr("cy", 100) .attr("cx", function(d) { return d * 10; }) .attr("r", 5) .style("fill", "blue");
  23. Now in d3.chart d3.chart("CircleChart", { initialize: function() { this.layer("circles", this.base.append("g"),

    { dataBind: function(data) { return this.selectAll("circle") .data(data); }, insert: function() { return this.append("circle"); }, events : { enter: function() { return this.attr("cy", 100) .attr("cx", function(d) { return d * 10; }) .attr("r", 5) .style("fill", "blue"); } } }); } }); var chart1 = d3.select("#vis") .append("svg") .attr("height", 200) .attr("width", 200) .chart("CircleChart"); chart1.draw(data);
  24. Now in d3.chart d3.chart("CircleChart", { initialize: function() { this.layer("circles", this.base.append("g"),

    { dataBind: function(data) { return this.selectAll("circle") .data(data); }, insert: function() { return this.append("circle"); }, events : { enter: function() { return this.attr("cy", 100) .attr("cx", function(d) { return d * 10; }) .attr("r", 5) .style("fill", "blue"); } } }); } }); var chart1 = d3.select("#vis") .append("svg") .attr("height", 200) .attr("width", 200) .chart("CircleChart"); chart1.draw(data);
  25. Now in d3.chart d3.chart("CircleChart", { initialize: function() { this.layer("circles", this.base.append("g"),

    { dataBind: function(data) { return this.selectAll("circle") .data(data); }, insert: function() { return this.append("circle"); }, events : { enter: function() { return this.attr("cy", 100) .attr("cx", function(d) { return d * 10; }) .attr("r", 5) .style("fill", "blue"); } } }); } }); var chart1 = d3.select("#vis") .append("svg") .attr("height", 200) .attr("width", 200) .chart("CircleChart"); chart1.draw(data);
  26. Now in d3.chart d3.chart("CircleChart", { initialize: function() { this.layer("circles", this.base.append("g"),

    { dataBind: function(data) { return this.selectAll("circle") .data(data); }, insert: function() { return this.append("circle"); }, events : { enter: function() { return this.attr("cy", 100) .attr("cx", function(d) { return d * 10; }) .attr("r", 5) .style("fill", "blue"); } } }); } }); var chart1 = d3.select("#vis") .append("svg") .attr("height", 200) .attr("width", 200) .chart("CircleChart"); chart1.draw(data);
  27. Now in d3.chart d3.chart("CircleChart", { initialize: function() { this.layer("circles", this.base.append("g"),

    { dataBind: function(data) { return this.selectAll("circle") .data(data); }, insert: function() { return this.append("circle"); }, events : { enter: function() { return this.attr("cy", 100) .attr("cx", function(d) { return d * 10; }) .attr("r", 5) .style("fill", "blue"); } } }); } }); var chart1 = d3.select("#vis") .append("svg") .attr("height", 200) .attr("width", 200) .chart("CircleChart"); chart1.draw(data);
  28. Now in d3.chart d3.chart("CircleChart", { initialize: function() { this.layer("circles", this.base.append("g"),

    { dataBind: function(data) { return this.selectAll("circle") .data(data); }, insert: function() { return this.append("circle"); }, events : { enter: function() { return this.attr("cy", 100) .attr("cx", function(d) { return d * 10; }) .attr("r", 5) .style("fill", "blue"); } } }); } }); var chart1 = d3.select("#vis") .append("svg") .attr("height", 200) .attr("width", 200) .chart("CircleChart"); chart1.draw(data);
  29. Now in d3.chart d3.chart("CircleChart", { initialize: function() { this.layer("circles", this.base.append("g"),

    { dataBind: function(data) { return this.selectAll("circle") .data(data); }, insert: function() { return this.append("circle"); }, events : { enter: function() { return this.attr("cy", 100) .attr("cx", function(d) { return d * 10; }) .attr("r", 5) .style("fill", "blue"); } } }); } }); var chart1 = d3.select("#vis") .append("svg") .attr("height", 200) .attr("width", 200) .chart("CircleChart"); chart1.draw(data);
  30. Repeatable var chart2 = d3.select("#vis2") .append("svg") .attr("height", 1000) .attr("width", 1000)

    .chart("CircleChart"); chart2.draw([10,20,400]); var chart1 = d3.select("#vis") .append("svg") .attr("height", 200) .attr("width", 200) .chart("CircleChart"); chart1.draw([1,2,4]);
  31. Configurable Configurable d3.chart("CircleChart", { initialize: function() { this.layer("circles", this.base.append("g"), {

    // other layer instructions... events : { enter: function() { return this.attr("cy", 100) .attr("cx", function(d) { return d * 10; }) .attr("r", 5) .style("fill", this.chart().fill()); } } }); }, fill: function(newFill) { if (arguments.length === 0) { return this._fill; } this._fill = newFill; return this; } });
  32. Configurable Configurable d3.chart("CircleChart", { initialize: function() { this.layer("circles", this.base.append("g"), {

    // other layer instructions... events : { enter: function() { return this.attr("cy", 100) .attr("cx", function(d) { return d * 10; }) .attr("r", 5) .style("fill", this.chart().fill()); } } }); }, fill: function(newFill) { if (arguments.length === 0) { return this._fill; } this._fill = newFill; return this; } });
  33. Configurable Configurable d3.chart("CircleChart", { initialize: function() { this.layer("circles", this.base.append("g"), {

    // other layer instructions... events : { enter: function() { return this.attr("cy", 100) .attr("cx", function(d) { return d * 10; }) .attr("r", 5) .style("fill", this.chart().fill()); } } }); }, fill: function(newFill) { if (arguments.length === 0) { return this._fill; } this._fill = newFill; return this; } }); var chart1 = d3.select("#vis") .append("svg") .attr("height", 200) .attr("width", 200) .chart("CircleChart") .fill("blue"); chart1.draw(data);
  34. Configurable Extensible d3.chart("CircleChart").extend("CirclesWithNumbersChart", { initialize: function() { this.layer("labels", this.base.append("g"), {

    dataBind: function(data) { return this.selectAll("text") .data(data); }, insert: function() { return this.append("text"); }, events: { enter: function() { return this.attr("x", function(d) { return d * 10; }) .attr("y", 80) .style("text-anchor", "middle") .text(function(d) { return d; }); } } }); } });
  35. Extensible d3.chart("CircleChart").extend("CirclesWithNumbersChart", { initialize: function() { this.layer("labels", this.base.append("g"), { dataBind:

    function(data) { return this.selectAll("text") .data(data); }, insert: function() { return this.append("text"); }, events: { enter: function() { return this.attr("x", function(d) { return d * 10; }) .attr("y", 80) .style("text-anchor", "middle") .text(function(d) { return d; }); } } }); } });
  36. Extensible d3.chart("CircleChart").extend("CirclesWithNumbersChart", { initialize: function() { this.layer("labels", this.base.append("g"), { dataBind:

    function(data) { return this.selectAll("text") .data(data); }, insert: function() { return this.append("text"); }, events: { enter: function() { return this.attr("x", function(d) { return d * 10; }) .attr("y", 80) .style("text-anchor", "middle") .text(function(d) { return d; }); } } }); } });
  37. Extensible d3.chart("CircleChart").extend("CirclesWithNumbersChart", { initialize: function() { this.layer("labels", this.base.append("g"), { dataBind:

    function(data) { return this.selectAll("text") .data(data); }, insert: function() { return this.append("text"); }, events: { enter: function() { return this.attr("x", function(d) { return d * 10; }) .attr("y", 80) .style("text-anchor", "middle") .text(function(d) { return d; }); } } }); } }); var chart1 = d3.select("#vis") .append("svg") .attr("height", 200) .attr("width", 200) .chart("CirclesWithNumbersChart") .fill("blue");
  38. Composable d3.chart("CircleChart", { initialize: function() { this.layer("circles", this.base.append("g"), { //

    other layer instructions... events : { enter: function() { return this.attr("cy", 100) .attr("cx", function(d) { return d * 10; }) .attr("r", 5) .style("fill", this.chart().fill()); } } }); }, fill: function(newFill) { if (arguments.length === 0) { return this._fill; } this._fill = newFill; return this; } });
  39. Composable d3.chart("LabelsChart", { initialize: function() { this.layer("labels", this.base.append("g"), { dataBind:

    function(data) { return this.selectAll("text") .data(data); }, insert: function() { return this.append("text"); }, events: { enter: function() { return this.attr("x", function(d) { return d * 10; }) .attr("y", 80) .style("text-anchor", "middle") .text(function(d) { return d; }); } } }); } }); d3.chart("CircleChart", { initialize: function() { this.layer("circles", this.base.append("g"), { // other layer instructions... events : { enter: function() { return this.attr("cy", 100) .attr("cx", function(d) { return d * 10; }) .attr("r", 5) .style("fill", this.chart().fill()); } } }); }, fill: function(newFill) { if (arguments.length === 0) { return this._fill; } this._fill = newFill; return this; } });
  40. Composable d3.chart("CLChart", { initialize: function() { var circles = this.mixin(

    this.base.append("g"), "CircleChart" ); var labels = this.mixin( this.base.append("g"), "LabelsChart" ); } });
  41. Composable d3.chart("CLChart", { initialize: function() { var circles = this.mixin(

    this.base.append("g"), "CircleChart" ); var labels = this.mixin( this.base.append("g"), "LabelsChart" ); } });
  42. Composable d3.chart("CLChart", { initialize: function() { var circles = this.mixin(

    this.base.append("g"), "CircleChart" ); var labels = this.mixin( this.base.append("g"), "LabelsChart" ); } });
  43. Composable d3.chart("CLChart", { initialize: function() { var circles = this.mixin(

    this.base.append("g"), "CircleChart" ); var labels = this.mixin( this.base.append("g"), "LabelsChart" ); } }); var chart1 = d3.select("#vis") .append("svg") .attr("height", 200) .attr("width", 200) .chart("CLChart"); chart1.draw(data);