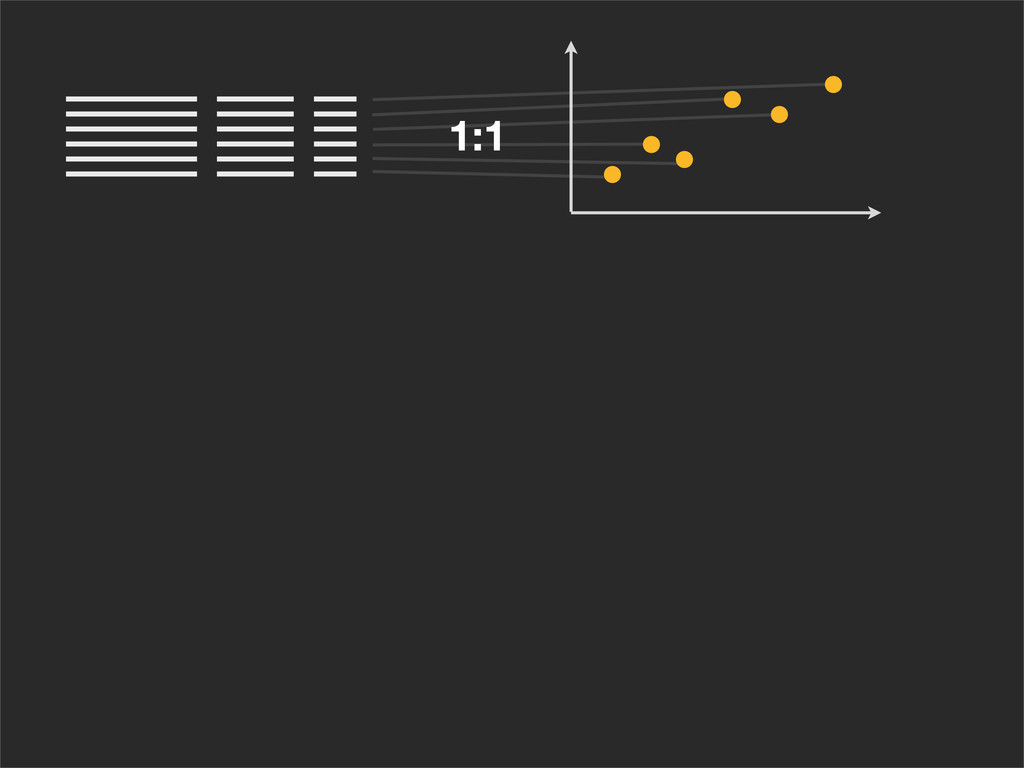
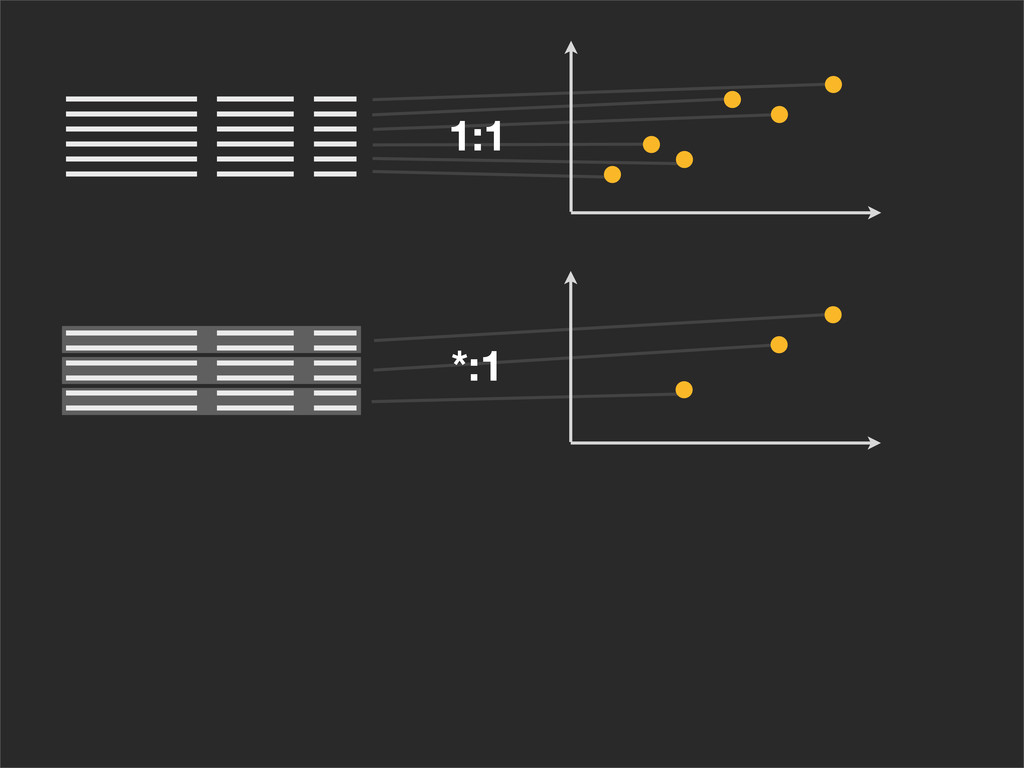
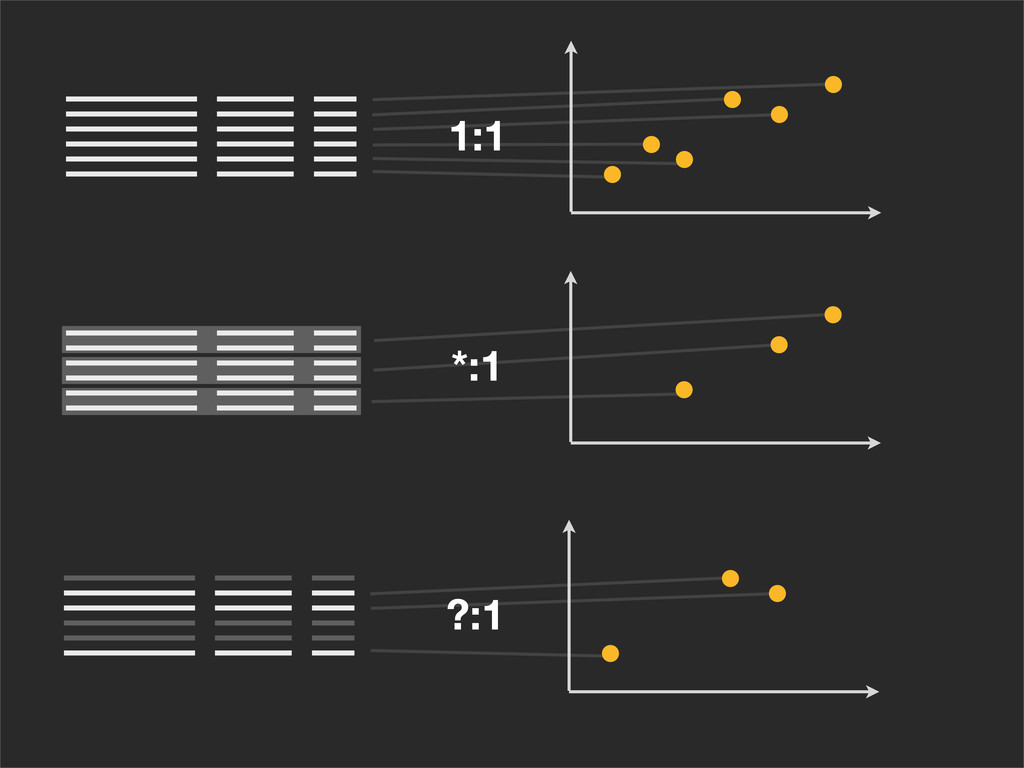
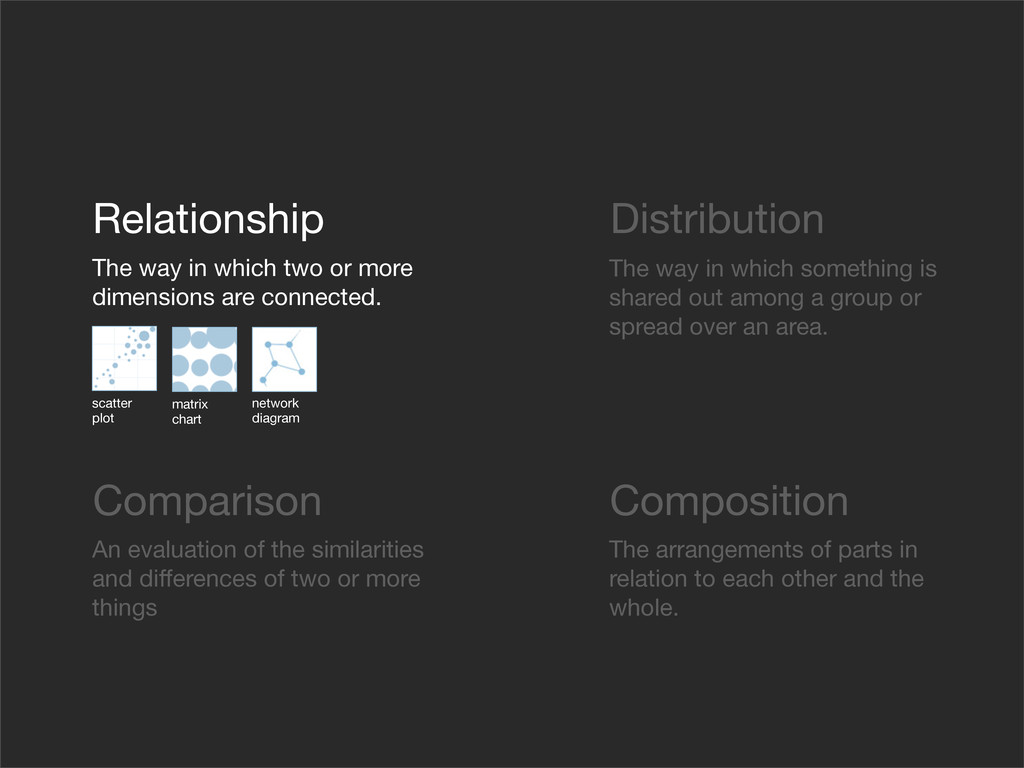
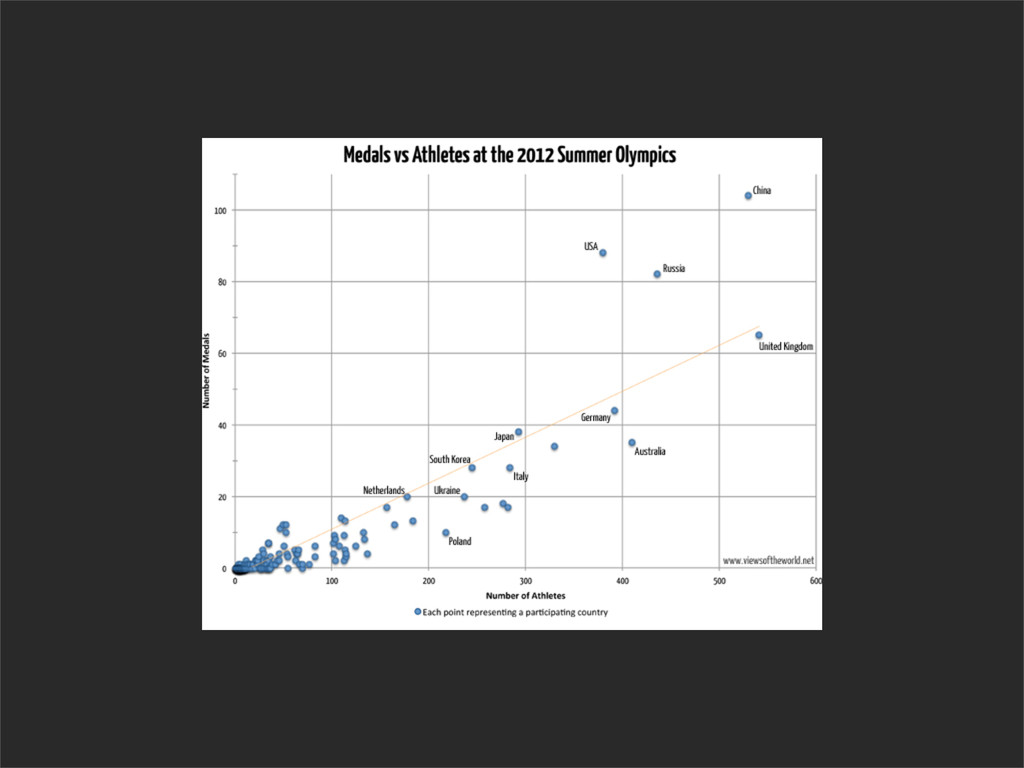
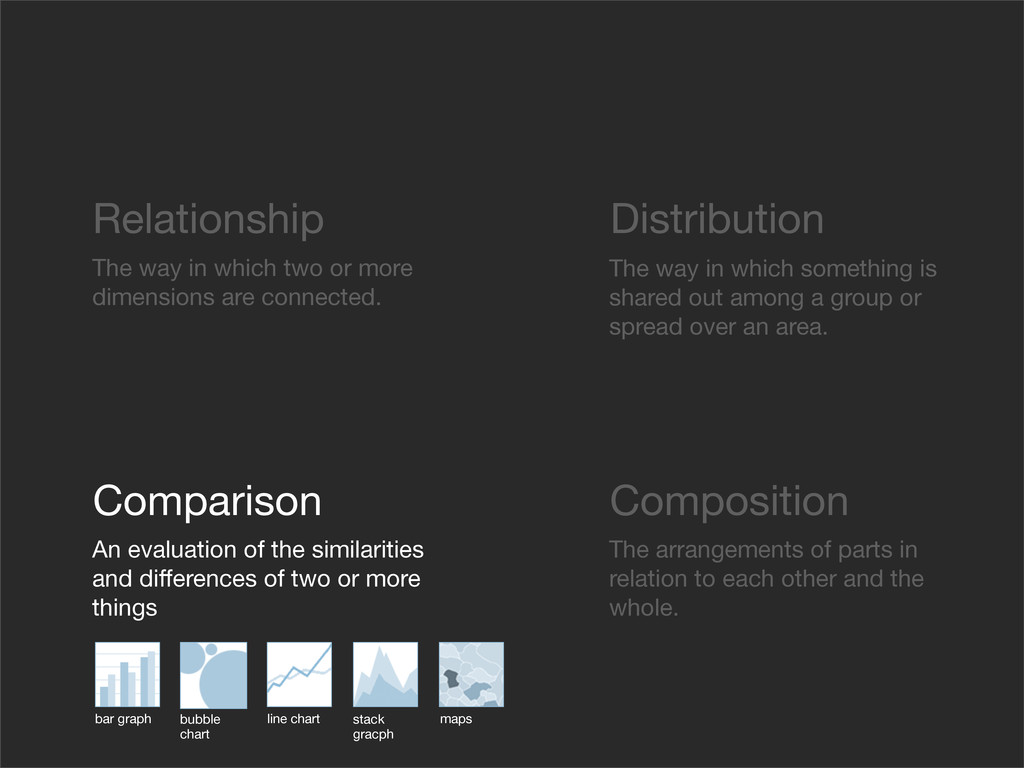
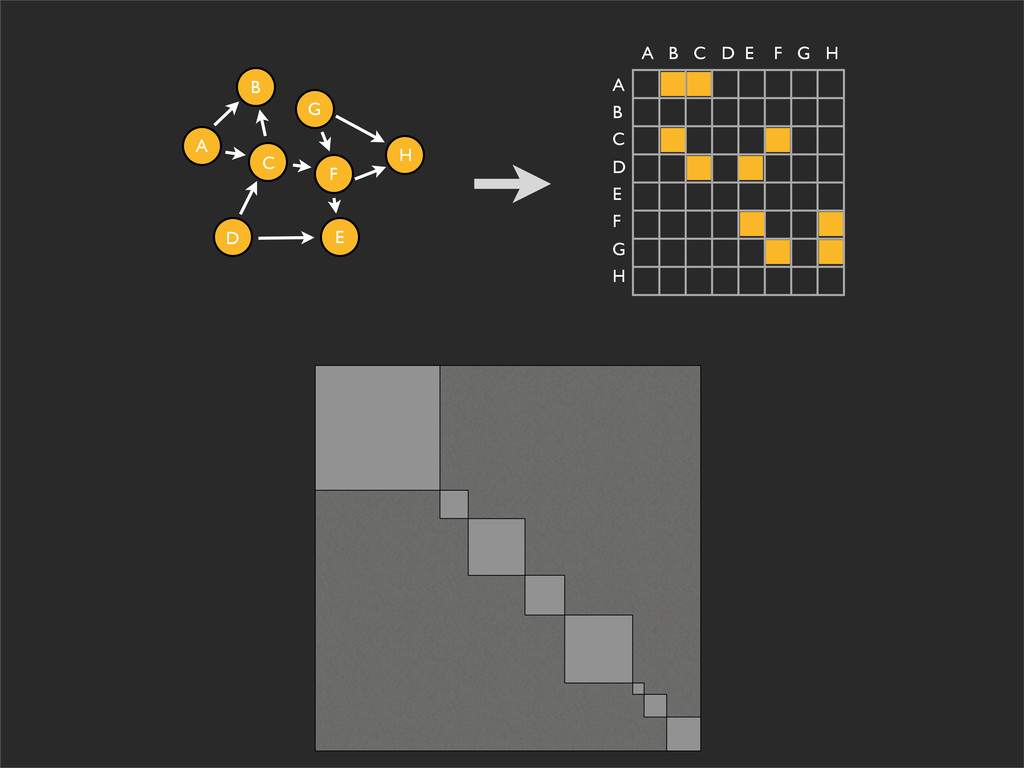
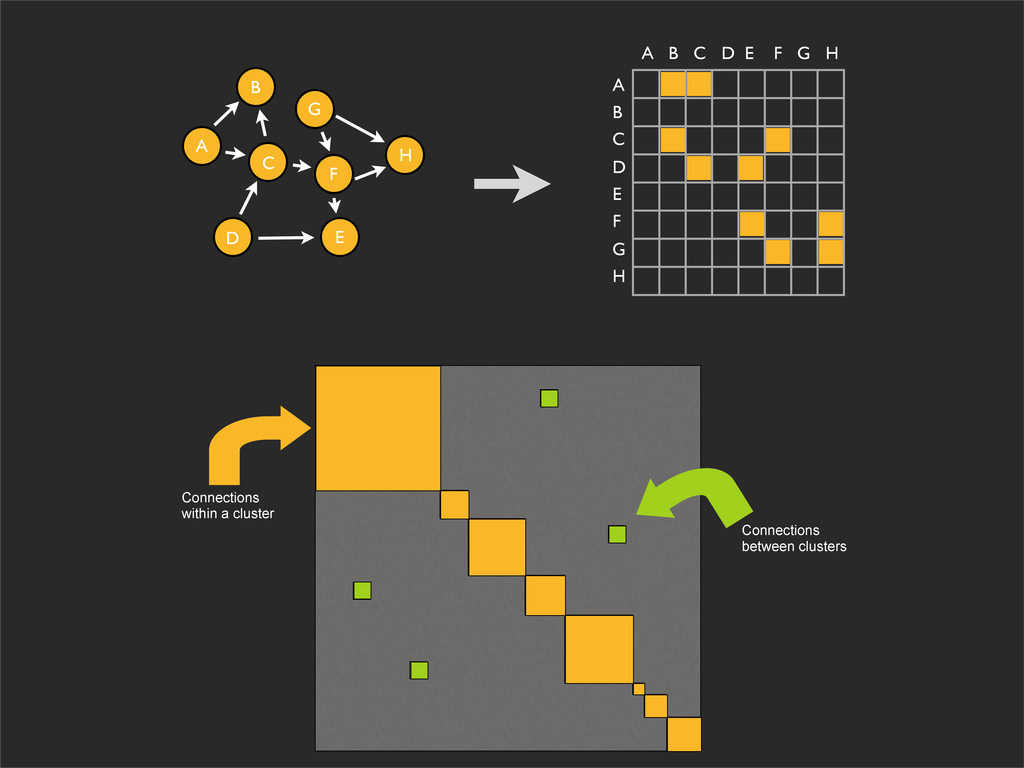
more dimensions are connected. The way in which something is shared out among a group or spread over an area. An evaluation of the similarities and differences of two or more things The arrangements of parts in relation to each other and the whole. scatter plot matrix chart network diagram
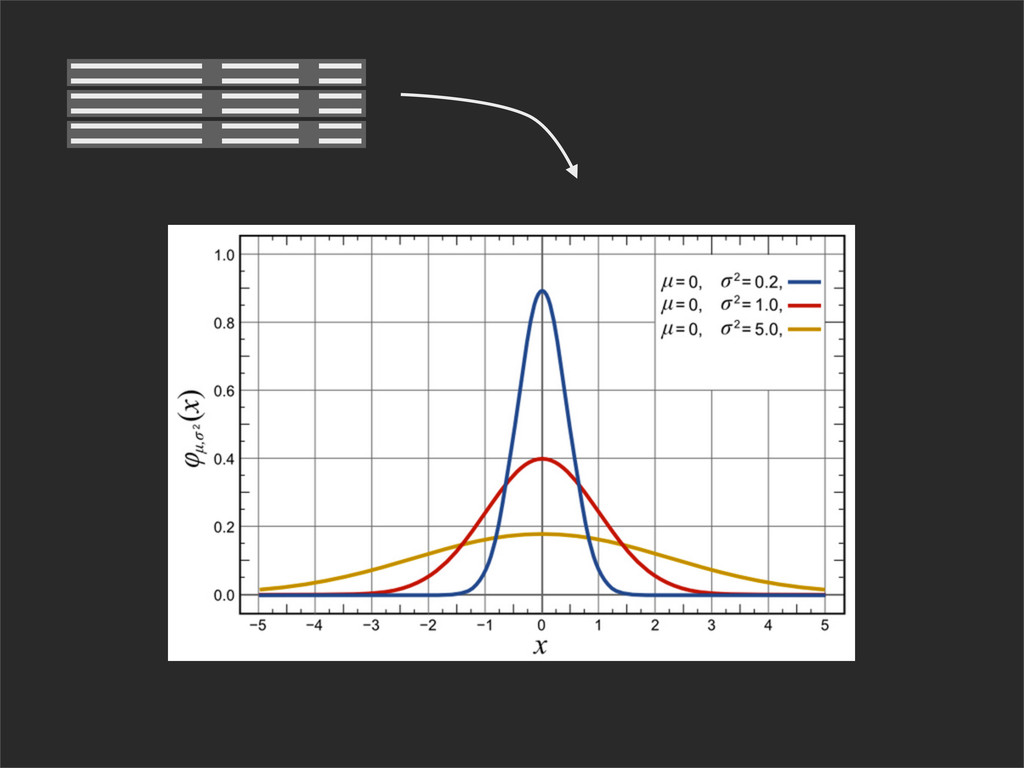
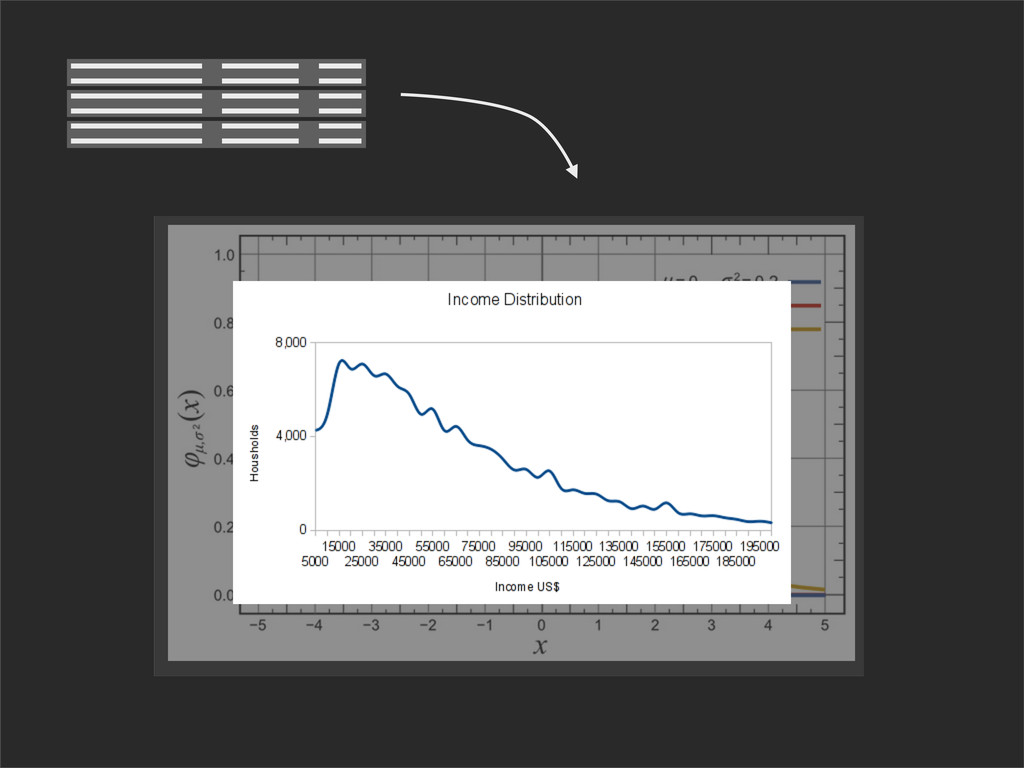
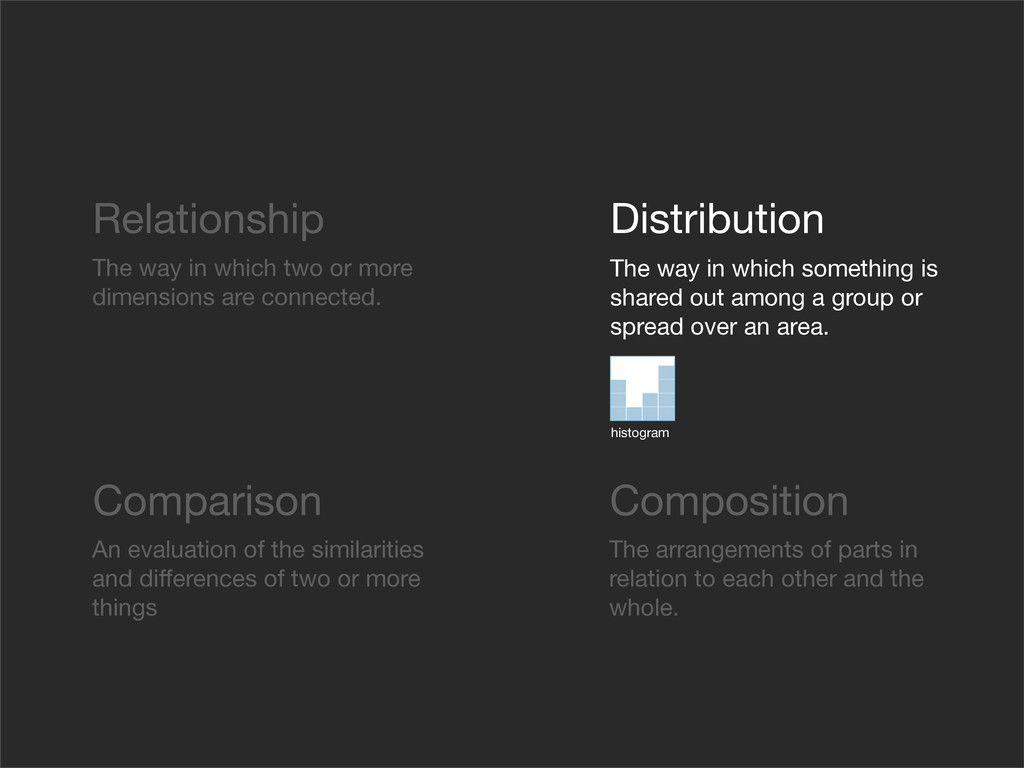
more dimensions are connected. The way in which something is shared out among a group or spread over an area. An evaluation of the similarities and differences of two or more things The arrangements of parts in relation to each other and the whole. histogram
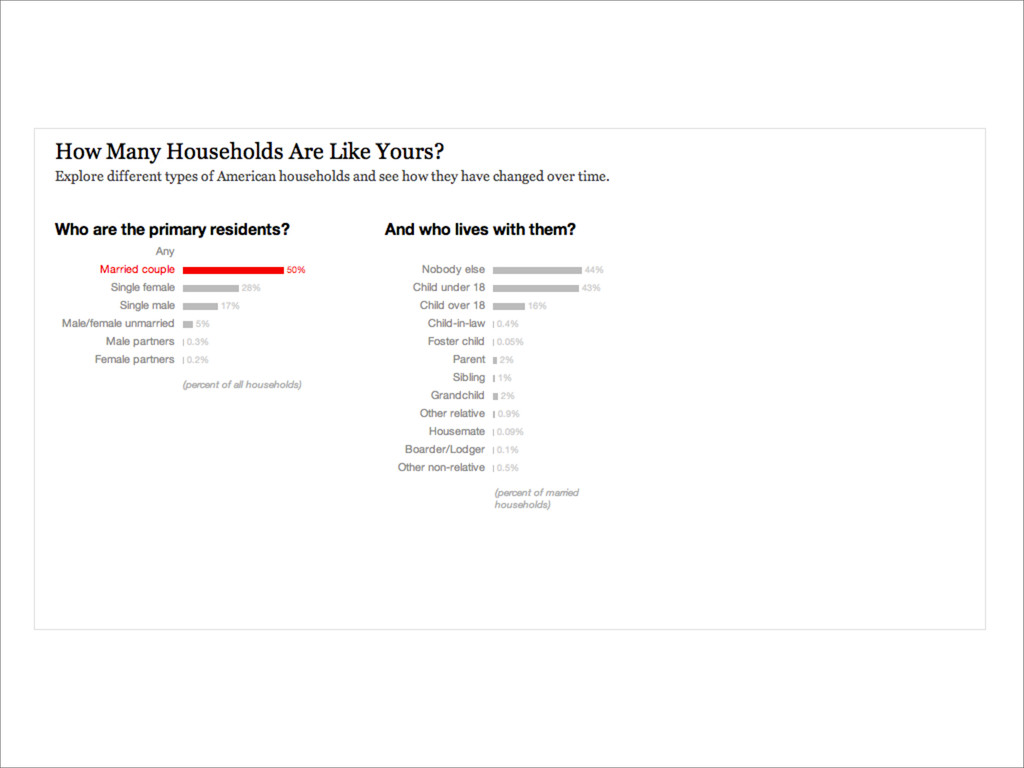
more dimensions are connected. The way in which something is shared out among a group or spread over an area. An evaluation of the similarities and differences of two or more things The arrangements of parts in relation to each other and the whole. bar graph line chart stack gracph maps bubble chart
more dimensions are connected. The way in which something is shared out among a group or spread over an area. An evaluation of the similarities and differences of two or more things The arrangements of parts in relation to each other and the whole. pie chart treemap