$30 off During Our Annual Pro Sale. View Details »

Visualizing the Health of the Internet with Measurement Lab

Visualizing the Health of the Internet with Measurement Lab

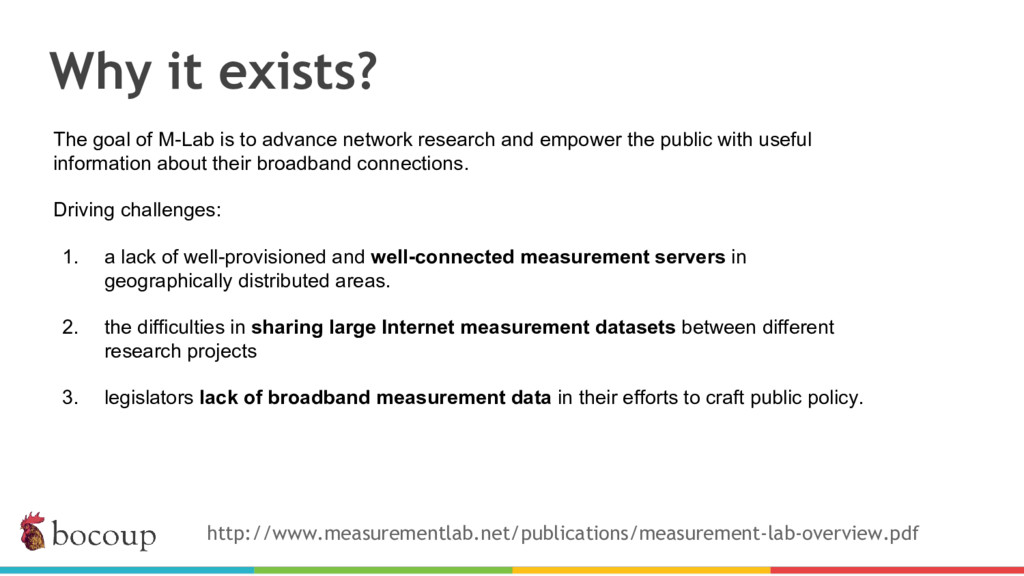
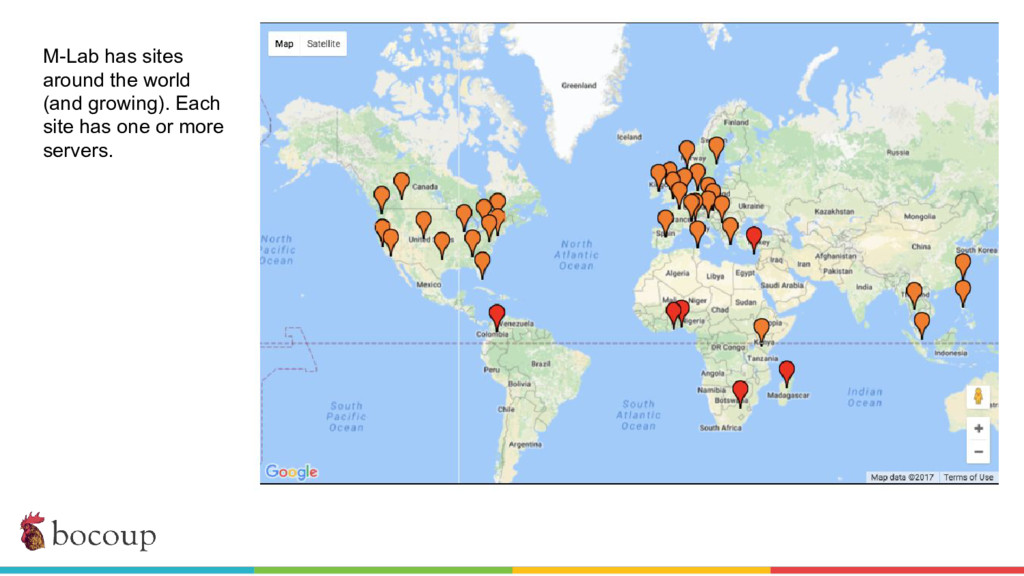
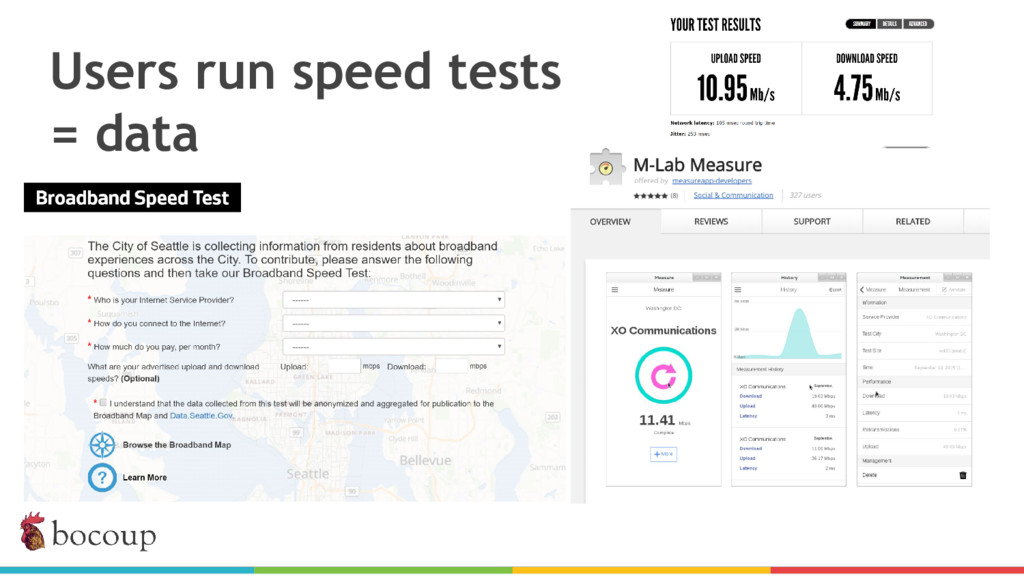
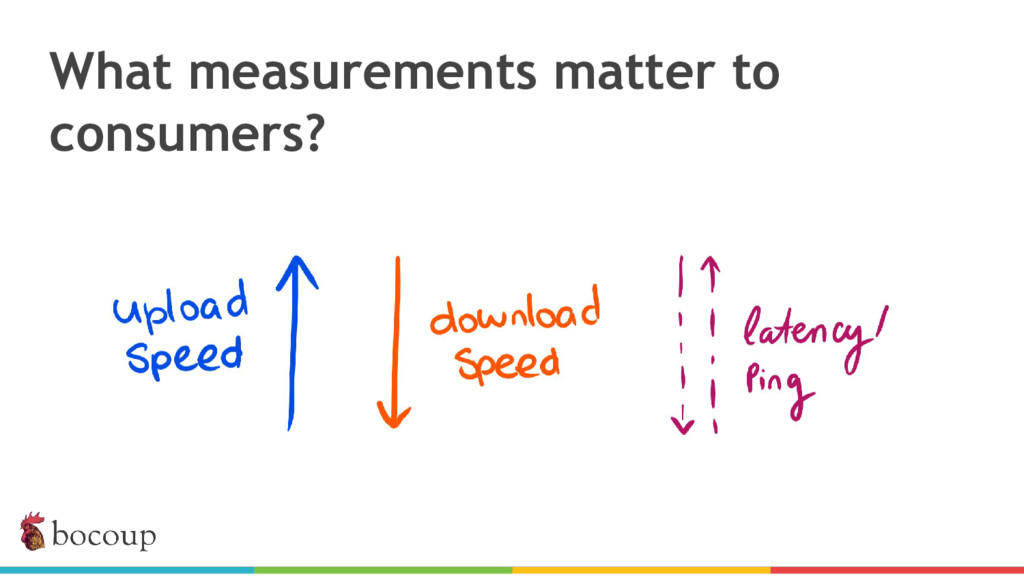
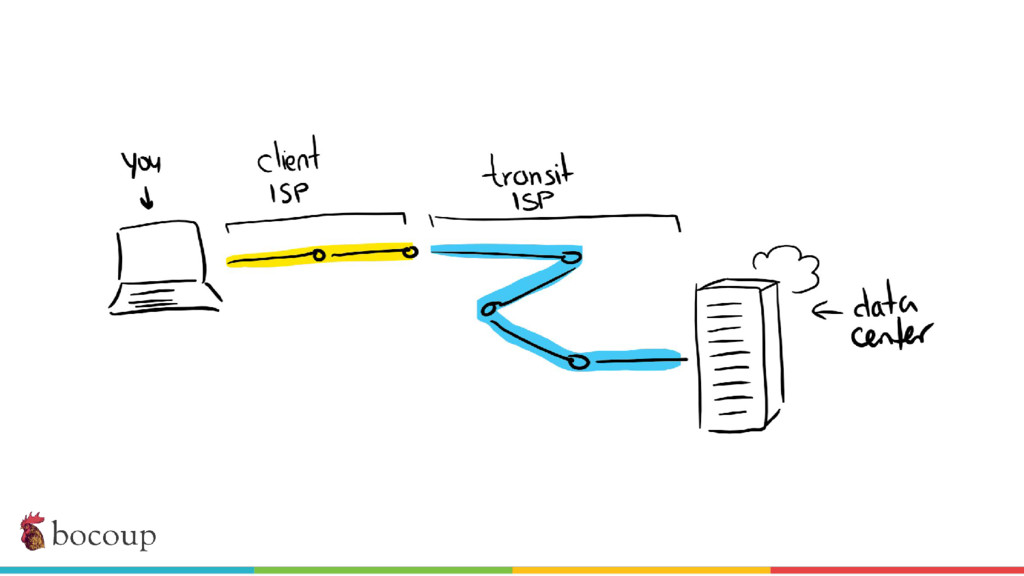
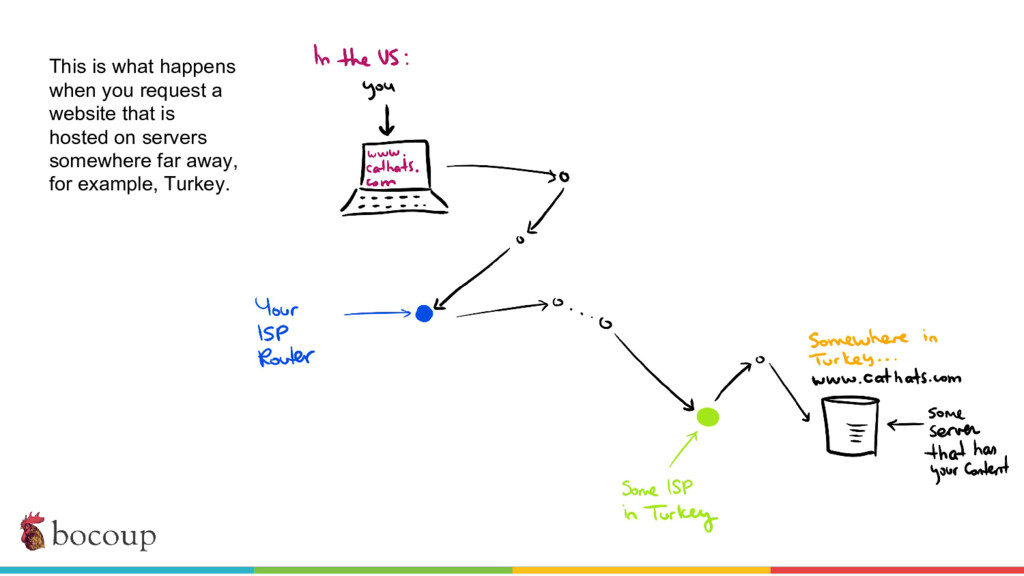
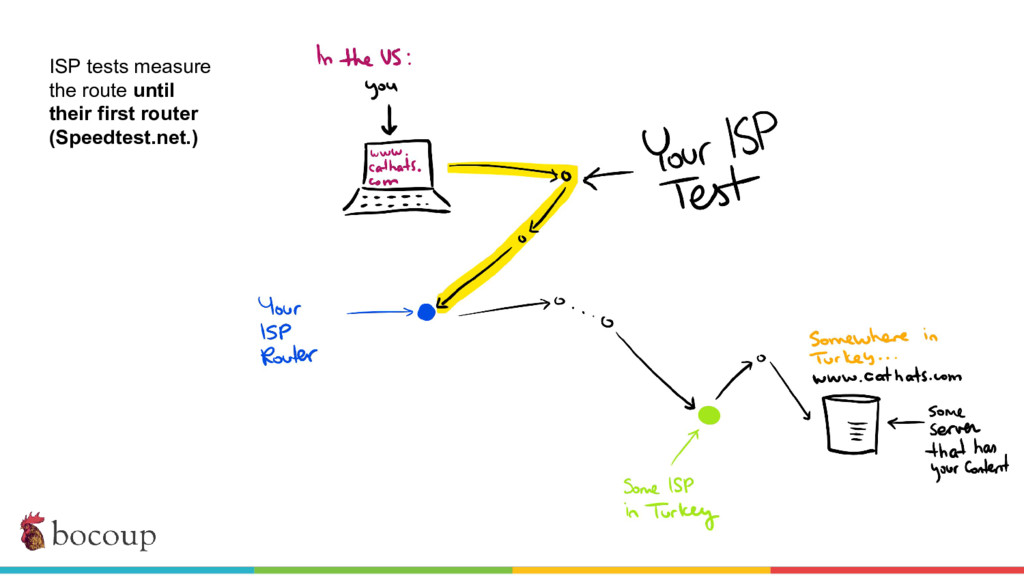
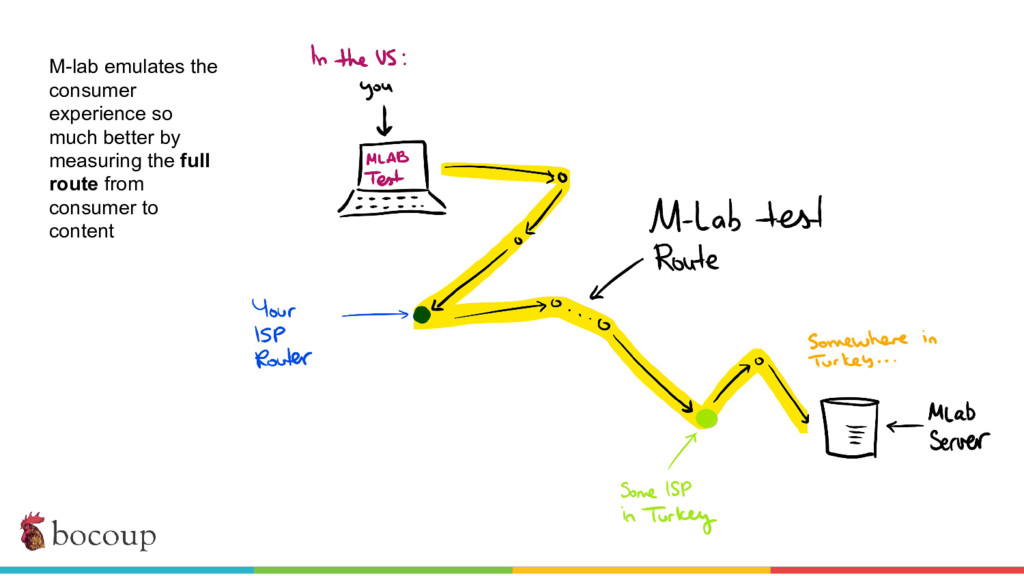
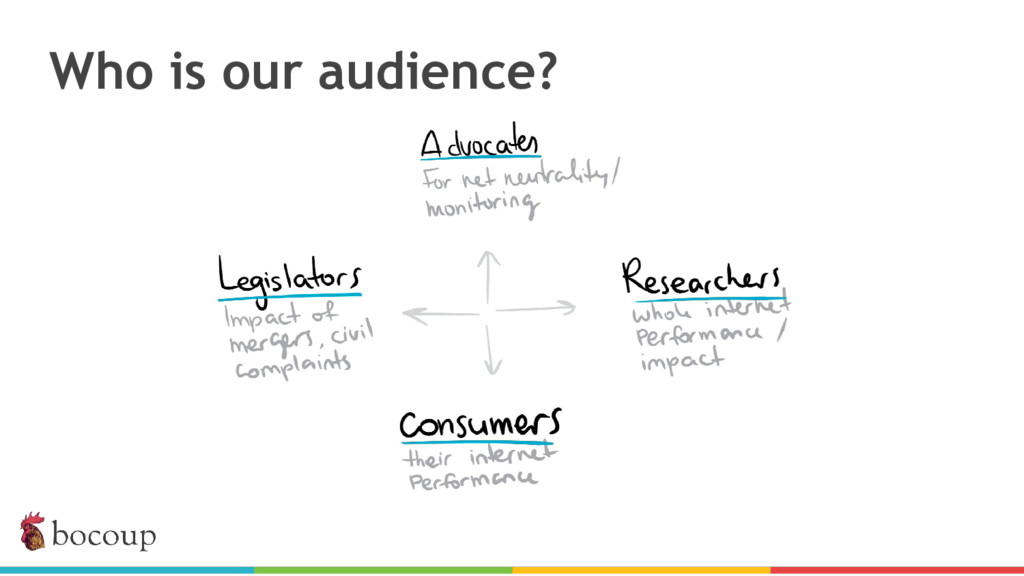
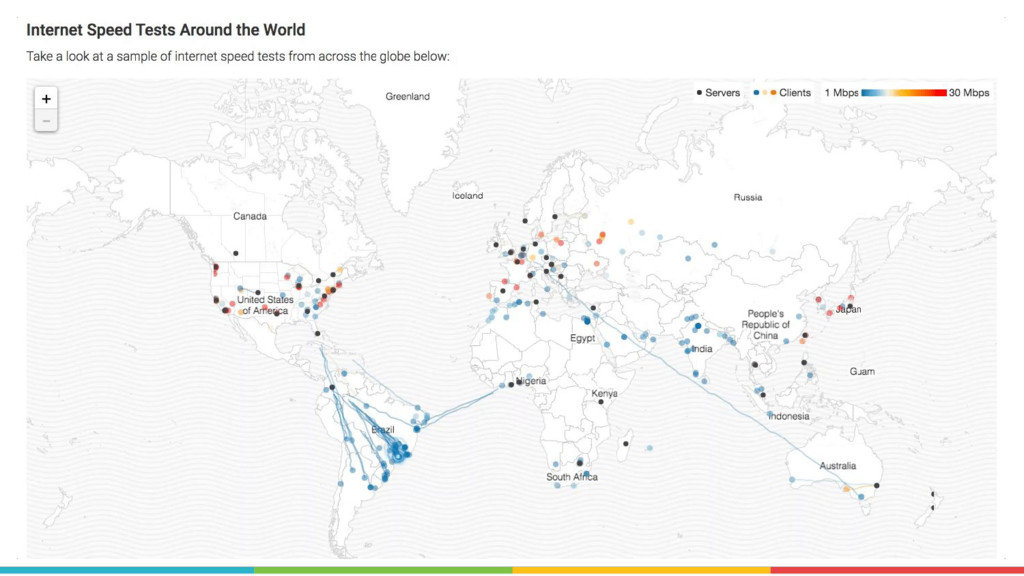
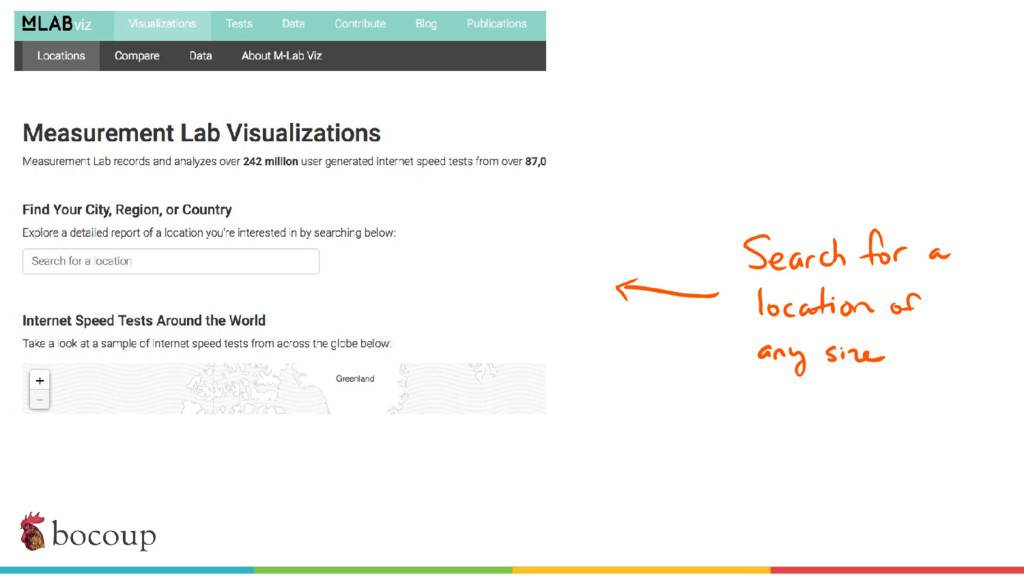
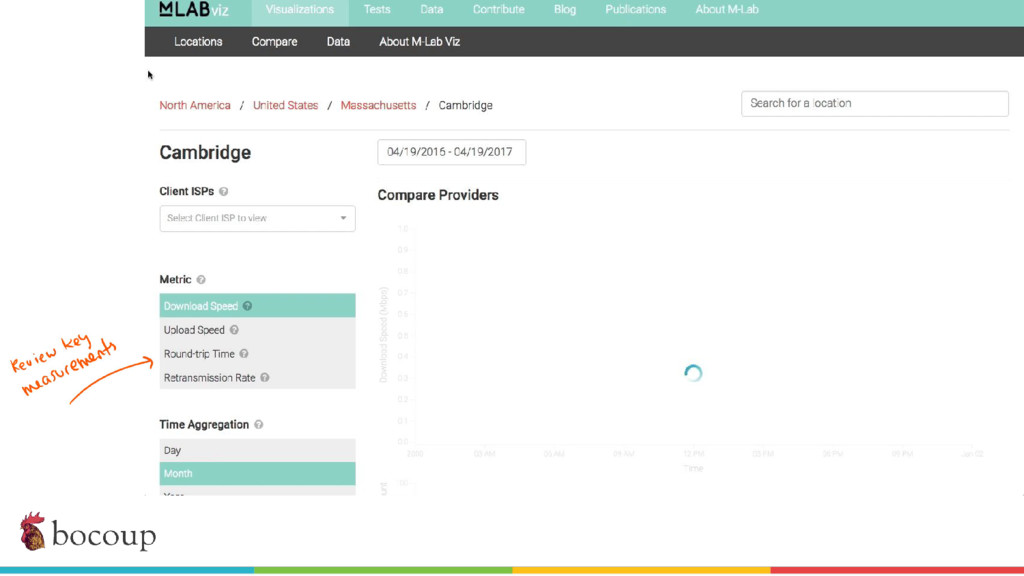
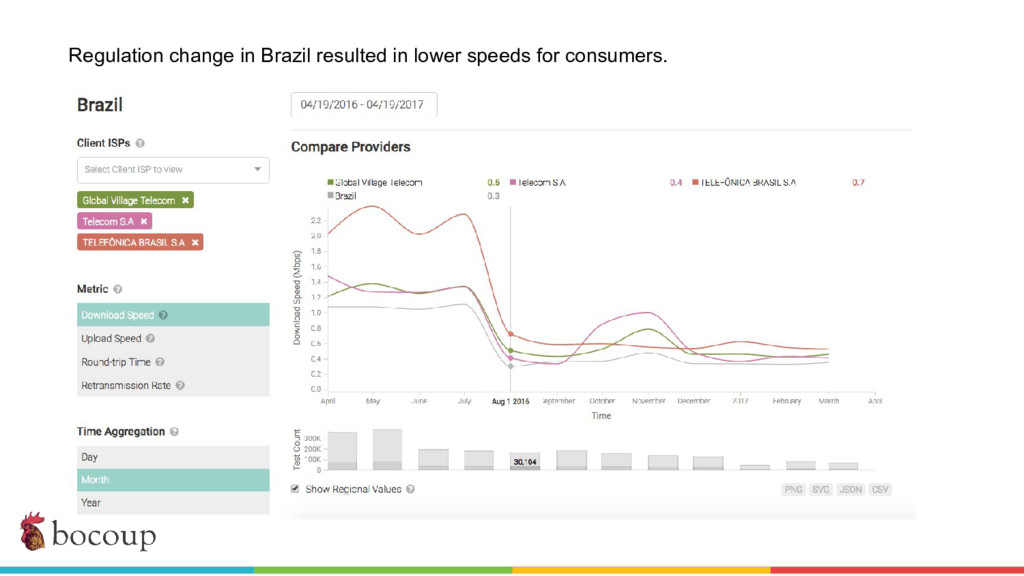
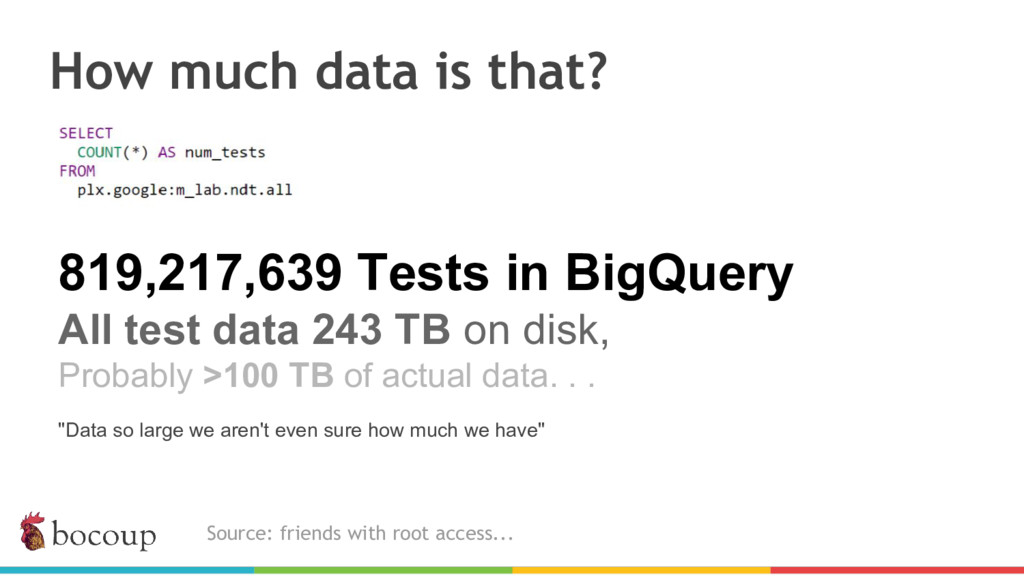
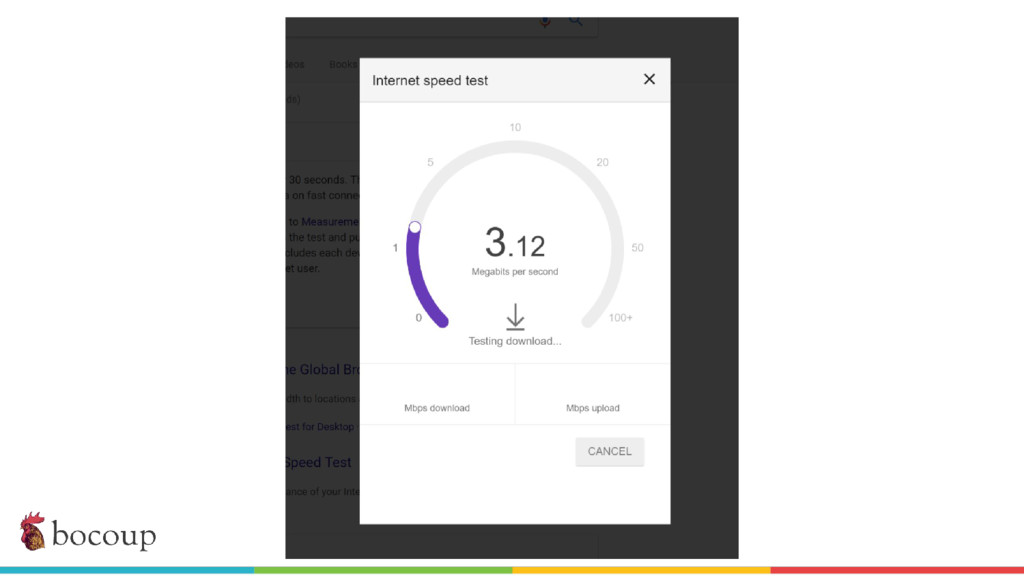
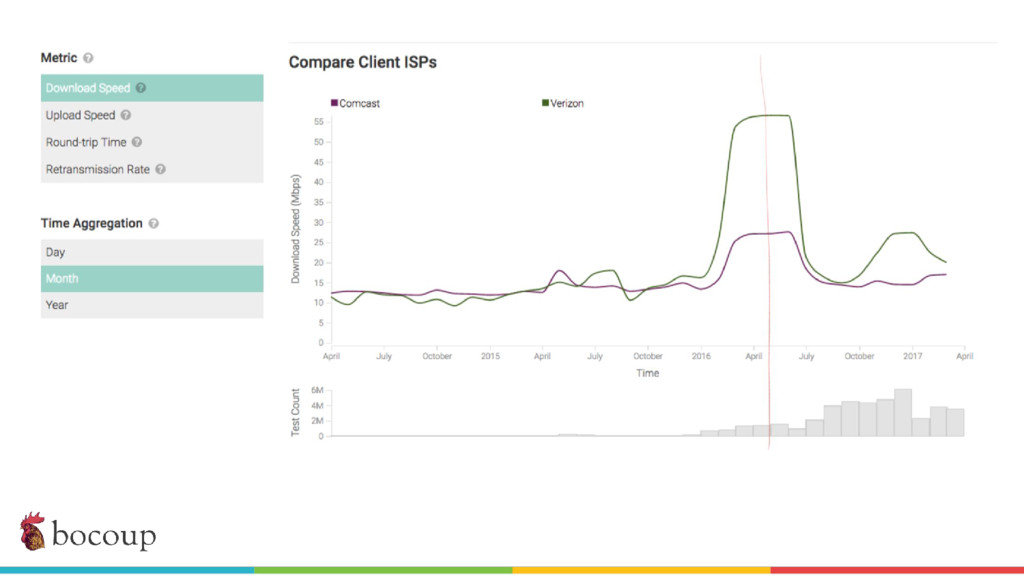
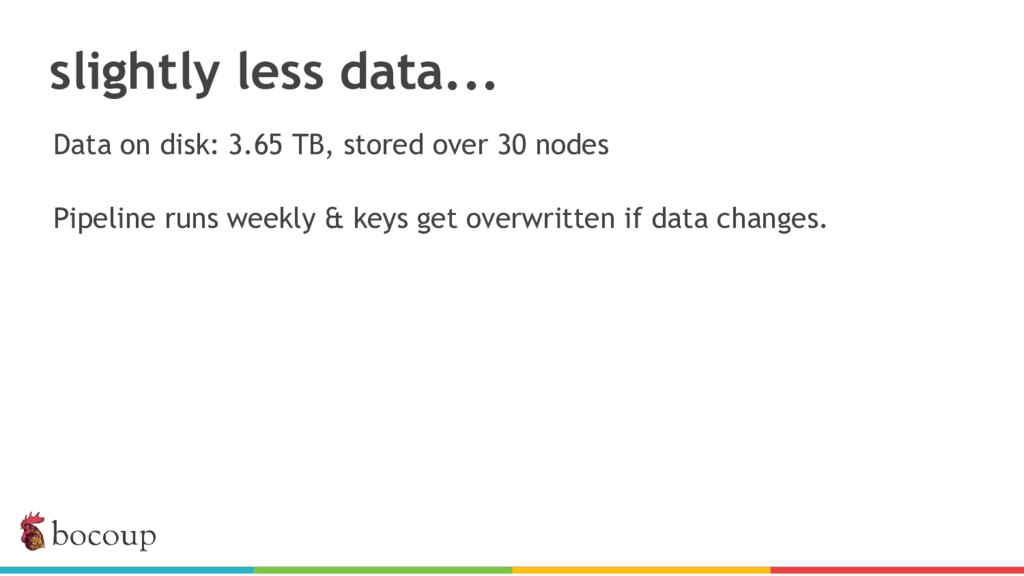
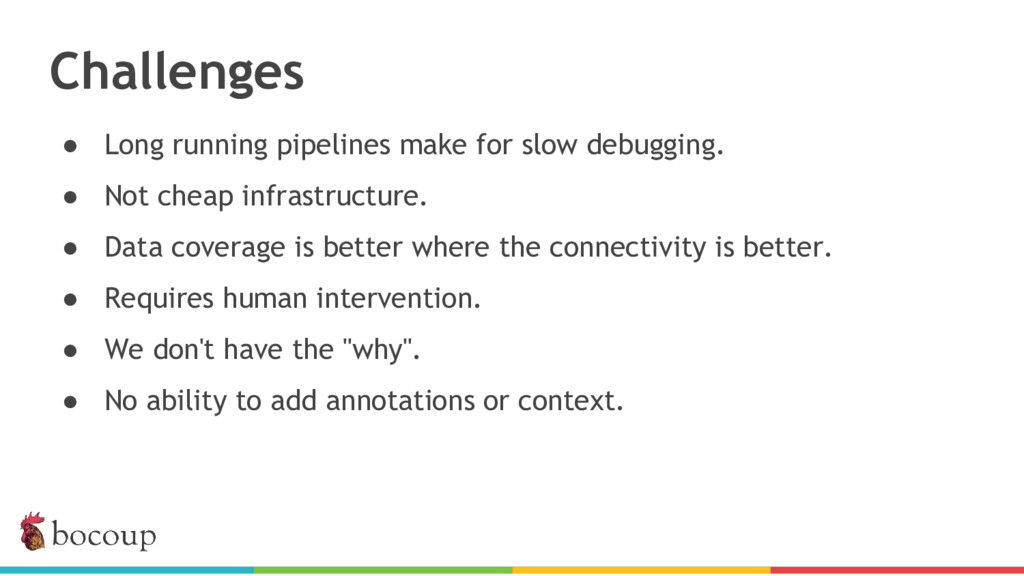
Measurement Lab (M-Lab)—the largest collection of open internet performance data on the planet—collects hundreds of thousands of consumer internet performance tests daily and provides that data in the public domain for research, analysis, and advocacy. Data has been piling up since 2009 (over five petabytes of information about the quality of experience on the internet), and more data is generated every day. Big data at this scale presents interesting challenges for everything from readability, visualization, and navigation to public access and affordability. The M-Lab data allows anyone to explore how their internet experience is mediated by all of the various actors that make up the internet.

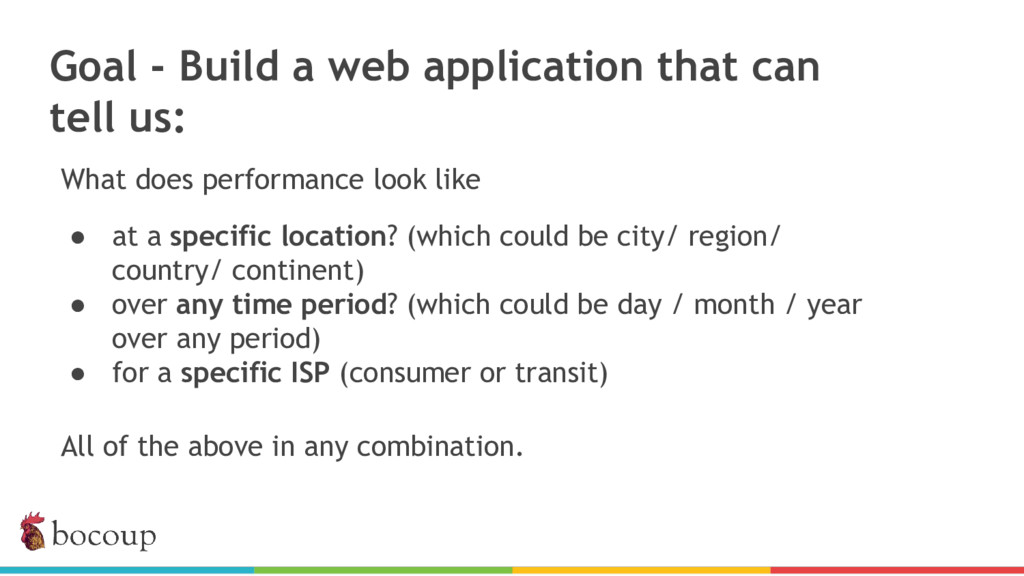
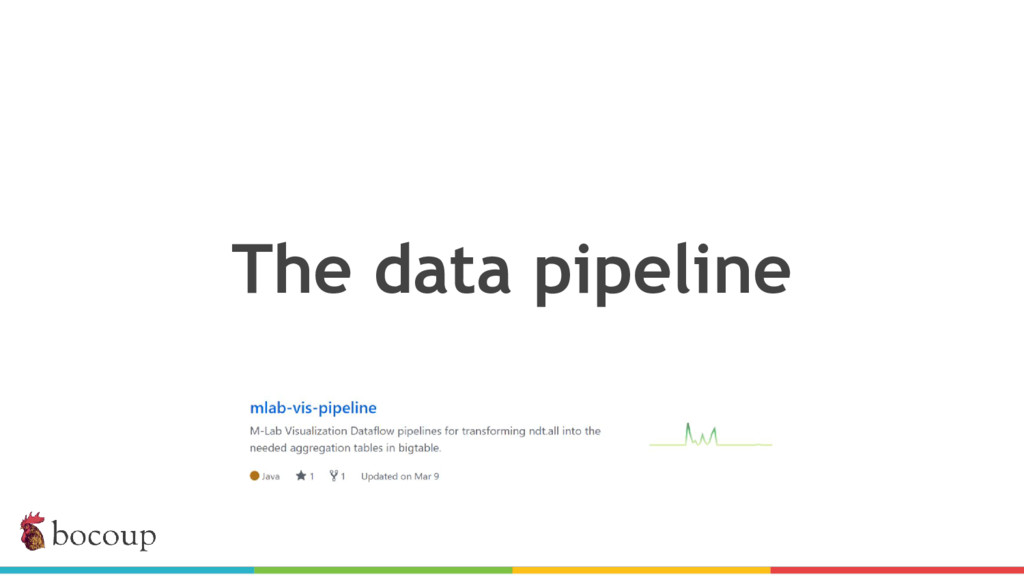
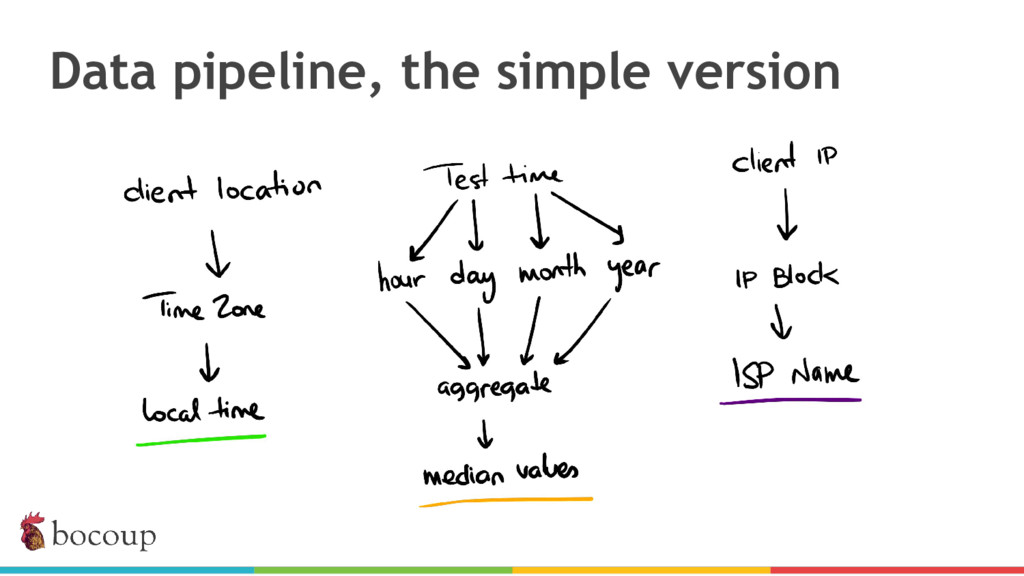
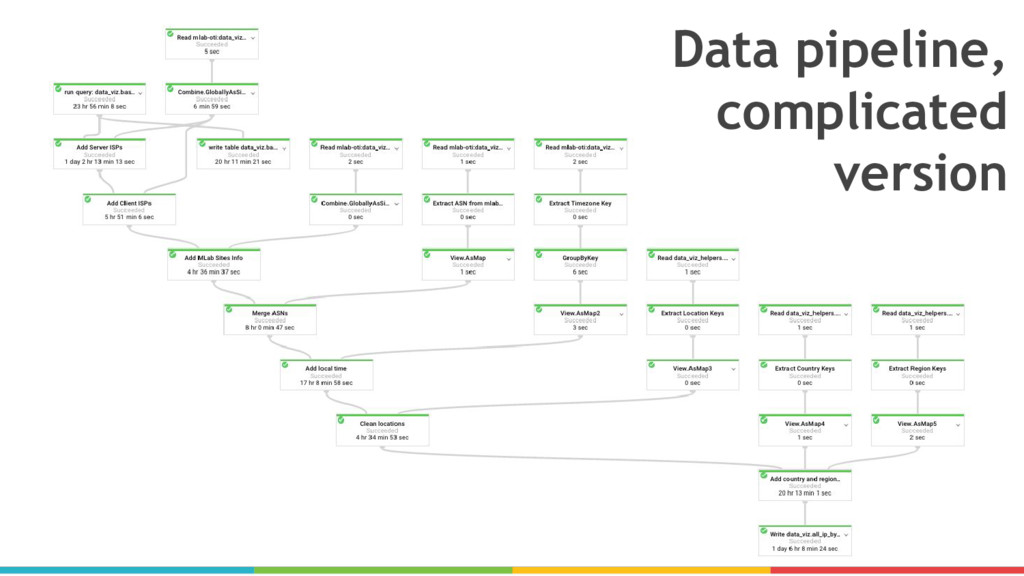
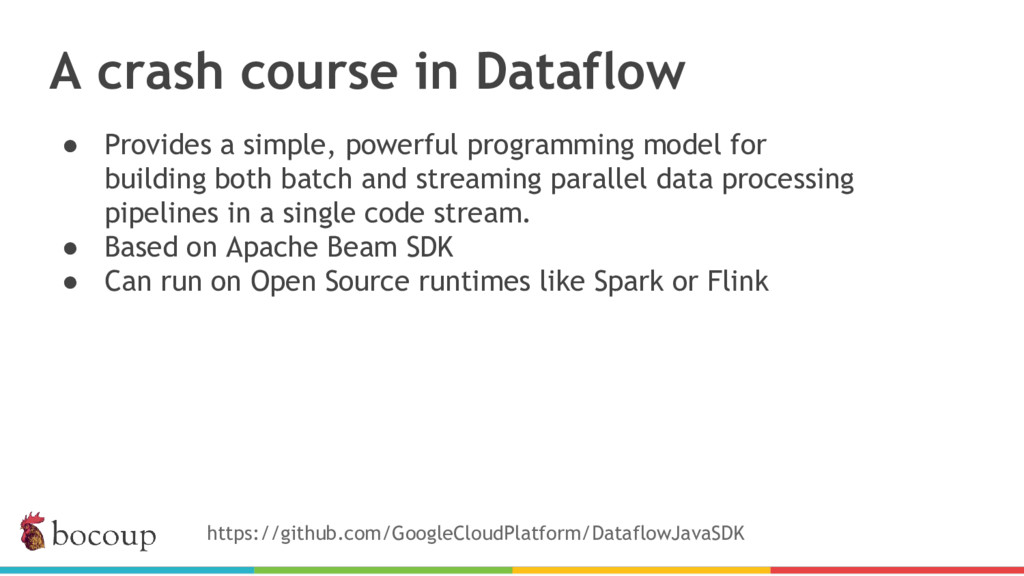
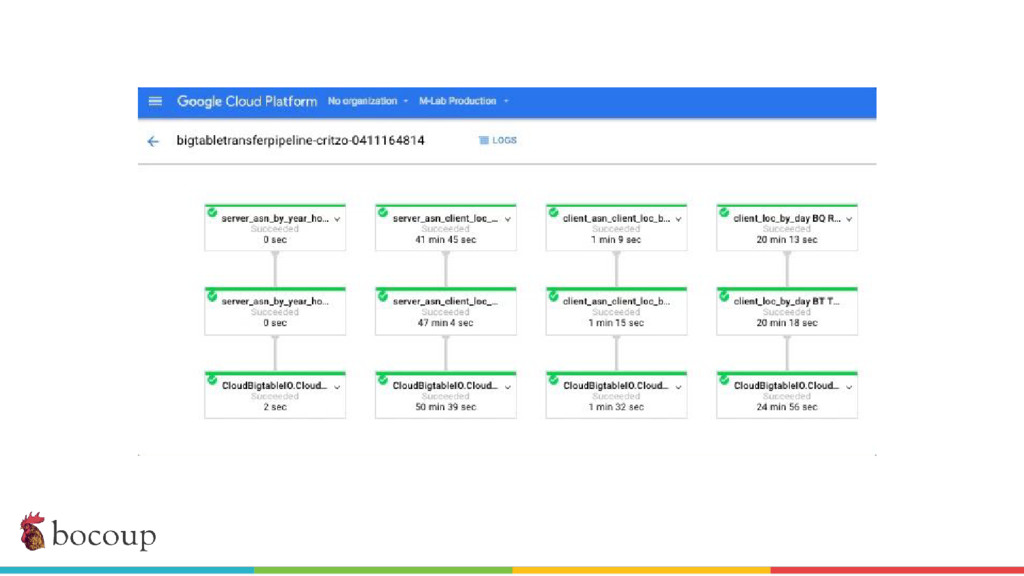
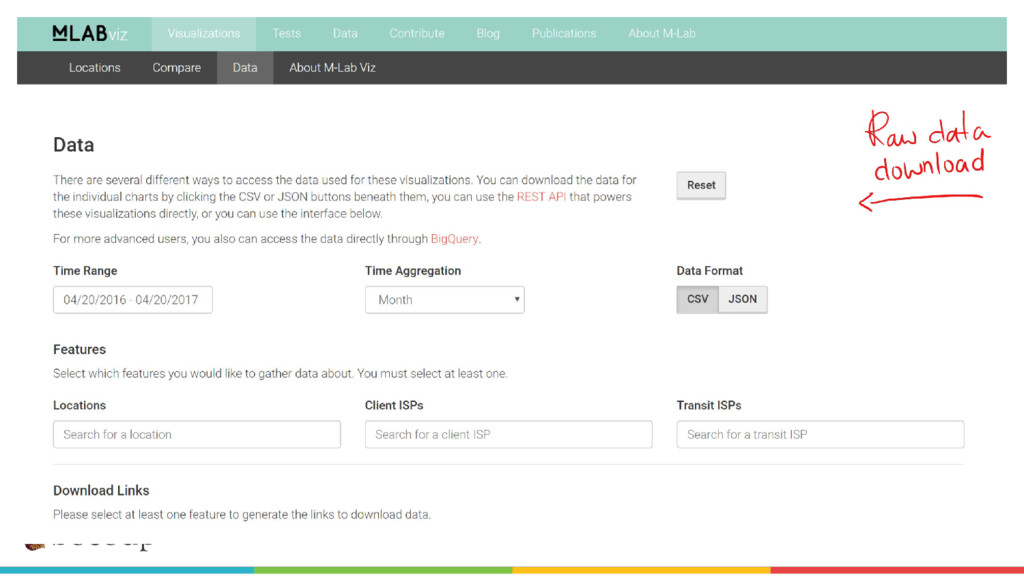
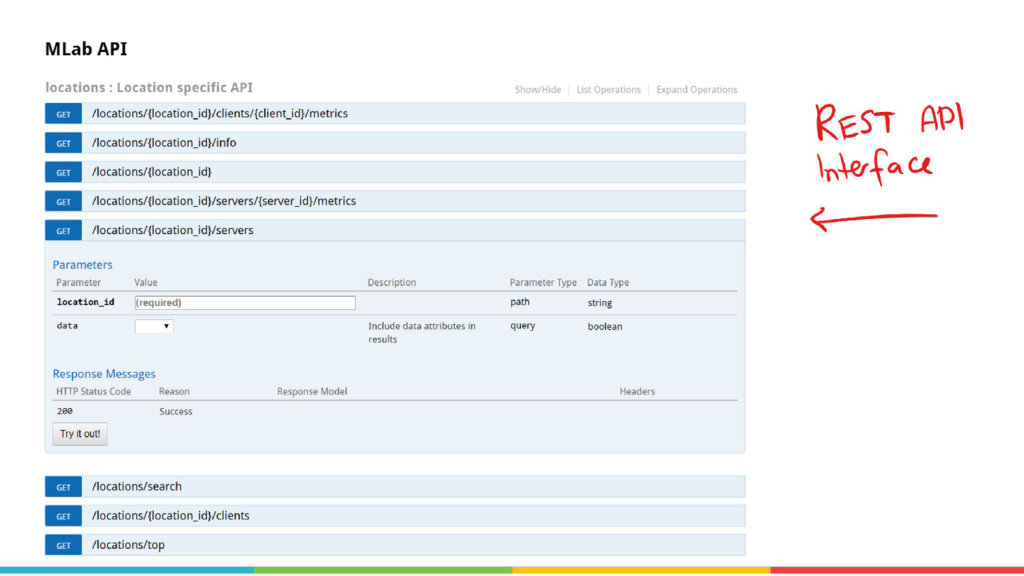
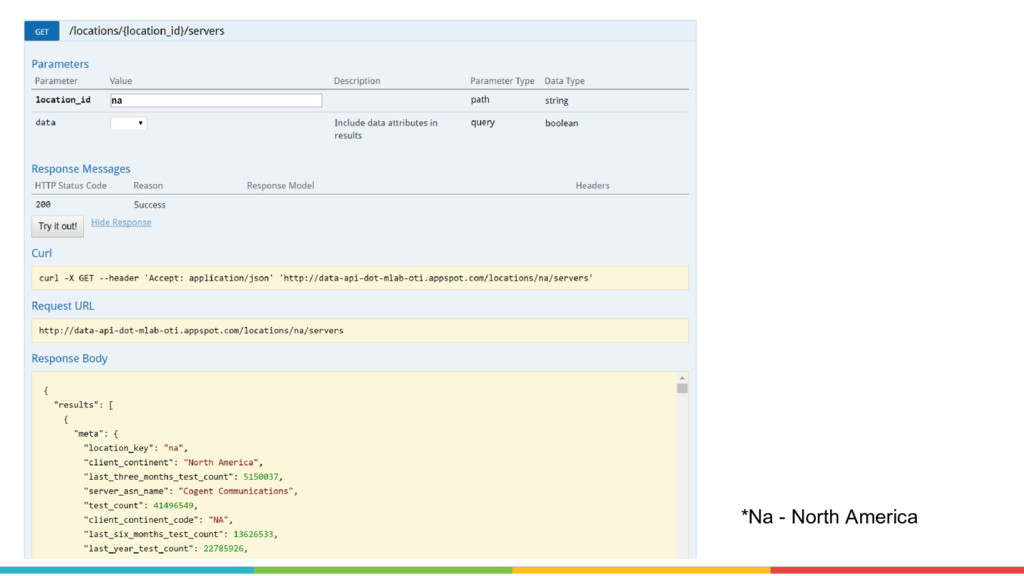
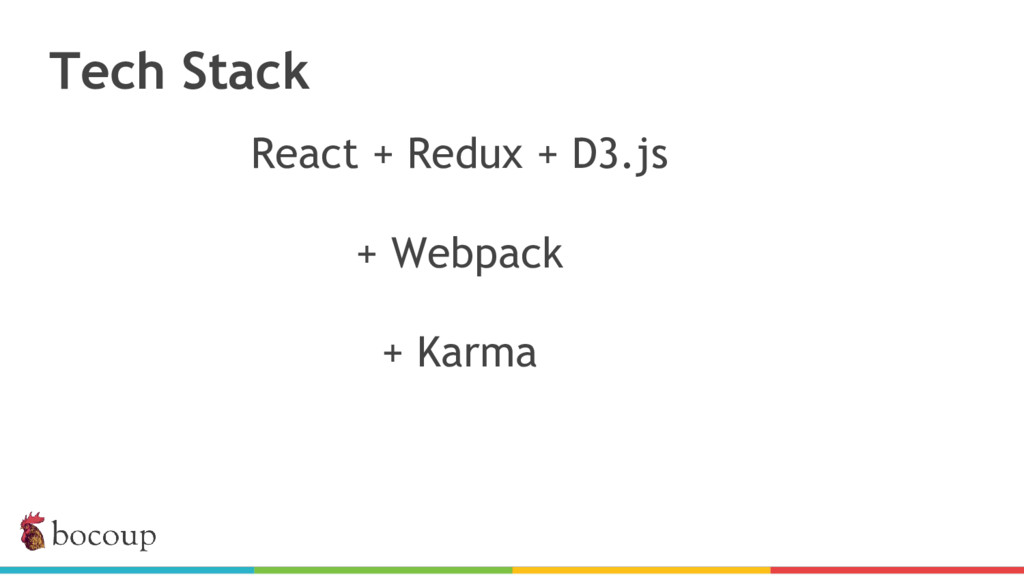
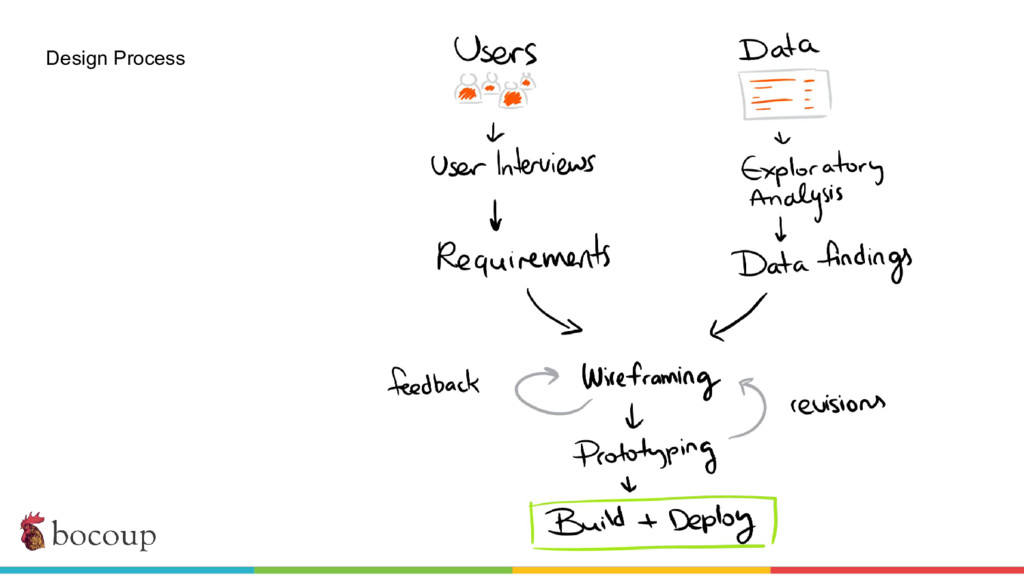
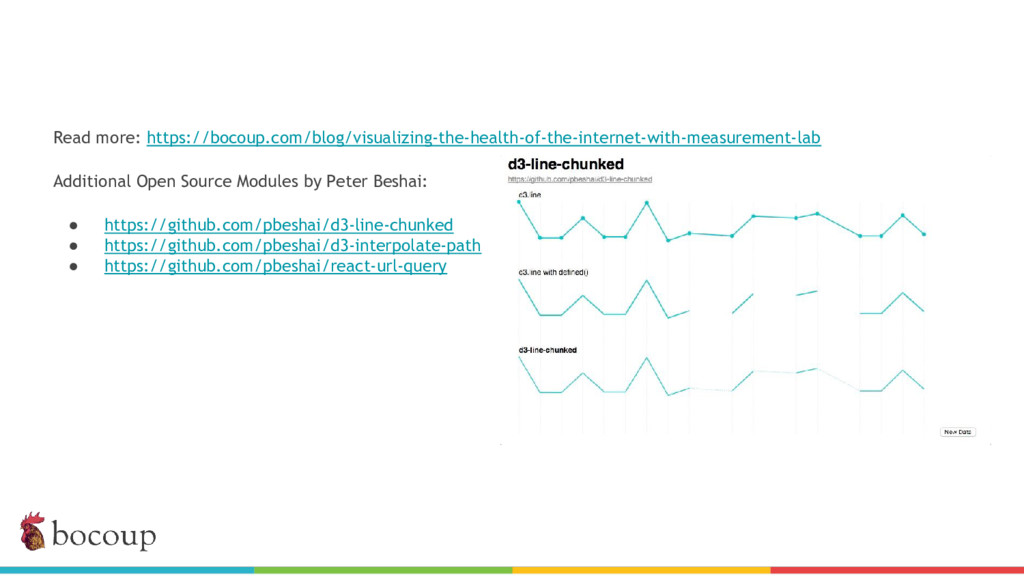
In this talk, I share recent work with the M-Lab team to develop a data processing pipeline, API, and visualizations to make the data more accessible to anyone interested in exploring open internet through consumer measurements, exploring both the technical and design aspects of the project.

To see a live version of this presentation (with all the gif goodness) you can see it here: https://docs.google.com/presentation/d/1RBMzIIvfyE1NDRPJZHvFBpJ5BEg2cE21L3pUtz29qfI/pub?start=false&loop=false&delayms=60000&slide=id.p

Irene Ros

May 25, 2017
Tweet

More Decks by Irene Ros

Other Decks in Technology

Transcript

  1. Visualizing the health of
    the internet
    Measurement Lab + Bocoup
    Irene Ros
    [email protected]
    @ireneros

    View Slide

  2. Get in touch!
    [email protected]
    http://bocoup.com/datavis

    View Slide

  3. M-Lab is an open, distributed server platform for researchers to deploy
    active Internet measurement tools, advanced networking research, and
    empower the public with useful information about their broadband
    connections.
    M-Lab's data is open to anyone [1]
    1.Using it isn't easy... We'll get into that.
    What is Measurement Lab?

    View Slide

  4. Why it exists?
    The goal of M-Lab is to advance network research and empower the public with useful
    information about their broadband connections.
    Driving challenges:
    1. a lack of well-provisioned and well-connected measurement servers in
    geographically distributed areas.
    2. the difficulties in sharing large Internet measurement datasets between different
    research projects
    3. legislators lack of broadband measurement data in their efforts to craft public policy.
    http://www.measurementlab.net/publications/measurement-lab-overview.pdf

    View Slide

  5. M-Lab has sites
    around the world
    (and growing). Each
    site has one or more
    servers.

    View Slide

  6. Users run speed tests
    = data

    View Slide

  7. What measurements matter to
    consumers?

    View Slide

  8. View Slide

  9. This is what happens
    when you request a
    website that is
    hosted on servers
    somewhere far away,
    for example, Turkey.

    View Slide

  10. ISP tests measure
    the route until
    their first router
    (Speedtest.net.)

    View Slide

  11. M-lab emulates the
    consumer
    experience so
    much better by
    measuring the full
    route from
    consumer to
    content

    View Slide

  12. Goal - Build a web application that can
    tell us:
    What does performance look like
    ● at a specific location? (which could be city/ region/
    country/ continent)
    ● over any time period? (which could be day / month / year
    over any period)
    ● for a specific ISP (consumer or transit)
    All of the above in any combination.

    View Slide

  13. Who is our audience?

    View Slide

  14. View Slide

  15. View Slide

  16. View Slide

  17. View Slide

  18. View Slide

  19. View Slide

  20. View Slide

  21. View Slide

  22. Zimbabwe local ISP ran promotion in Dec 2016
    during which they raised the bandwidth limits to
    get new subscribers.

    View Slide

  23. Regulation change in Brazil resulted in lower speeds for consumers.

    View Slide

  24. All is Open Source
    https://github.com/m-lab

    View Slide

  25. The data pipeline

    View Slide

  26. Our data: NDT Tests
    https://github.com/ndt-project/ndt/wiki/NDTDataFormat
    NDT reports upload and download speeds and attempts to determine what problems limit speeds.

    View Slide

  27. Raw data for the brave ones.
    Raw Data files: https://console.cloud.google.com/storage/browser/m-lab/ndt
    https://www.measurementlab.net/tools/ndt/

    View Slide

  28. How much data is that?
    Source: friends with root access...
    819,217,639 Tests in BigQuery
    All test data 243 TB on disk,
    Probably >100 TB of actual data. . .
    "Data so large we aren't even sure how much we have"

    View Slide

  29. BigQuery
    Schema
    https://www.measurementlab.net/data/b
    q/schema/
    https://rawgit.com/pboothe/bigquerygen
    erator/master/generator.html
    Relevant fields:
    - Download/upload flag
    - Location
    - IPs for client and server
    - Actual measurements

    View Slide

  30. https://github.com/m-lab/mlab-vis-pipeline/blob/master/dataflow/data/bigquery/queries/base_downloads_ip_by_hour.s
    ql

    View Slide

  31. https://www.measurementlab.net/data/bq/quickstart/

    View Slide

  32. View Slide

  33. View Slide

  34. View Slide

  35. Data pipeline, the simple version

    View Slide

  36. Data pipeline,
    complicated
    version

    View Slide

  37. A crash course in Dataflow
    ● Provides a simple, powerful programming model for
    building both batch and streaming parallel data processing
    pipelines in a single code stream.
    ● Based on Apache Beam SDK
    ● Can run on Open Source runtimes like Spark or Flink
    https://github.com/GoogleCloudPlatform/DataflowJavaSDK

    View Slide

  38. View Slide

  39. https://www.slideshare.net/VadimSolovey/dataflow-a-unified-model-for-batch-and-streaming-data-processing
    PTransforms:

    View Slide

  40. AddLocalTimePipeline
    Example pipeline transformation-adding time zones (element-wise)
    https://github.com/m-lab/mlab-vis-pipeline/blob/master/dataflow/src/main/java/mlab/dataviz/
    AddLocalTimePipeline.java

    View Slide

  41. https://github.com/m-lab/mlab-vis-pipeline/blob/master/dataflow/src/main/java/mlab/dataviz/HistoricPipeline.java

    View Slide

  42. View Slide

  43. https://github.com/m-lab/mlab-vis-pipeline/blob/master/dataflow/data/bigtable/client_loc_by_year.json

    View Slide

  44. https://github.com/m-lab/mlab-vis-pipeline/tree/master/dataflow/data/bigtable
    Date range queries fetch multiple
    keys.

    View Slide

  45. View Slide

  46. slightly less data...
    Data on disk: 3.65 TB, stored over 30 nodes
    Pipeline runs weekly & keys get overwritten if data changes.

    View Slide

  47. The data API

    View Slide

  48. View Slide

  49. View Slide

  50. *Na - North America

    View Slide

  51. The Front End

    View Slide

  52. Tech Stack
    React + Redux + D3.js
    + Webpack
    + Karma

    View Slide

  53. Design Process

    View Slide

  54. Initial data analysis with sample data
    or aggregations to verify data
    structure and confirm expected
    results and methods. Also useful for
    early algorithm prototyping.
    We identified and were able to
    remove rogue IPs that skewed actual
    data medians (testing IPs?)

    View Slide

  55. Hand drawn sketches,
    translated into high fidelity
    Sketch mockups used for
    soliciting feedback.
    Quick to adjust navigation,
    component priority and
    assumption about user intent.

    View Slide

  56. Reusable components make for quick
    Ul extension through clearly defined
    parameters, minimal reliance on data
    structure and no intra-component
    dependency (except through Redux
    shared store)

    View Slide

  57. Challenges
    ● Long running pipelines make for slow debugging.
    ● Not cheap infrastructure.
    ● Data coverage is better where the connectivity is better.
    ● Requires human intervention.
    ● We don't have the "why".
    ● No ability to add annotations or context.

    View Slide

  58. Read more: https://bocoup.com/blog/visualizing-the-health-of-the-internet-with-measurement-lab
    Additional Open Source Modules by Peter Beshai:
    ● https://github.com/pbeshai/d3-line-chunked
    ● https://github.com/pbeshai/d3-interpolate-path
    ● https://github.com/pbeshai/react-url-query

    View Slide

  59. Thank you
    Irene Ros
    [email protected]
    @ireneros
    Get in touch!
    [email protected]

    View Slide