Upgrade to Pro — share decks privately, control downloads, hide ads and more …

Architecting code with d3

Irene Ros
March 29, 2014

Architecting code with d3

d3.unconf keynote

Irene Ros

March 29, 2014
Tweet

More Decks by Irene Ros

Other Decks in Technology

Transcript

  1. My d3 "context" Big apps Lots of chart reuse Mostly

    standard charts Lots of data points (1000+ series on a line chart) All the maps, all the time Coordination between charts & other components
  2. Build chart A Build chart A again Build chart A

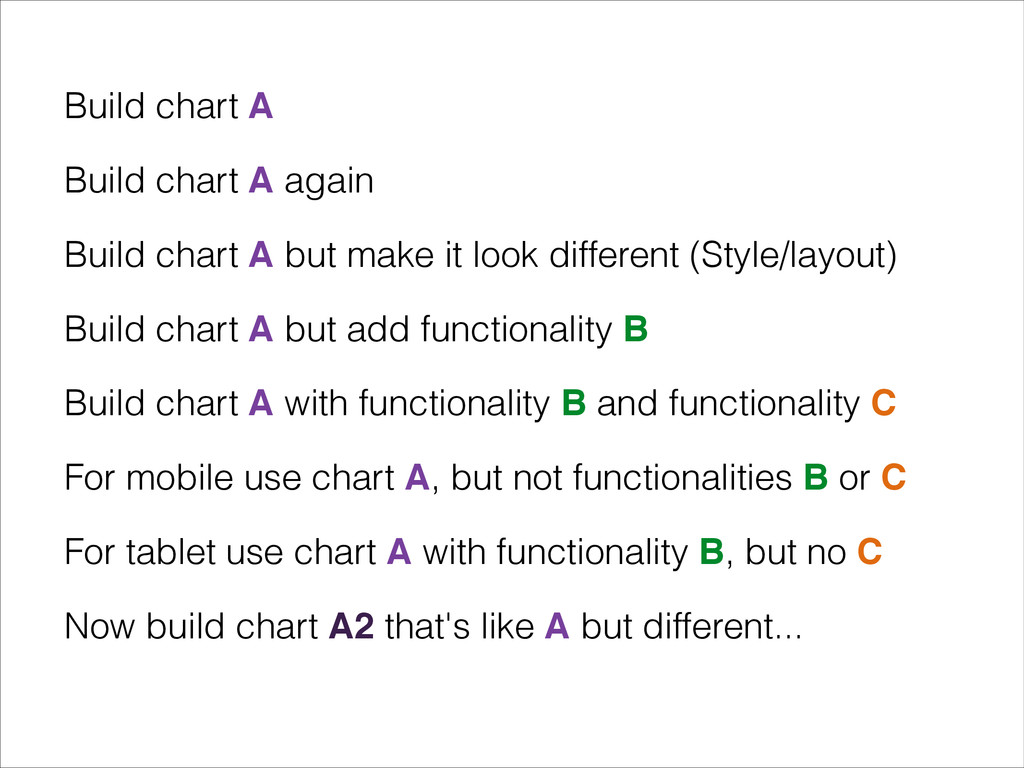
    but make it look different (Style/layout) Build chart A but add functionality B Build chart A with functionality B and functionality C For mobile use chart A, but not functionalities B or C For tablet use chart A with functionality B, but no C Now build chart A2 that's like A but different...
  3. It uses some visual marks, often many types for the

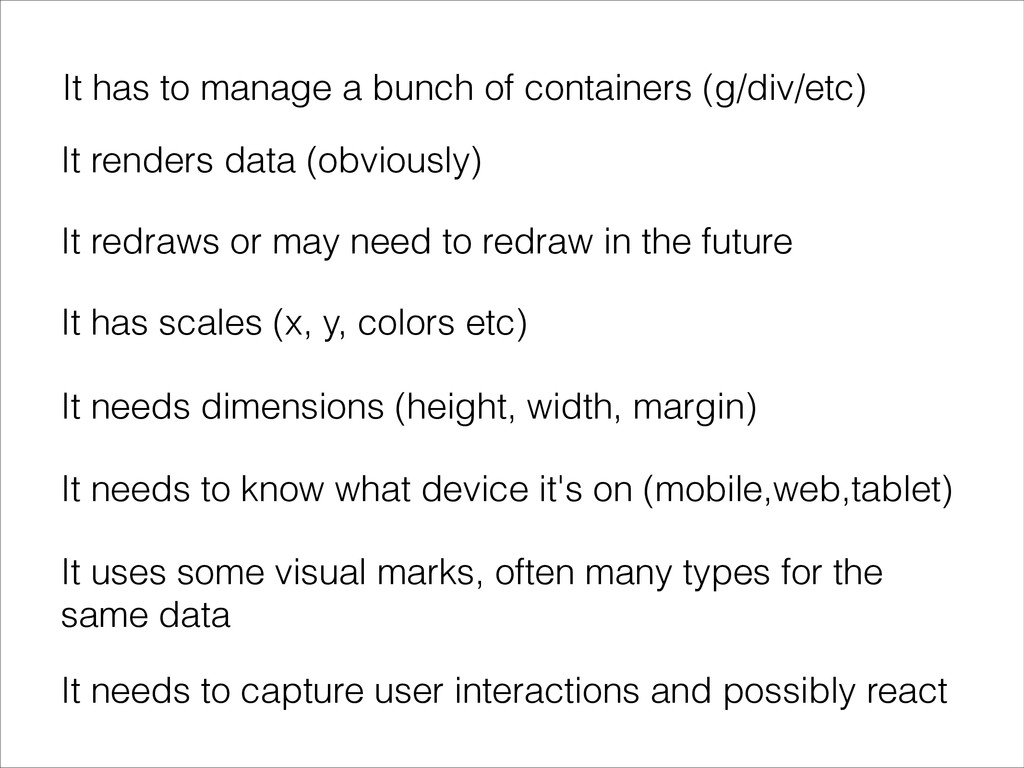
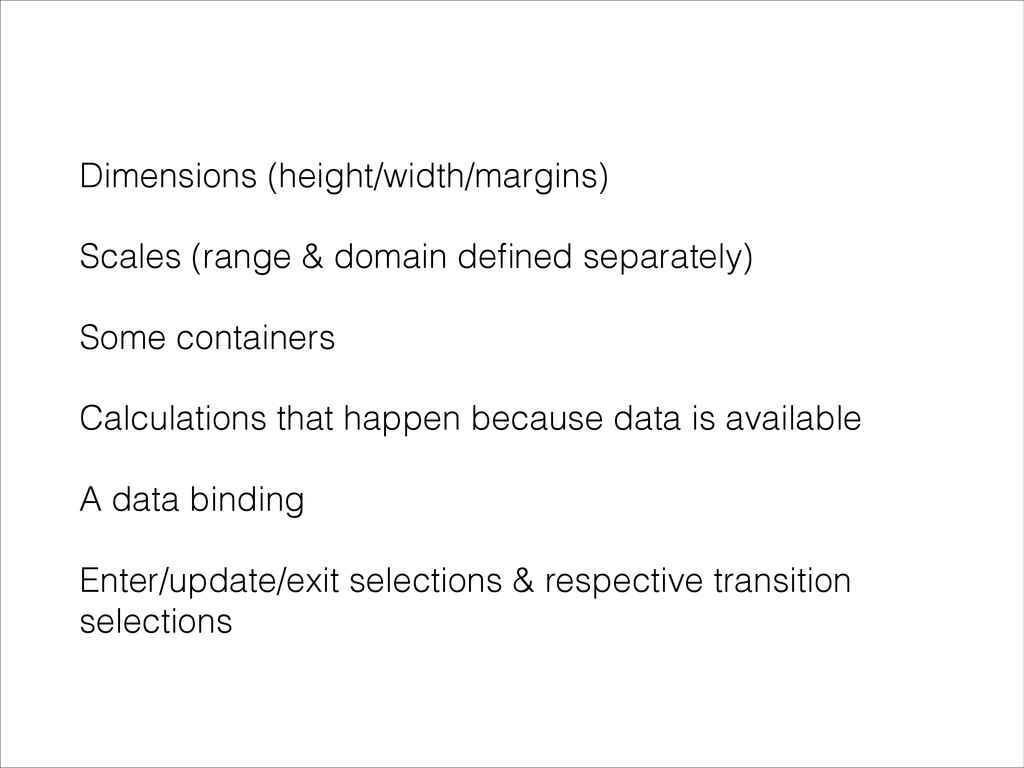
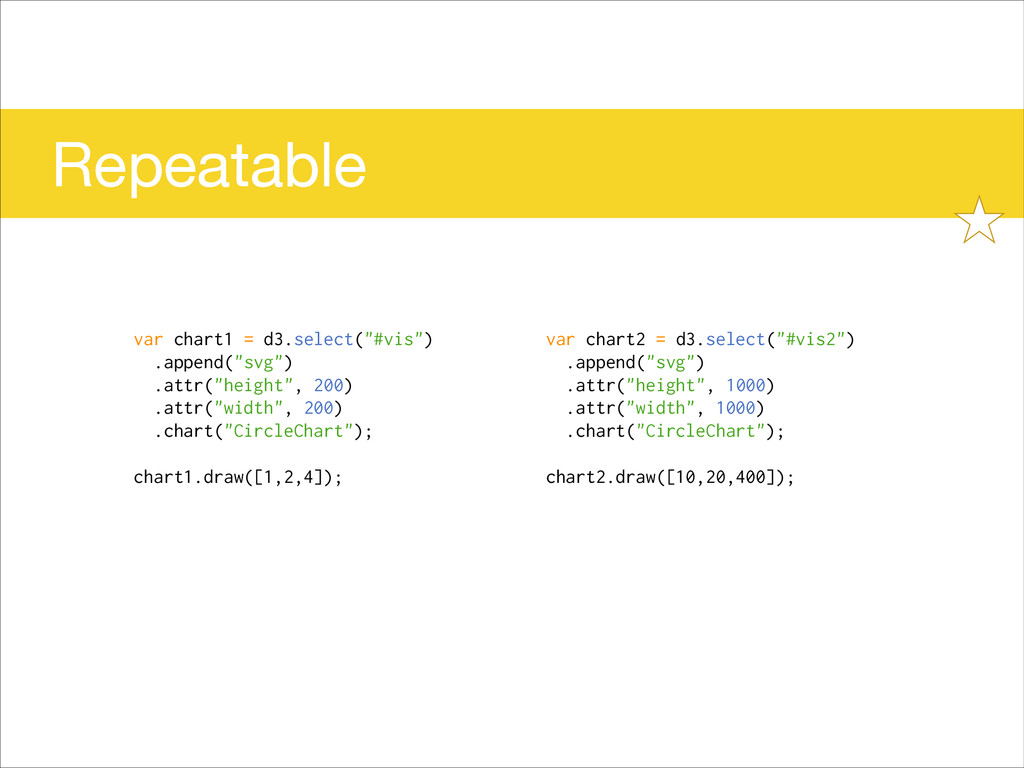
    same data It has scales (x, y, colors etc) It needs dimensions (height, width, margin) It needs to know what device it's on (mobile,web,tablet) It needs to capture user interactions and possibly react It renders data (obviously) It redraws or may need to redraw in the future It has to manage a bunch of containers (g/div/etc)
  4. var width = 960,! height = 500;! ! var y

    = d3.scale.linear()! .range([height, 0]);! ! var chart = d3.select(".chart")! .attr("width", width)! .attr("height", height);! ! d3.tsv("data.tsv", type, function(error, data) {! y.domain([0, d3.max(data, function(d) { return d.value; })]);! ! var barWidth = width / data.length;! ! var bar = chart.selectAll("g")! .data(data)! .enter().append("g")! .attr("transform", function(d, i) { return "translate(" + i * barWidth + ",0)"; });! ! bar.append("rect")! .attr("y", function(d) { return y(d.value); })! .attr("height", function(d) { return height - y(d.value); })! .attr("width", barWidth - 1);! ! bar.append("text")! .attr("x", barWidth / 2)! .attr("y", function(d) { return y(d.value) + 3; })! .attr("dy", ".75em")! .text(function(d) { return d.value; });! });! ! function type(d) {! d.value = +d.value; // coerce to number! return d;! }! http://bl.ocks.org/mbostock/7452541
  5. var width = 960,! height = 500;! ! var y

    = d3.scale.linear()! .range([height, 0]);! ! var chart = d3.select(".chart")! .attr("width", width)! .attr("height", height);! ! d3.tsv("data.tsv", type, function(error, data) {! y.domain([0, d3.max(data, function(d) { return d.value; })]);! ! var barWidth = width / data.length;! ! var bar = chart.selectAll("g")! .data(data)! .enter().append("g")! .attr("transform", function(d, i) { return "translate(" + i * barWidth + ",0)"; });! ! bar.append("rect")! .attr("y", function(d) { return y(d.value); })! .attr("height", function(d) { return height - y(d.value); })! .attr("width", barWidth - 1);! ! bar.append("text")! .attr("x", barWidth / 2)! .attr("y", function(d) { return y(d.value) + 3; })! .attr("dy", ".75em")! .text(function(d) { return d.value; });! });! ! function type(d) {! d.value = +d.value; // coerce to number! return d;! }! http://bl.ocks.org/mbostock/7452541
  6. var width = 960,! height = 500;! ! var y

    = d3.scale.linear()! .range([height, 0]);! ! var chart = d3.select(".chart")! .attr("width", width)! .attr("height", height);! ! d3.tsv("data.tsv", type, function(error, data) {! y.domain([0, d3.max(data, function(d) { return d.value; })]);! ! var barWidth = width / data.length;! ! var bar = chart.selectAll("g")! .data(data)! .enter().append("g")! .attr("transform", function(d, i) { return "translate(" + i * barWidth + ",0)"; });! ! bar.append("rect")! .attr("y", function(d) { return y(d.value); })! .attr("height", function(d) { return height - y(d.value); })! .attr("width", barWidth - 1);! ! bar.append("text")! .attr("x", barWidth / 2)! .attr("y", function(d) { return y(d.value) + 3; })! .attr("dy", ".75em")! .text(function(d) { return d.value; });! });! ! function type(d) {! d.value = +d.value; // coerce to number! return d;! }! http://bl.ocks.org/mbostock/7452541
  7. var width = 960,! height = 500;! ! var y

    = d3.scale.linear()! .range([height, 0]);! ! var chart = d3.select(".chart")! .attr("width", width)! .attr("height", height);! ! d3.tsv("data.tsv", type, function(error, data) {! y.domain([0, d3.max(data, function(d) { return d.value; })]);! ! var barWidth = width / data.length;! ! var bar = chart.selectAll("g")! .data(data)! .enter().append("g")! .attr("transform", function(d, i) { return "translate(" + i * barWidth + ",0)"; });! ! bar.append("rect")! .attr("y", function(d) { return y(d.value); })! .attr("height", function(d) { return height - y(d.value); })! .attr("width", barWidth - 1);! ! bar.append("text")! .attr("x", barWidth / 2)! .attr("y", function(d) { return y(d.value) + 3; })! .attr("dy", ".75em")! .text(function(d) { return d.value; });! });! ! function type(d) {! d.value = +d.value; // coerce to number! return d;! }! http://bl.ocks.org/mbostock/7452541
  8. var width = 960,! height = 500;! ! var y

    = d3.scale.linear()! .range([height, 0]);! ! var chart = d3.select(".chart")! .attr("width", width)! .attr("height", height);! ! d3.tsv("data.tsv", type, function(error, data) {! y.domain([0, d3.max(data, function(d) { return d.value; })]);! ! var barWidth = width / data.length;! ! var bar = chart.selectAll("g")! .data(data)! .enter().append("g")! .attr("transform", function(d, i) { return "translate(" + i * barWidth + ",0)"; });! ! bar.append("rect")! .attr("y", function(d) { return y(d.value); })! .attr("height", function(d) { return height - y(d.value); })! .attr("width", barWidth - 1);! ! bar.append("text")! .attr("x", barWidth / 2)! .attr("y", function(d) { return y(d.value) + 3; })! .attr("dy", ".75em")! .text(function(d) { return d.value; });! });! ! function type(d) {! d.value = +d.value; // coerce to number! return d;! }! http://bl.ocks.org/mbostock/7452541
  9. var width = 960,! height = 500;! ! var y

    = d3.scale.linear()! .range([height, 0]);! ! var chart = d3.select(".chart")! .attr("width", width)! .attr("height", height);! ! d3.tsv("data.tsv", type, function(error, data) {! y.domain([0, d3.max(data, function(d) { return d.value; })]);! ! var barWidth = width / data.length;! ! var bar = chart.selectAll("g")! .data(data)! .enter().append("g")! .attr("transform", function(d, i) { return "translate(" + i * barWidth + ",0)"; });! ! bar.append("rect")! .attr("y", function(d) { return y(d.value); })! .attr("height", function(d) { return height - y(d.value); })! .attr("width", barWidth - 1);! ! bar.append("text")! .attr("x", barWidth / 2)! .attr("y", function(d) { return y(d.value) + 3; })! .attr("dy", ".75em")! .text(function(d) { return d.value; });! });! ! function type(d) {! d.value = +d.value; // coerce to number! return d;! }! http://bl.ocks.org/mbostock/7452541
  10. var width = 960,! height = 500;! ! var y

    = d3.scale.linear()! .range([height, 0]);! ! var chart = d3.select(".chart")! .attr("width", width)! .attr("height", height);! ! d3.tsv("data.tsv", type, function(error, data) {! y.domain([0, d3.max(data, function(d) { return d.value; })]);! ! var barWidth = width / data.length;! ! var bar = chart.selectAll("g")! .data(data)! .enter().append("g")! .attr("transform", function(d, i) { return "translate(" + i * barWidth + ",0)"; });! ! bar.append("rect")! .attr("y", function(d) { return y(d.value); })! .attr("height", function(d) { return height - y(d.value); })! .attr("width", barWidth - 1);! ! bar.append("text")! .attr("x", barWidth / 2)! .attr("y", function(d) { return y(d.value) + 3; })! .attr("dy", ".75em")! .text(function(d) { return d.value; });! });! ! function type(d) {! d.value = +d.value; // coerce to number! return d;! }! http://bl.ocks.org/mbostock/7452541
  11. var width = 960,! height = 500;! ! var y

    = d3.scale.linear()! .range([height, 0]);! ! var chart = d3.select(".chart")! .attr("width", width)! .attr("height", height);! ! d3.tsv("data.tsv", type, function(error, data) {! y.domain([0, d3.max(data, function(d) { return d.value; })]);! ! var barWidth = width / data.length;! ! var bar = chart.selectAll("g")! .data(data)! .enter().append("g")! .attr("transform", function(d, i) { return "translate(" + i * barWidth + ",0)"; });! ! bar.append("rect")! .attr("y", function(d) { return y(d.value); })! .attr("height", function(d) { return height - y(d.value); })! .attr("width", barWidth - 1);! ! bar.append("text")! .attr("x", barWidth / 2)! .attr("y", function(d) { return y(d.value) + 3; })! .attr("dy", ".75em")! .text(function(d) { return d.value; });! });! ! function type(d) {! d.value = +d.value; // coerce to number! return d;! }! http://bl.ocks.org/mbostock/7452541
  12. var width = 960,! height = 500;! ! var y

    = d3.scale.linear()! .range([height, 0]);! ! var chart = d3.select(".chart")! .attr("width", width)! .attr("height", height);! ! d3.tsv("data.tsv", type, function(error, data) {! y.domain([0, d3.max(data, function(d) { return d.value; })]);! ! var barWidth = width / data.length;! ! var bar = chart.selectAll("g")! .data(data)! .enter().append("g")! .attr("transform", function(d, i) { return "translate(" + i * barWidth + ",0)"; });! ! bar.append("rect")! .attr("y", function(d) { return y(d.value); })! .attr("height", function(d) { return height - y(d.value); })! .attr("width", barWidth - 1);! ! bar.append("text")! .attr("x", barWidth / 2)! .attr("y", function(d) { return y(d.value) + 3; })! .attr("dy", ".75em")! .text(function(d) { return d.value; });! });! ! function type(d) {! d.value = +d.value; // coerce to number! return d;! }! http://bl.ocks.org/mbostock/7452541
  13. Dimensions (height/width/margins) Scales (range & domain defined separately) Some containers

    Calculations that happen because data is available A data binding Enter/update/exit selections & respective transition selections
  14. Repeatable Easy to create multiple instances of What is a

    reusable chart? Difficulty level: BarChart Constructor
  15. Configurable Easy to appropriate for a specific task What is

    a reusable chart? Difficulty level: BarChart Constructor
  16. Extensible Easy to extend with additional functionality What is a

    reusable chart? Difficulty level: BarChart Constructor 10 20 60 30
  17. Composable Easy to combine into other charts What is a

    reusable chart? Difficulty level: BarChart Constructor Label Constructor 10 20 60 30 + 10 20 60 30 =
  18. d3.chart("CircleChart", {! initialize: function() {! },! color: function(newFill) {! }!

    });
 var chart1 = d3.select("#vis")
 .append("svg")
 .attr("height", 200)
 .attr("width", 200)
 .chart("CircleChart") .color("orange");
 
 chart1.draw([1,3,7,8,11,12.5,14]);
  19. var chart1 = d3.select("#vis")
 .append("svg")
 .attr("height", 200)
 .attr("width", 200)
 .chart("CircleChart")

    .color("orange");
 
 chart1.draw([1,3,7,8,11,12.5,14]); d3.chart("CircleChart", {! initialize: function() {! this.xScale = d3.scale.linear()! .range([0, +this.base.attr("width")]);! },! color: function(newFill) {! },! transform: function(data) {! this.xScale.domain(d3.extent(data))! return data;! }! });

  20. var chart1 = d3.select("#vis")
 .append("svg")
 .attr("height", 200)
 .attr("width", 200)
 .chart("CircleChart")

    .color("orange");
 
 chart1.draw([1,3,7,8,11,12.5,14]); d3.chart("CircleChart", {! initialize: function() {! this.xScale = d3.scale.linear()! .range([0, +this.base.attr("width")]);! },! color: function(newFill) {! if (arguments.length) { return this._fill; }! this._fill = newFill;! return this;! },! transform: function(data) {! this.xScale.domain(d3.extent(data))! return data;! }! });

  21. var chart1 = d3.select("#vis")
 .append("svg")
 .attr("height", 200)
 .attr("width", 200)
 .chart("CircleChart")

    .color("orange");
 
 chart1.draw([1,3,7,8,11,12.5,14]); d3.chart("CircleChart", {! initialize: function() {! this.xScale = d3.scale.linear()! .range([0, +this.base.attr("width")]);! ! this.layer("circles", this.base.append("g"), {! ! });! },! color: function(newFill) {! if (arguments.length) { return this._fill; }! this._fill = newFill;! return this;! },! transform: function(data) {! this.xScale.domain(d3.extent(data))! return data;! }! });

  22. var chart1 = d3.select("#vis")
 .append("svg")
 .attr("height", 200)
 .attr("width", 200)
 .chart("CircleChart")

    .color("orange");
 
 chart1.draw([1,3,7,8,11,12.5,14]); d3.chart("CircleChart", {! initialize: function() {! this.xScale = d3.scale.linear()! .range([0, +this.base.attr("width")]);! ! this.layer("circles", this.base.append("g"), {! dataBind: function(data) {! },! insert: function() {! },! events : {! }! });! },! color: function(newFill) {! if (arguments.length) { return this._fill; }! this._fill = newFill;! return this;! },! transform: function(data) {! this.xScale.domain(d3.extent(data))! return data;! }! });

  23. var chart1 = d3.select("#vis")
 .append("svg")
 .attr("height", 200)
 .attr("width", 200)
 .chart("CircleChart")

    .color("orange");
 
 chart1.draw([1,3,7,8,11,12.5,14]); d3.chart("CircleChart", {! initialize: function() {! this.xScale = d3.scale.linear()! .range([0, +this.base.attr("width")]);! ! this.layer("circles", this.base.append("g"), {! dataBind: function(data) {! return this.selectAll("circle")! .data(data);! },! insert: function() {! },! events : {! }! });! },! color: function(newFill) {! if (arguments.length) { return this._fill; }! this._fill = newFill;! return this;! },! transform: function(data) {! this.xScale.domain(d3.extent(data))! return data;! }! });

  24. var chart1 = d3.select("#vis")
 .append("svg")
 .attr("height", 200)
 .attr("width", 200)
 .chart("CircleChart")

    .color("orange");
 
 chart1.draw([1,3,7,8,11,12.5,14]); d3.chart("CircleChart", {! initialize: function() {! this.xScale = d3.scale.linear()! .range([0, +this.base.attr("width")]);! ! this.layer("circles", this.base.append("g"), {! dataBind: function(data) {! return this.selectAll("circle")! .data(data);! },! insert: function() {! return this.append("circle"); ! },! events : {! }! });! },! color: function(newFill) {! if (arguments.length) { return this._fill; }! this._fill = newFill;! return this;! },! transform: function(data) {! this.xScale.domain(d3.extent(data))! return data;! }! });

  25. var chart1 = d3.select("#vis")
 .append("svg")
 .attr("height", 200)
 .attr("width", 200)
 .chart("CircleChart")

    .color("orange");
 
 chart1.draw([1,3,7,8,11,12.5,14]); d3.chart("CircleChart", {! initialize: function() {! this.xScale = d3.scale.linear()! .range([0, +this.base.attr("width")]);! ! this.layer("circles", this.base.append("g"), {! dataBind: function(data) {! return this.selectAll("circle")! .data(data);! },! insert: function() {! return this.append("circle"); ! },! events : {! "enter": function() {! },! "exit:transition": function() {! }! }! });! },! color: function(newFill) {! if (arguments.length) { return this._fill; }! this._fill = newFill;! return this;! },! transform: function(data) {! this.xScale.domain(d3.extent(data))! return data;! }! });

  26. d3.chart("CircleChart", {! initialize: function() {! this.xScale = d3.scale.linear()! .range([0, +this.base.attr("width")]);!

    ! this.layer("circles", this.base.append("g"), {! dataBind: function(data) {! return this.selectAll("circle")! .data(data);! },! insert: function() {! return this.append("circle"); ! },! events : {! "enter": function() {! var chart = this.chart();! this.attr("cy", 100)! .attr("cx", function(d) {! return chart.xScale(d);! })! .attr("r", 5)! .style("fill", chart.color()); ! },! "exit:transition": function() {! this.style("fill-opacity", 0)! .remove();! }! }! });! },! color: function(newFill) {! if (arguments.length) { return this._fill; }! this._fill = newFill;! return this;! },! transform: function(data) {! this.xScale.domain(d3.extent(data))! return data;! }! });
 var chart1 = d3.select("#vis")
 .append("svg")
 .attr("height", 200)
 .attr("width", 200)
 .chart("CircleChart") .color("orange");
 
 chart1.draw([1,3,7,8,11,12.5,14]);
  27. Repeatable var chart2 = d3.select("#vis2")
 .append("svg")
 .attr("height", 1000)
 .attr("width", 1000)


    .chart("CircleChart"); ! chart2.draw([10,20,400]);
 var chart1 = d3.select("#vis")
 .append("svg")
 .attr("height", 200)
 .attr("width", 200)
 .chart("CircleChart"); ! chart1.draw([1,2,4]);

  28. Configurable var chart1 = d3.select("#vis")
 .append("svg")
 .attr("height", 200)
 .attr("width", 200)


    .chart("CircleChart") .color("orange");
 
 chart1.draw(data); var chart2 = d3.select("#vis")
 .append("svg")
 .attr("height", 200)
 .attr("width", 200)
 .chart("CircleChart") .color("blue");
 
 chart2.draw(data);
  29. d3.chart("CircleChart").extend("CirclesWithNumbersChart", {! initialize: function() {! this.layer("labels", this.base.append("g"), {! dataBind: function(data)

    {! return this.selectAll("text")! .data(data);! },! insert: function() {! return this.append("text");! },! events: {! enter: function() {! var chart = this.chart();! return this.attr("x", function(d) {! return chart.xScale(d);! })! .attr("y", 80)! .style("text-anchor", "middle")! .text(String);! }! }! });! }! });! Extensible
  30. var chart1 = d3.select("#vis")
 .append("svg")
 .attr("height", 200)
 .attr("width", 200)
 .chart("CirclesWithNumbersChart")


    .color("blue"); d3.chart("CircleChart").extend("CirclesWithNumbersChart", {! initialize: function() {! this.layer("labels", this.base.append("g"), {! dataBind: function(data) {! return this.selectAll("text")! .data(data);! },! insert: function() {! return this.append("text");! },! events: {! enter: function() {! var chart = this.chart();! return this.attr("x", function(d) {! return chart.xScale(d);! })! .attr("y", 80)! .style("text-anchor", "middle")! .text(String);! }! }! });! }! });! Extensible
  31. Composable d3.chart("LabelsChart", {
 initialize: function() {
 this.layer("labels", this.base.append("g"), {
 dataBind:

    function(data) {
 return this.selectAll("text")
 .data(data);
 },
 insert: function() {
 return this.append("text"); 
 },
 events: {
 enter: function() {
 this.attr("x", function(d) {
 return d * 10;
 })
 .attr("y", 80)
 .style("text-anchor", "middle")
 .text(function(d) { return d; });
 
 }
 }
 });
 }
 }); d3.chart("CircleChart", {
 initialize: function() {
 this.layer("circles", this.base.append("g"), {
 // other layer instructions...
 events : {
 enter: function() {
 this.attr("cy", 100)
 .attr("cx", function(d) {
 return d * 10;
 })
 .attr("r", 5)
 .style("fill", this.chart().fill()); 
 }
 }
 });
 },
 color: function(newFill) {
 if (arguments.length === 0) {
 return this._fill;
 }
 this._fill = newFill;
 return this;
 }
 });
  32. d3.chart("CLChart", {
 initialize: function() {
 var circles = this.base.append("g") 


    .chart("CircleChart");
 );
 var labels = this.base.append("g") 
 .chart("LabelsChart");
 ); this.attach("circles", circles); this.attach("labels", labels);
 }
 }); Composable
  33. var chart1 = d3.select("#vis")
 .append("svg")
 .attr("height", 200)
 .attr("width", 200)
 .chart("CLChart");


 chart1.draw(data); d3.chart("CLChart", {
 initialize: function() {
 var circles = this.base.append("g") 
 .chart("CircleChart");
 );
 var labels = this.base.append("g") 
 .chart("LabelsChart");
 ); this.attach("circles", circles); this.attach("labels", labels);
 }
 }); Composable
  34. Why not http://bost.ocks.org/mike/chart/ • Lifecycle selections are not accessible (hard

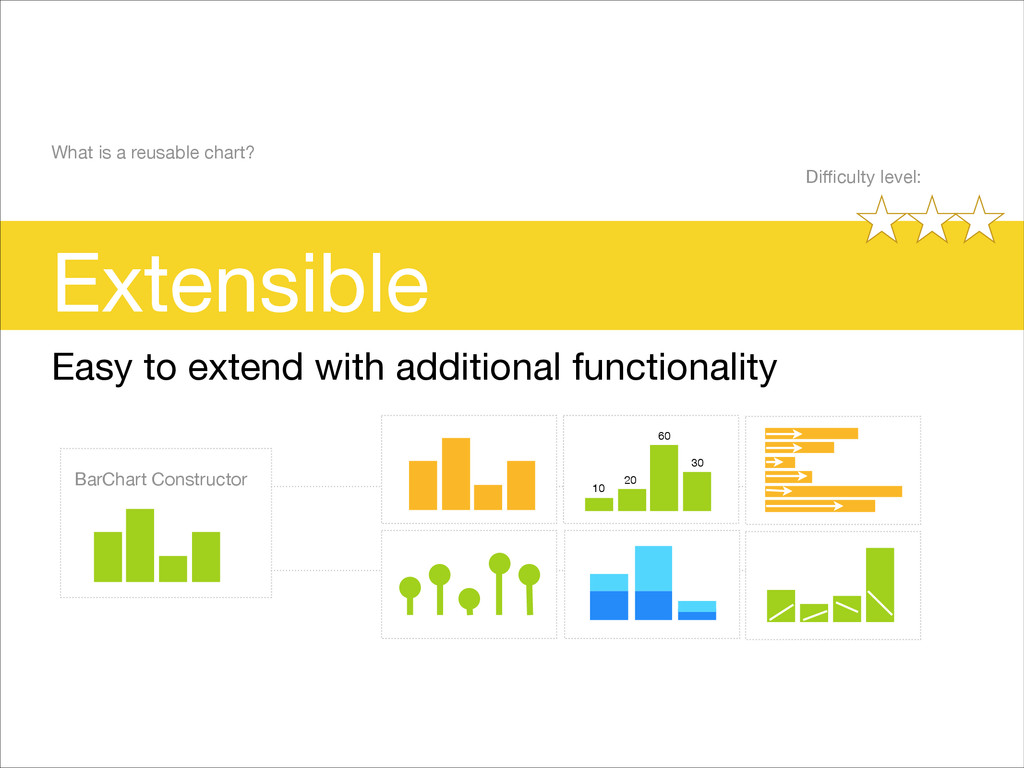
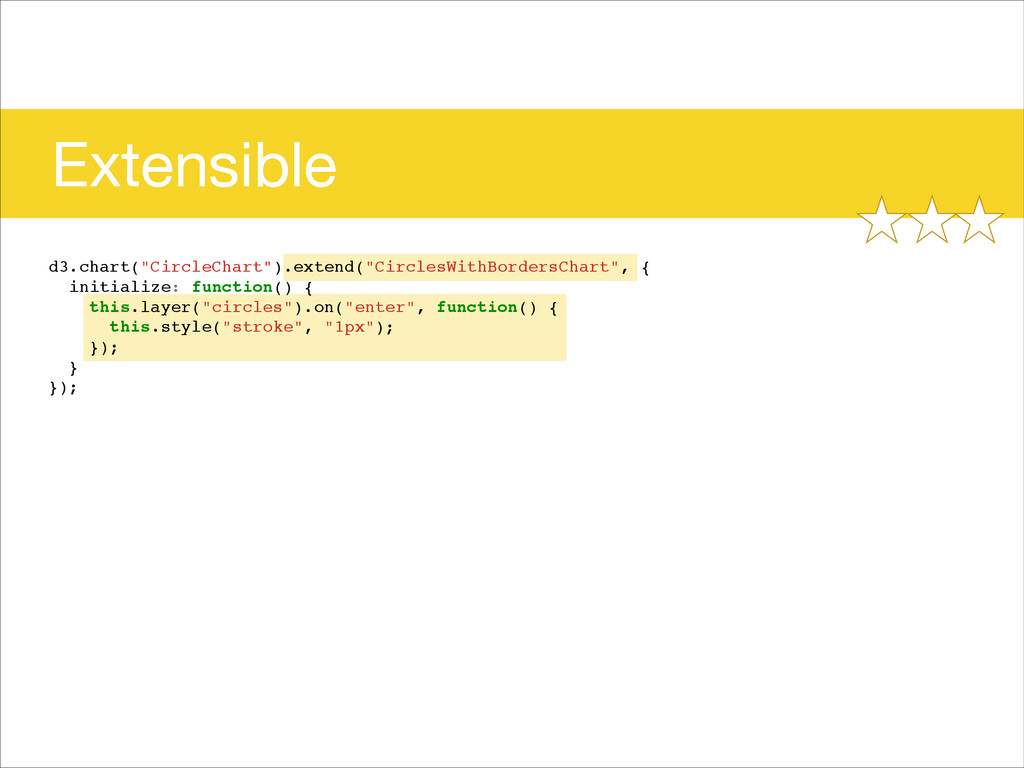
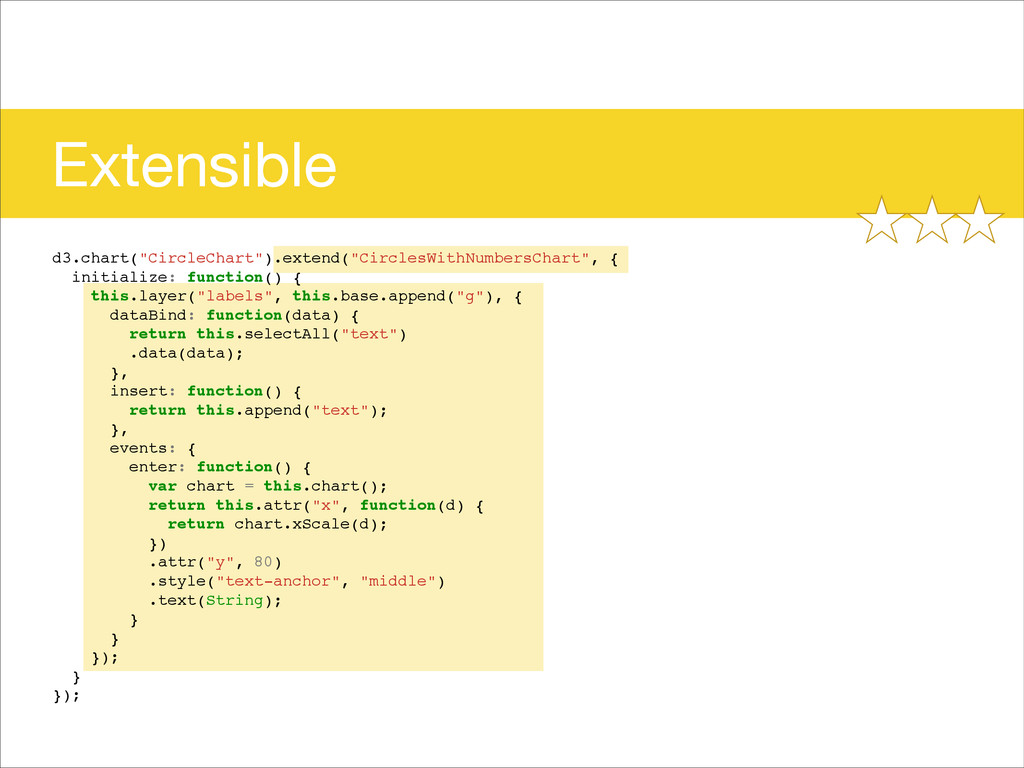
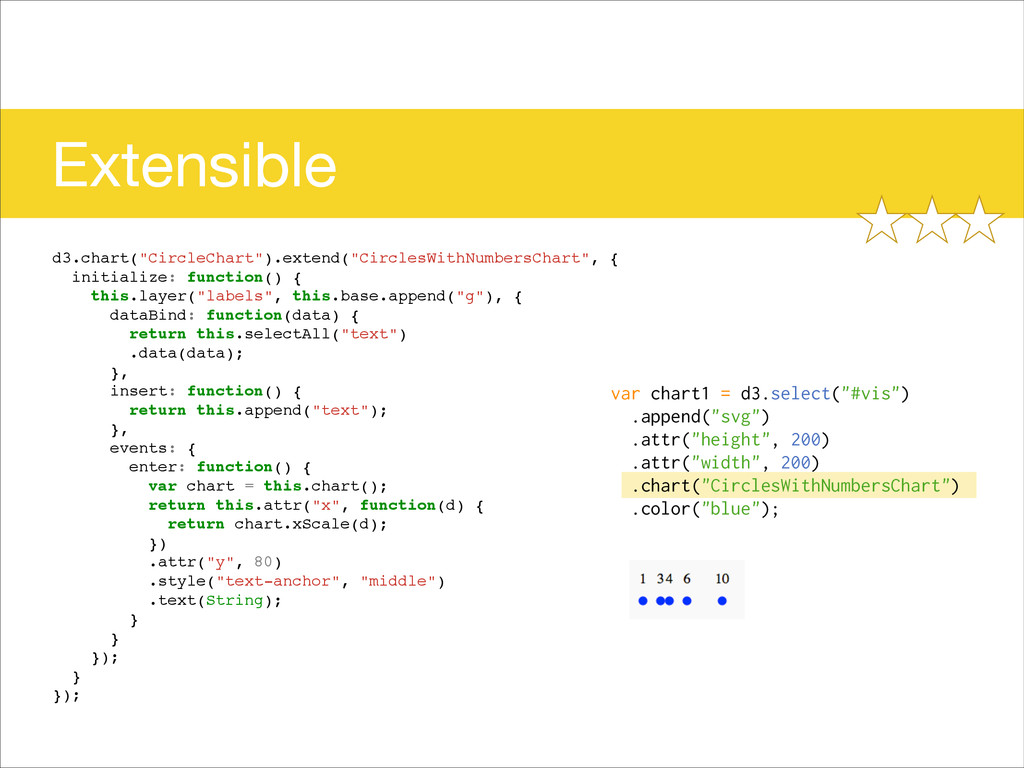
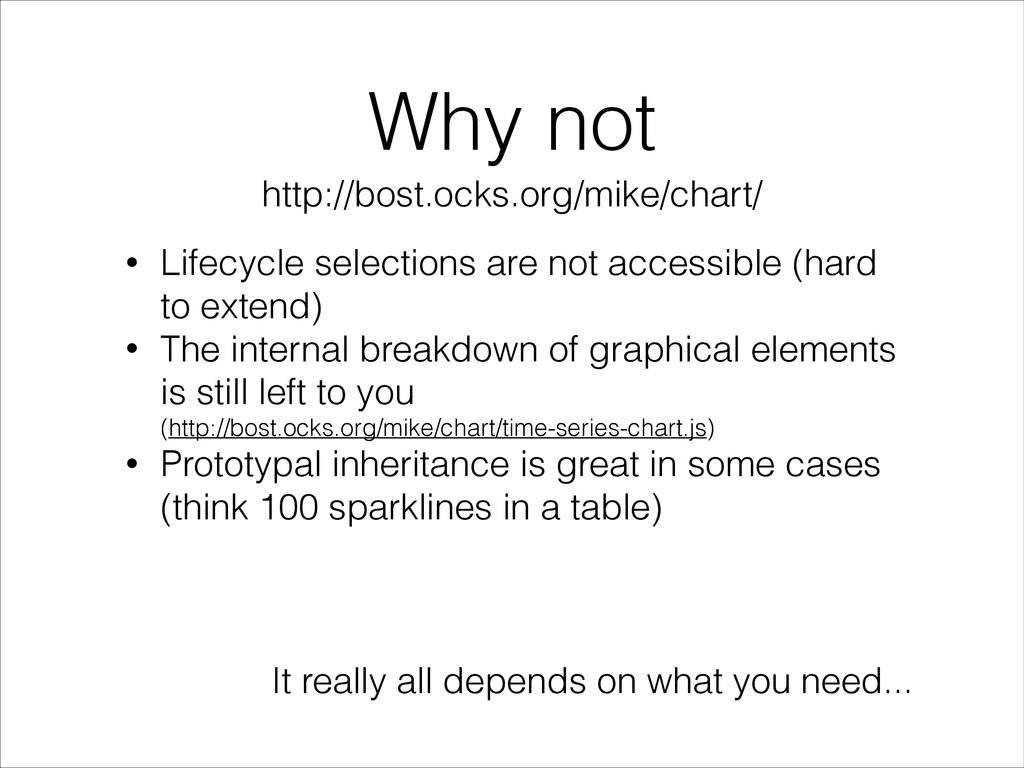
    to extend) • The internal breakdown of graphical elements is still left to you 
 (http://bost.ocks.org/mike/chart/time-series-chart.js) • Prototypal inheritance is great in some cases (think 100 sparklines in a table) It really all depends on what you need...
  35. http://jsperf.com/prototypal-vis-fn function chart() {! var width = 720, // default

    width! height = 80; // default height! ! function my() {! // generate chart here, using `width` and `height`! }! ! my.width = function(value) {! if (!arguments.length) return width;! width = value;! return my;! };! ! my.height = function(value) {! if (!arguments.length) return height;! height = value;! return my;! };! ! return my;! }! function chart2() {! this.width = 720;! this.height = 80;! }! ! chart2.prototype.width = function(value) {! if (!arguments.length) return this.width;! this.width = value;! return this;! };! ! chart2.prototype.height = function(value) {! if (!arguments.length) return this.height;! this.height = value;! return this;! };! Prototypal Inheritance vs ! Closures w getter-setter methods http://jsperf.com/closure-versus-prototypal-pattern-deathmatch http://es5.github.io/#x4.2.1
  36. Where we're at... • Some charts published 
 (http://misoproject.com/d3-chart/charts.html) •

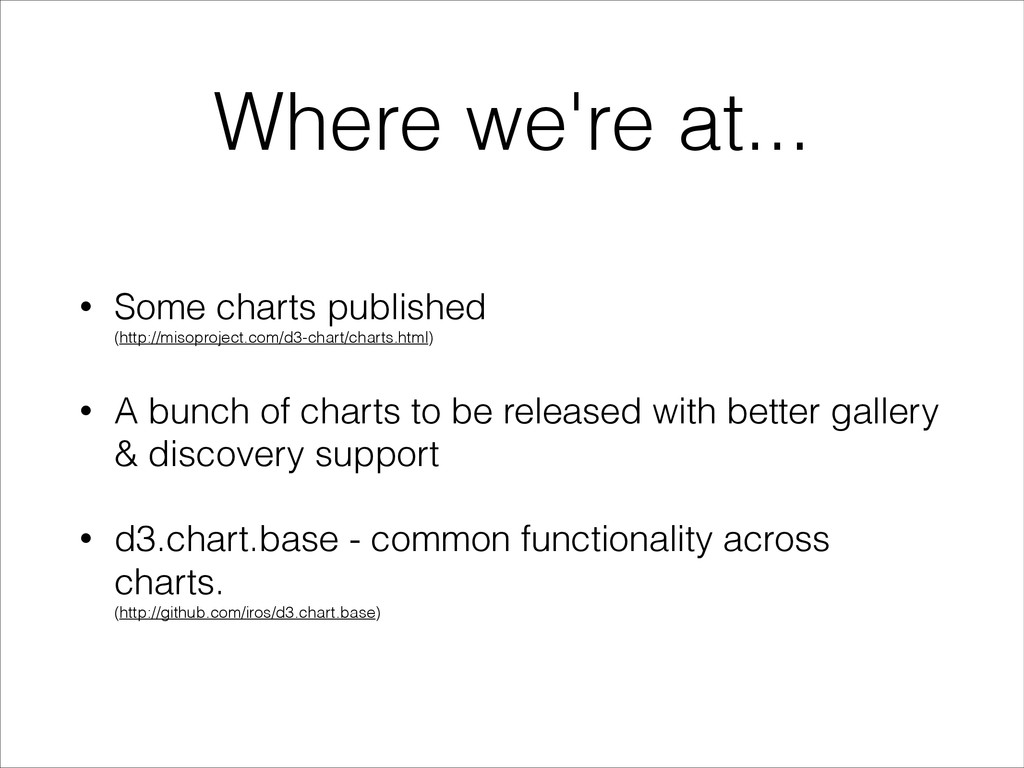
    A bunch of charts to be released with better gallery & discovery support • d3.chart.base - common functionality across charts.
 (http://github.com/iros/d3.chart.base)
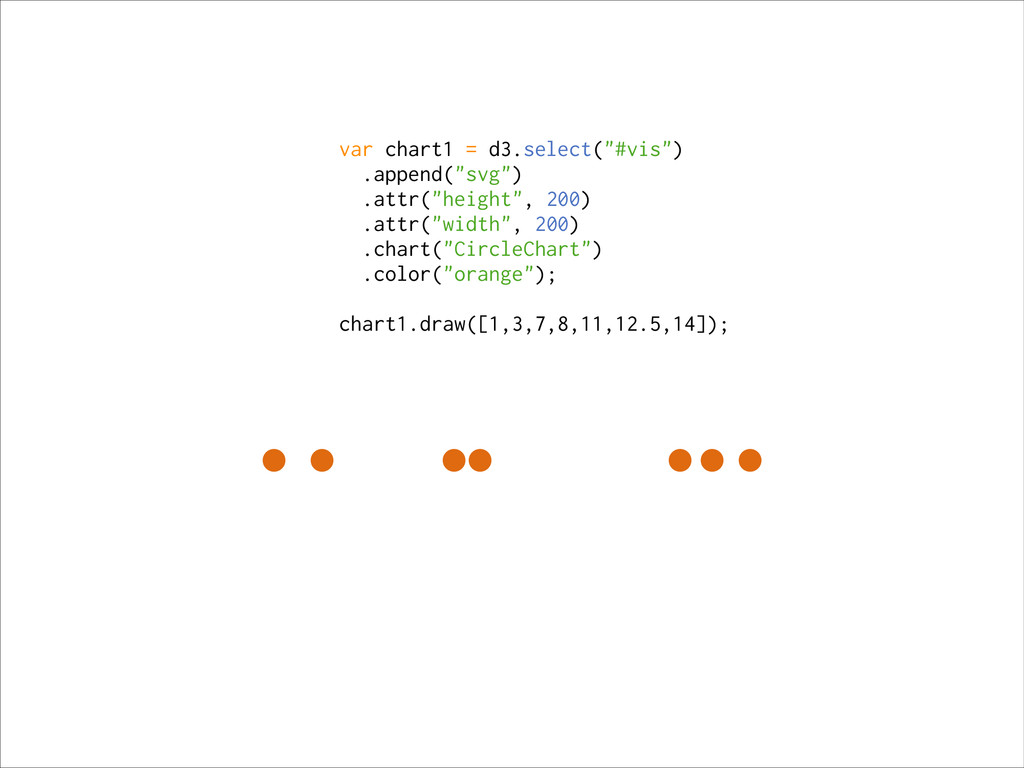