From Hadoop+Strata San Jose, 2016:
Description:
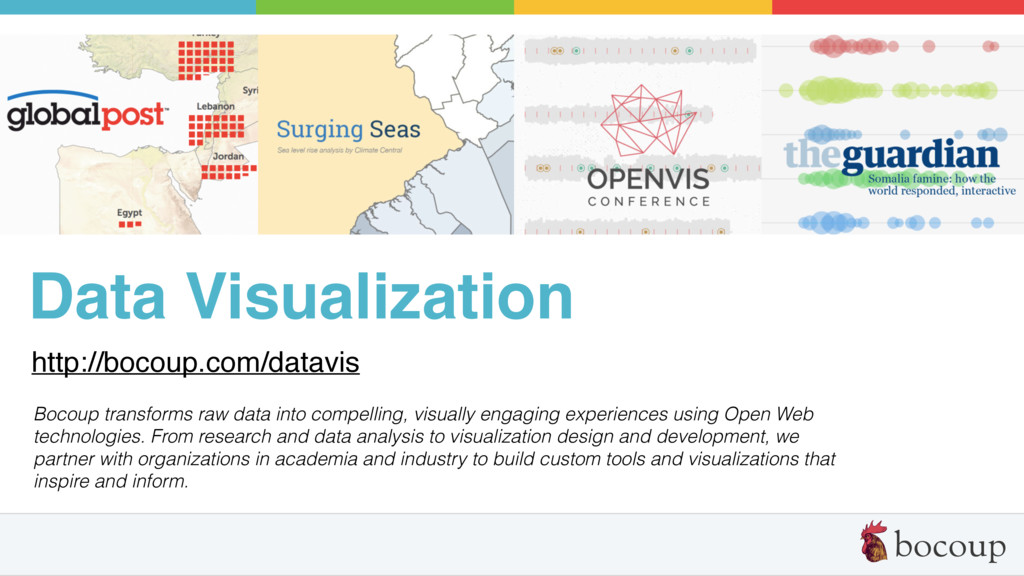
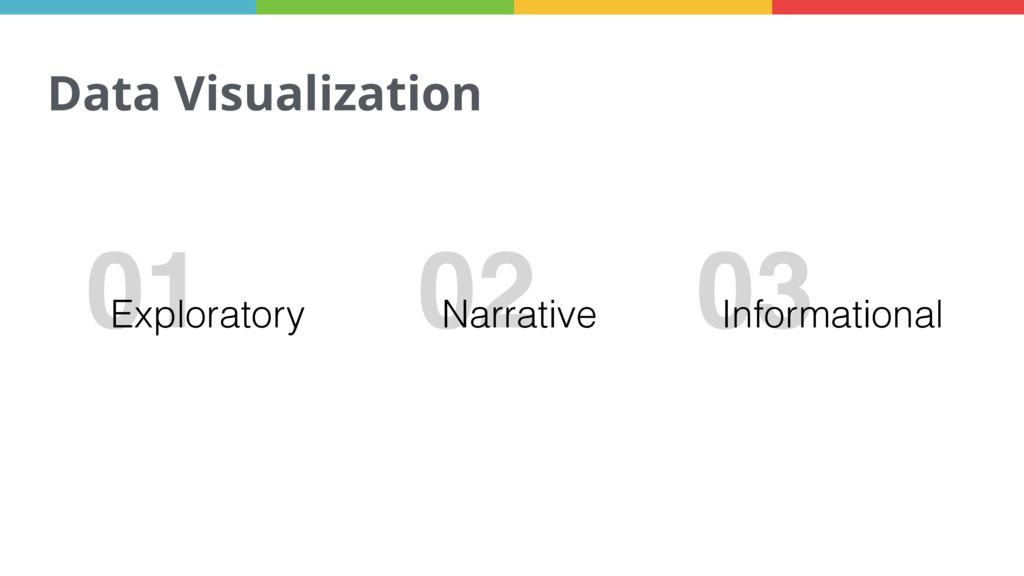
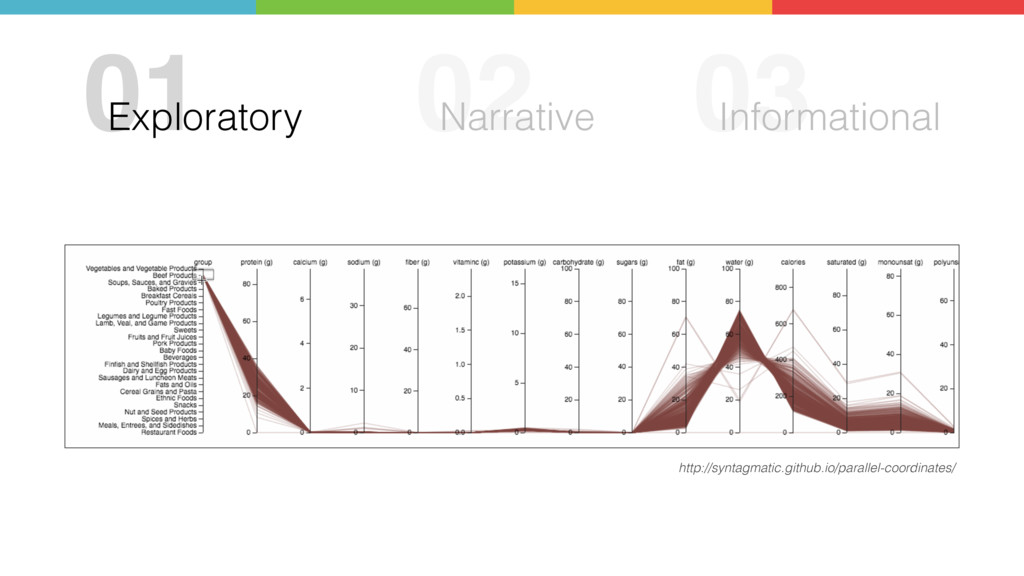
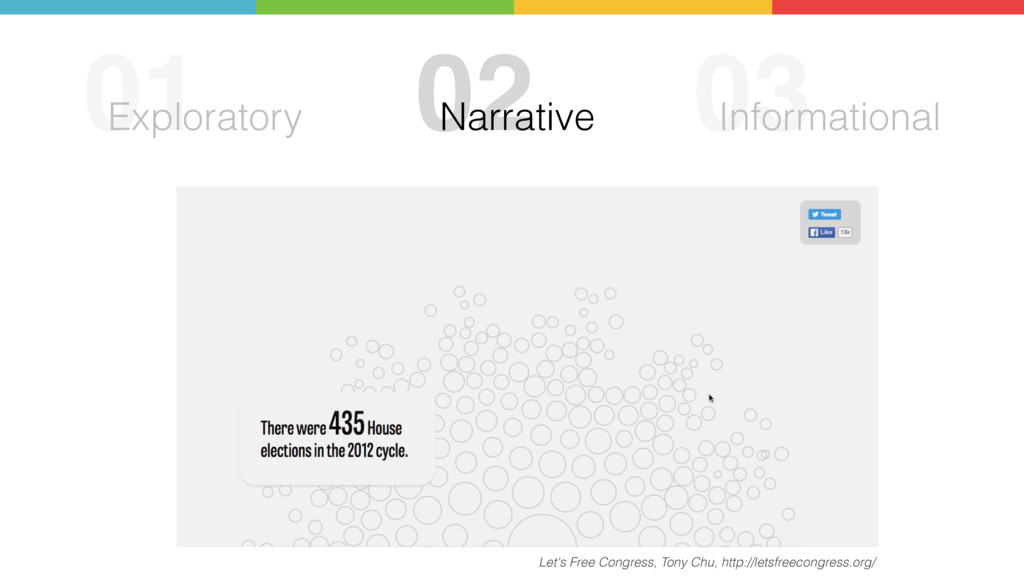
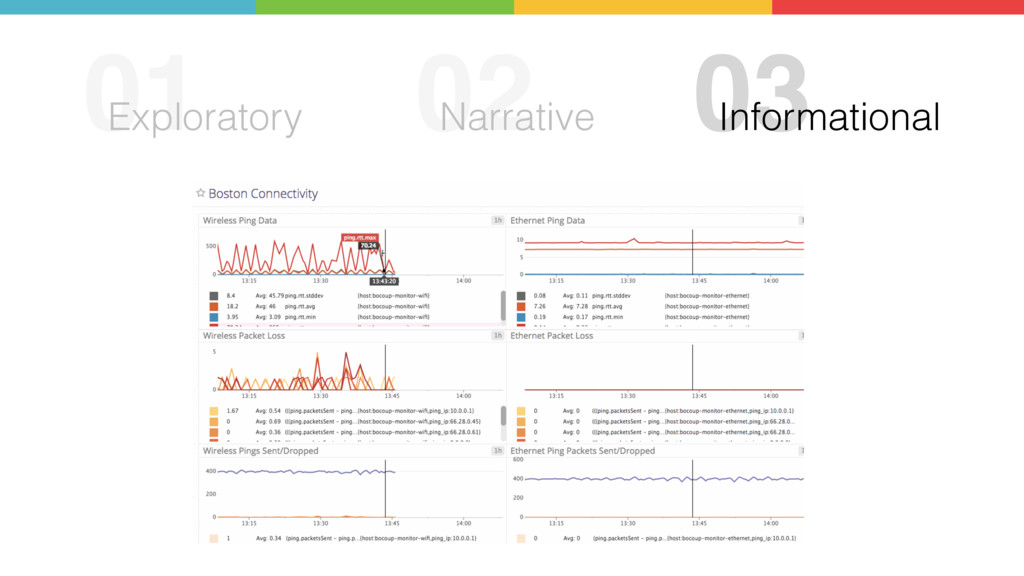
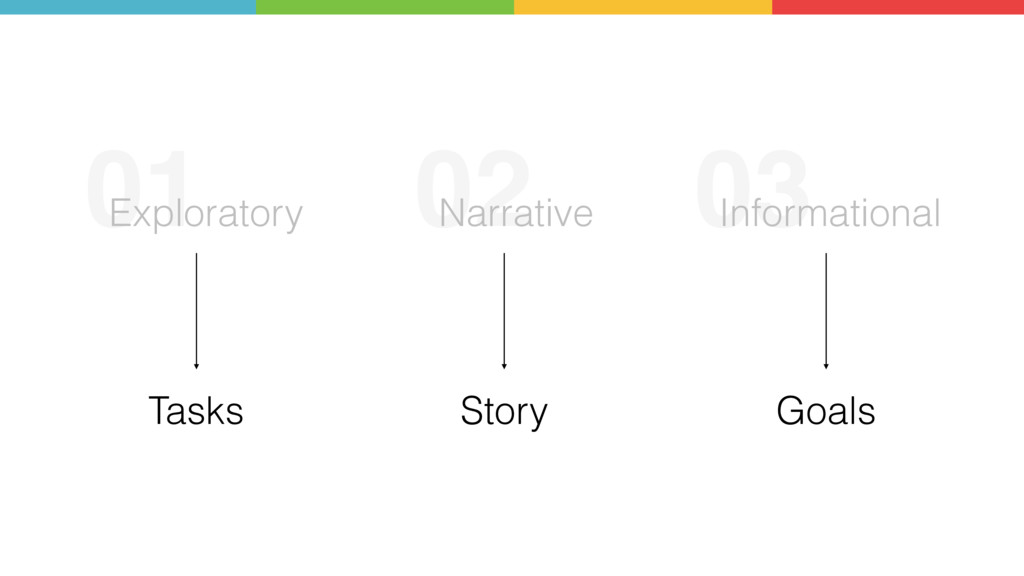
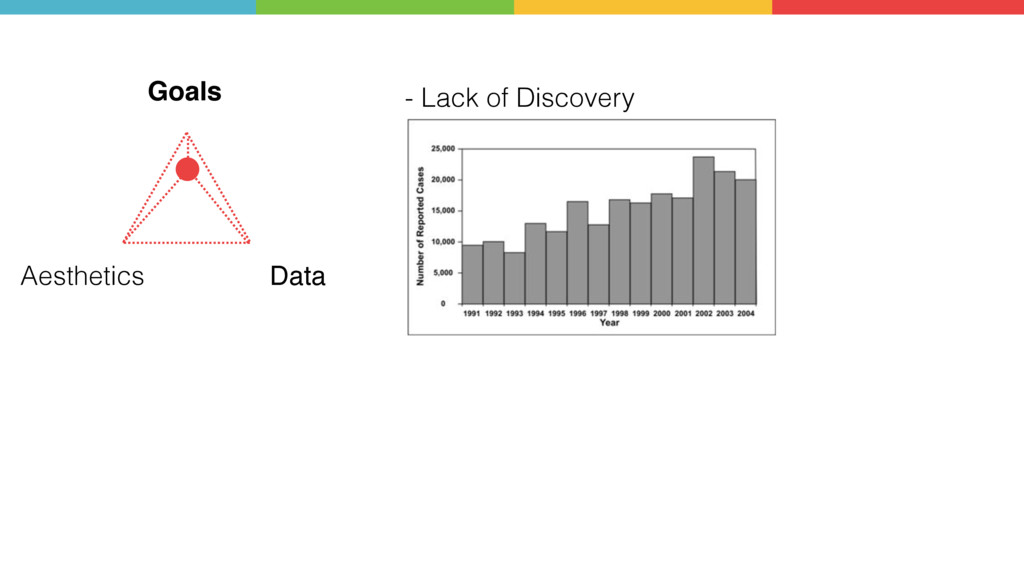
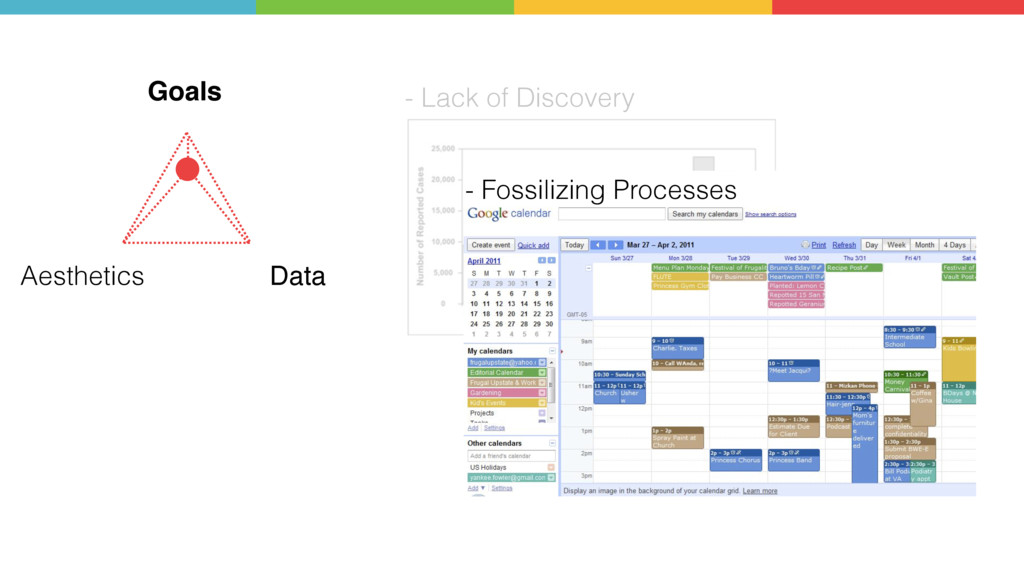
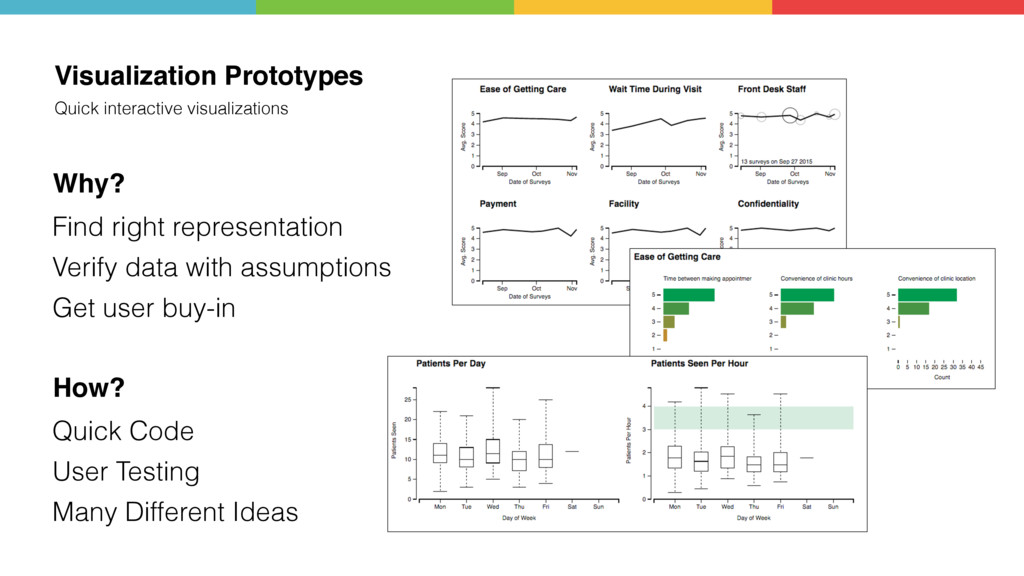
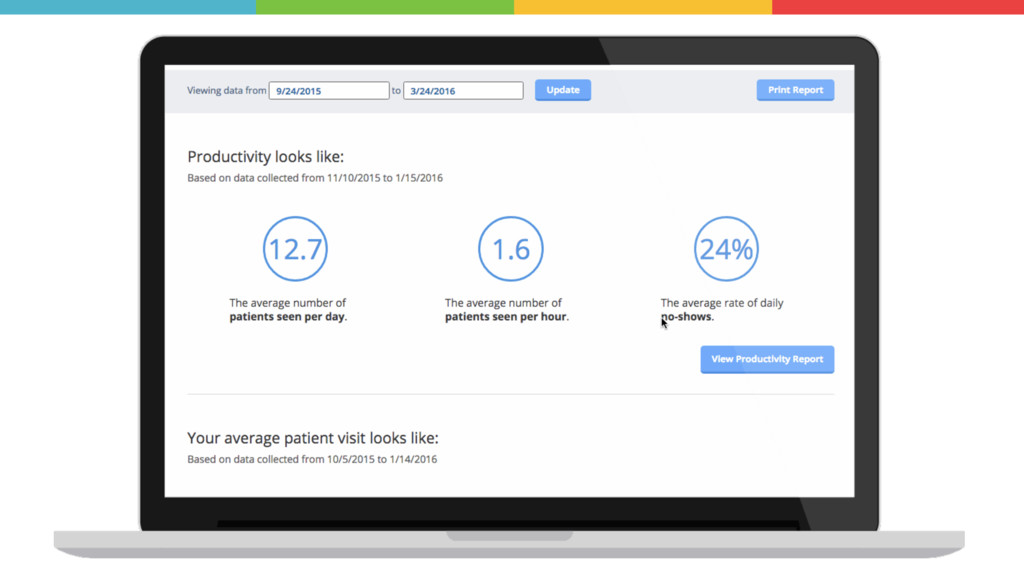
These days, there are many ways to visualize data, from representations of complex analyses to quick and simple charts and graphs produced in tools like Excel. Often, data visualization is meant only for analytical or narrative purposes, in which case traditional process models generally work. However, more and more, consumers expect to interact with the data, not just consume it. Interactive data visualization is becoming more prevalent on the Web—from communicating meaningful data to consumers or clients to creating exploratory interfaces that must be powerful enough—but not too complex—to engage people through data-driven content.
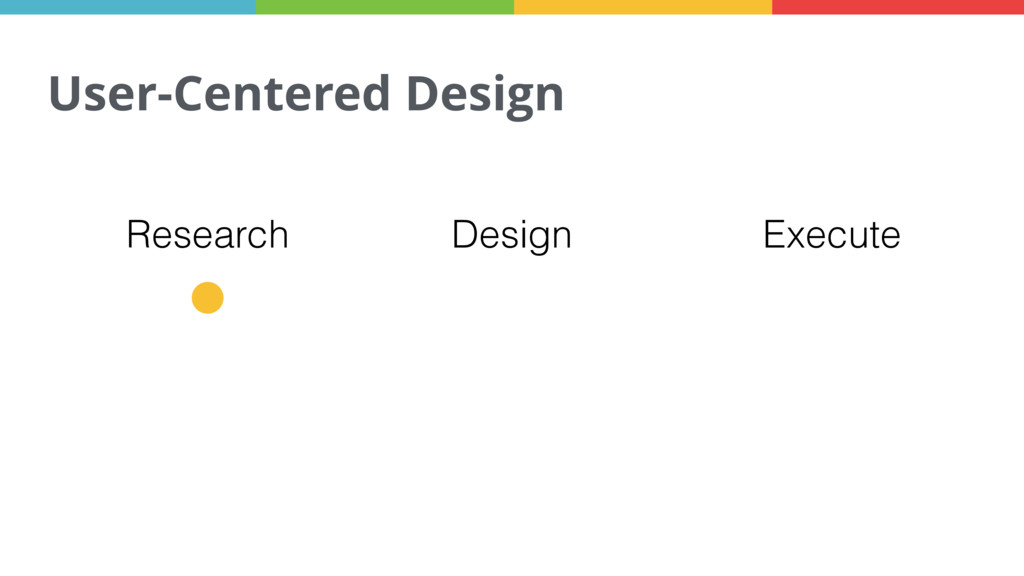
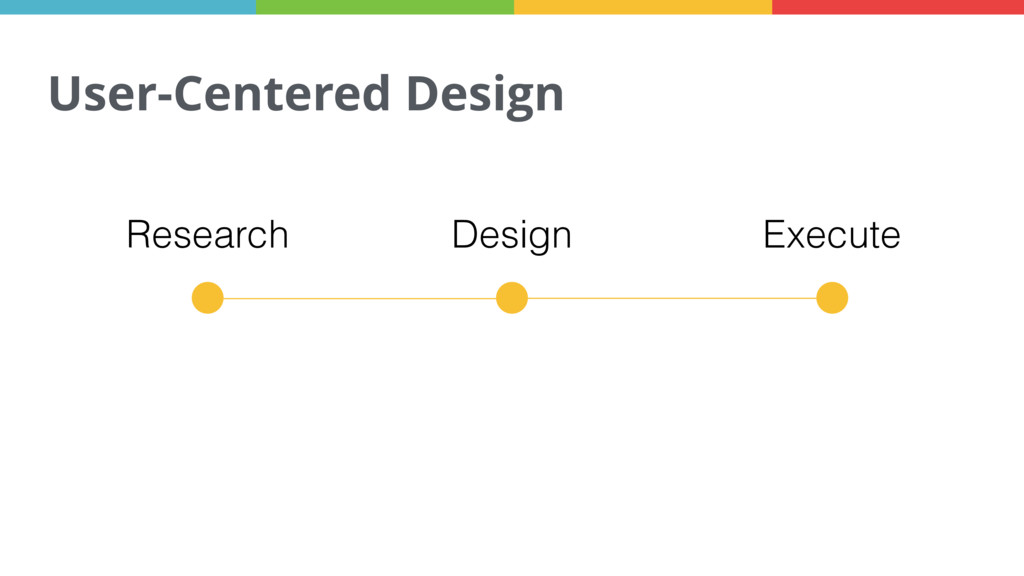
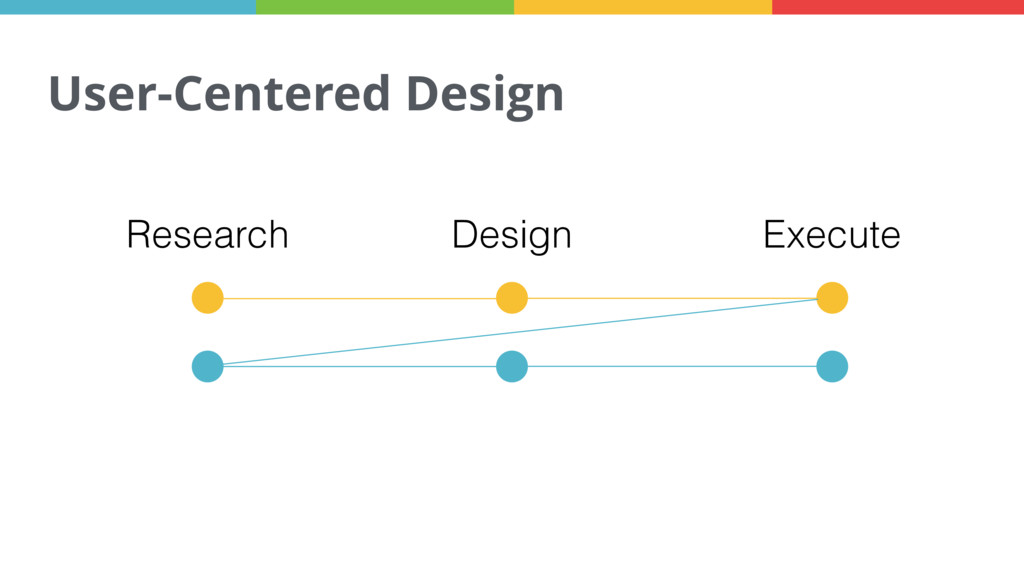
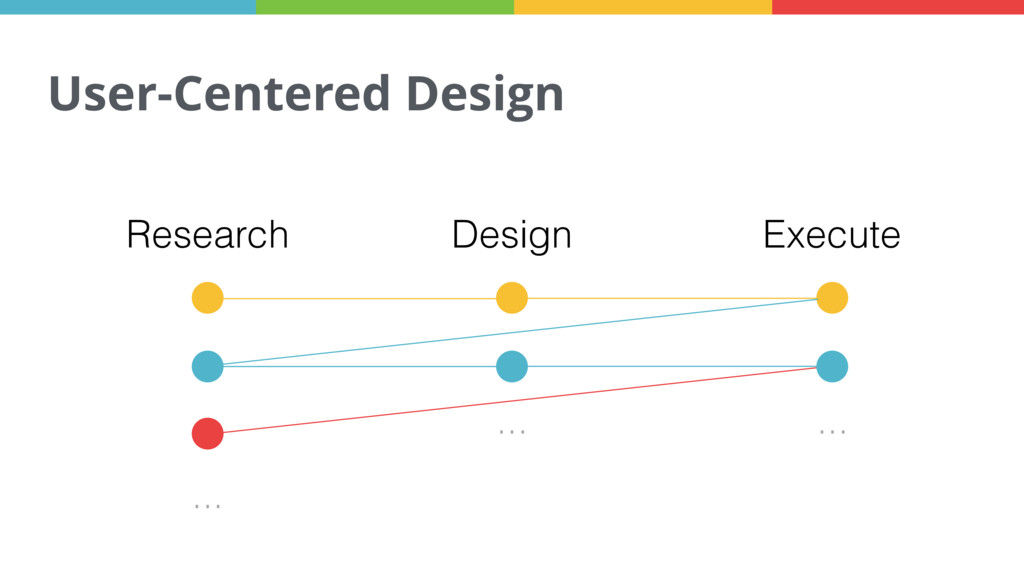
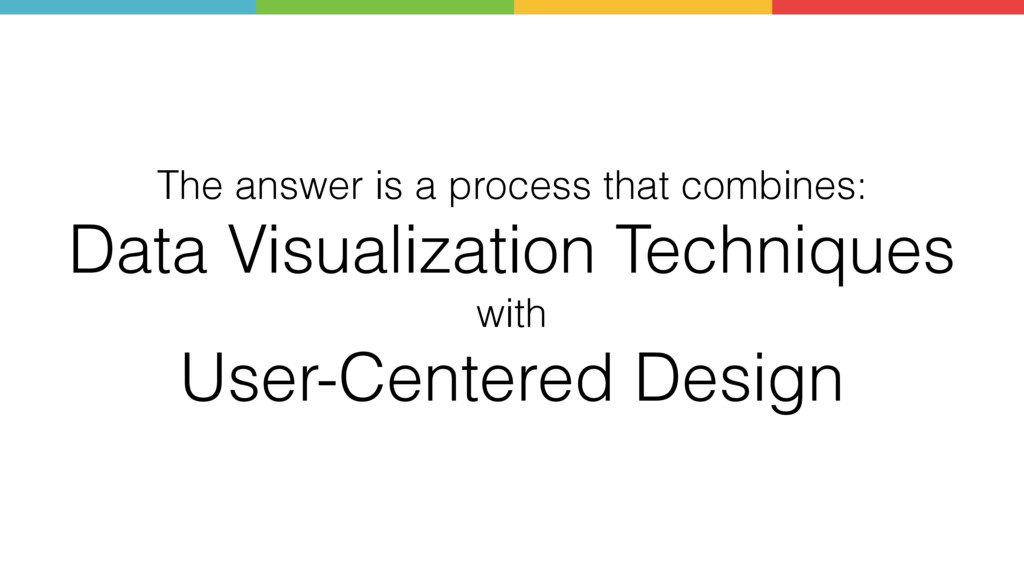
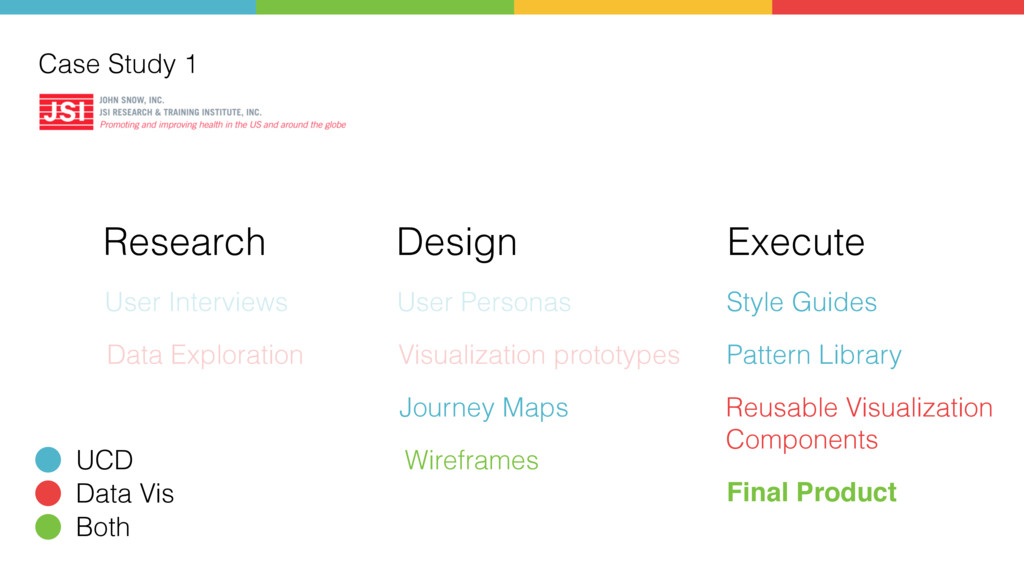
User-centered design (UCD) offers useful strategies for creating and implementing these more complex interactive data visualizations. Irene Ros explains how to apply UCD methodologies to data visualization—creating more meaningful data visualizations by designing systems and interfaces from a user’s perspective.
Topics include:
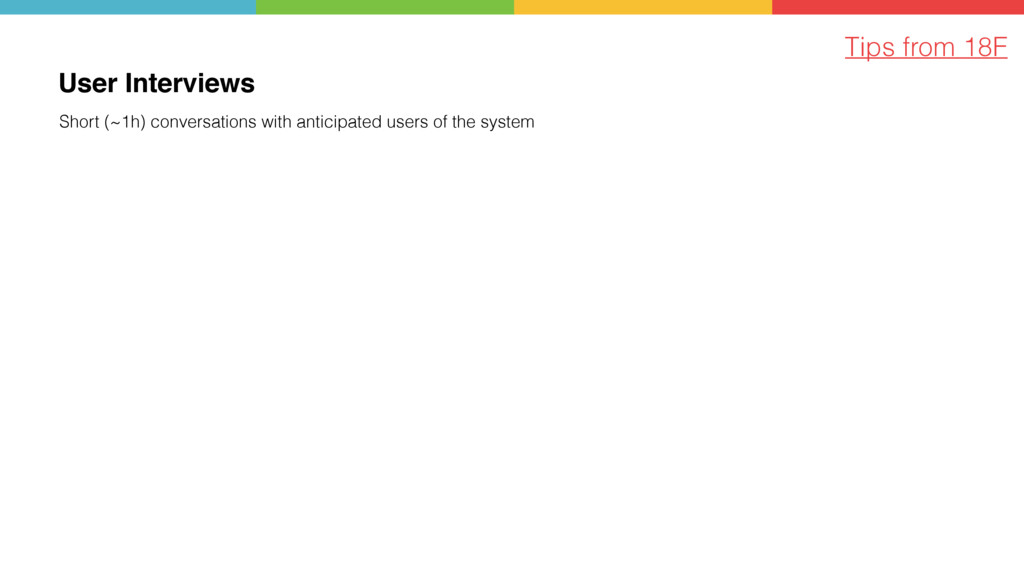
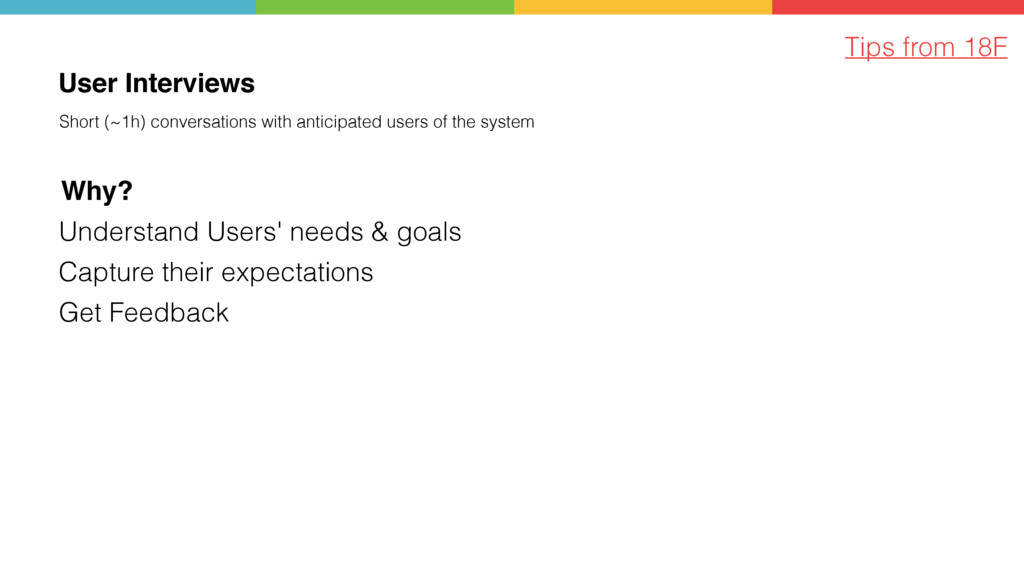
Relevant methods and exercises from UCD
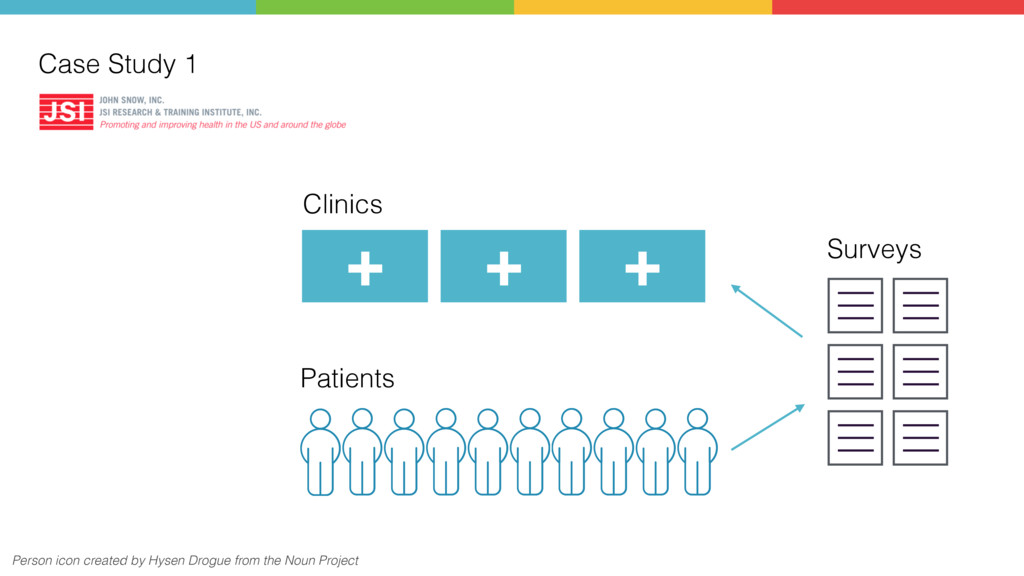
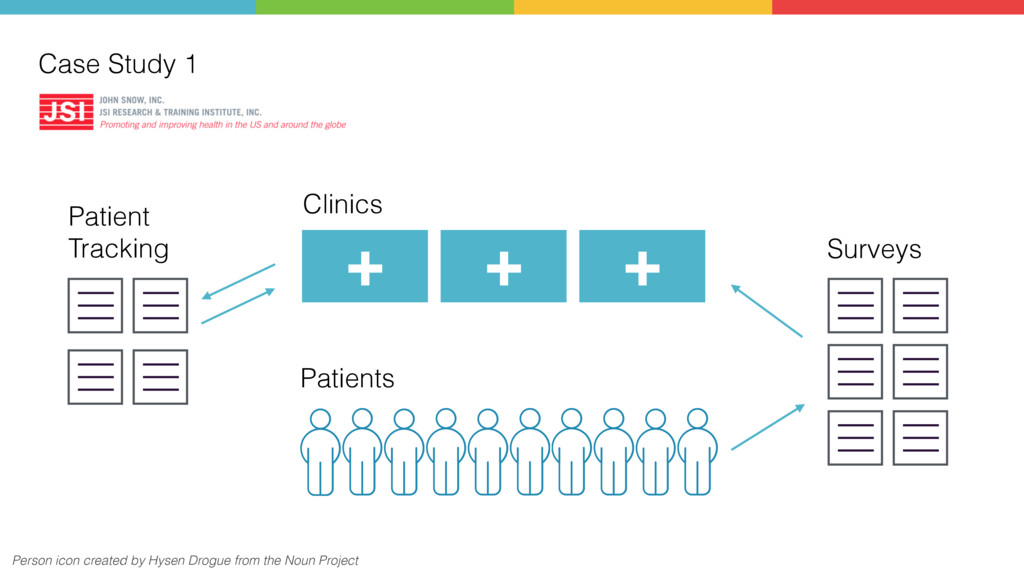
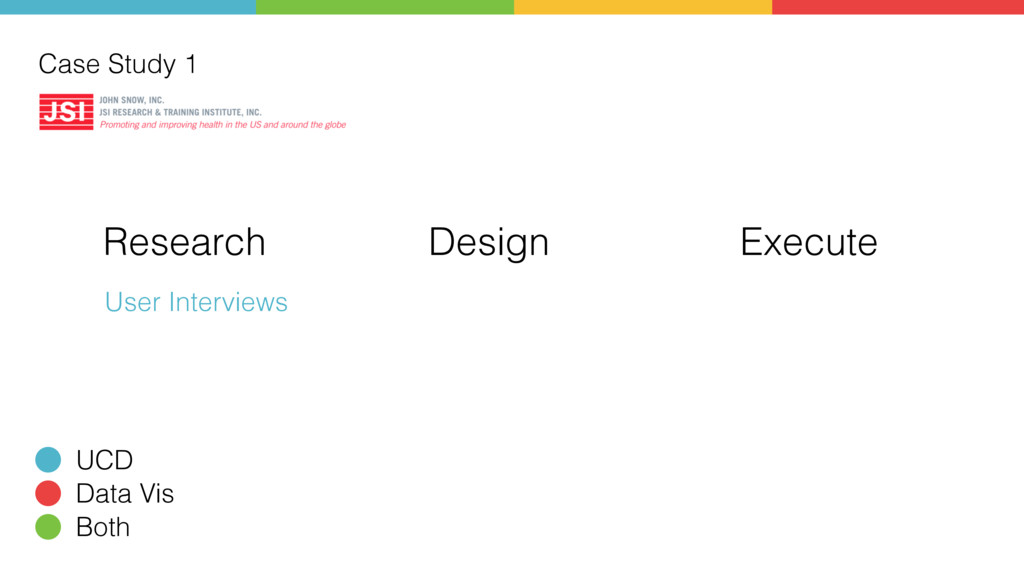
Examples of how these methods can be applied to different types of visualization tools and where in the process they should come in
How the existing processes behind creating data visualizations can enhance the UCD process (such as using preliminary analysis to inform user studies)
![Who I am Irene Ros [email protected] @ireneros | @bocoup http://bocoup.com/DataVis](https://files.speakerdeck.com/presentations/c288019a0fe243009966b8ecd7f977f6/slide_1.jpg)
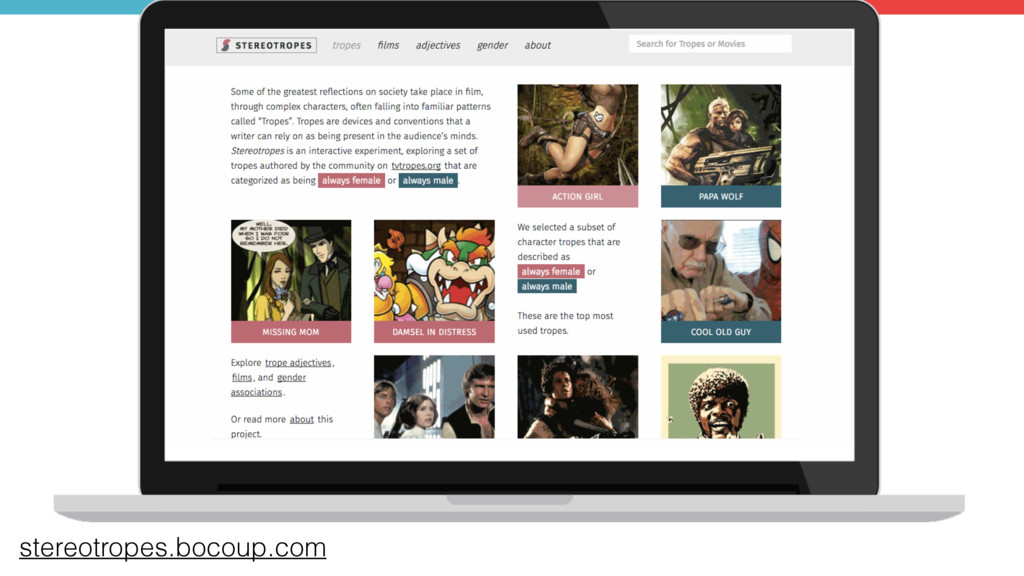
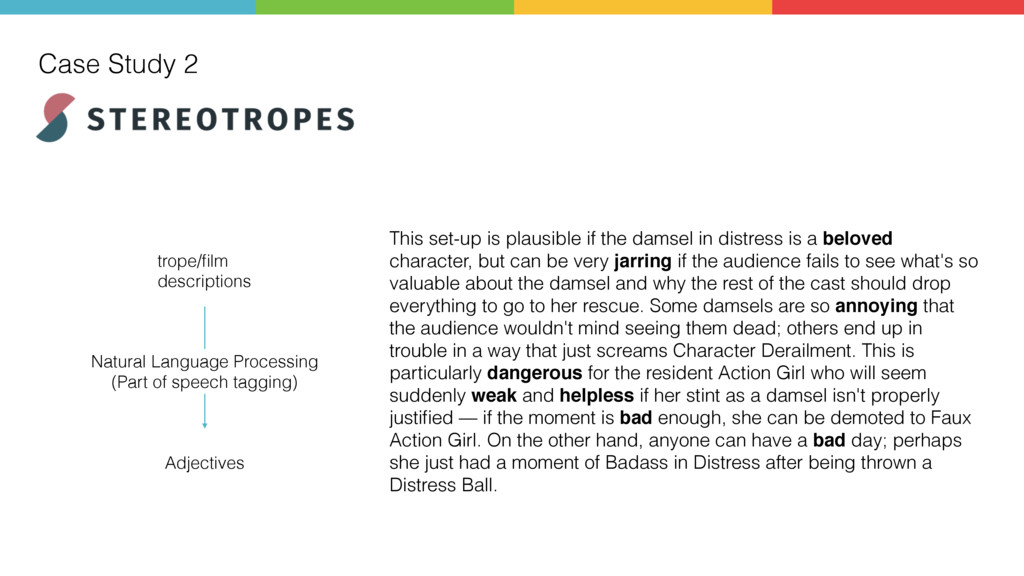
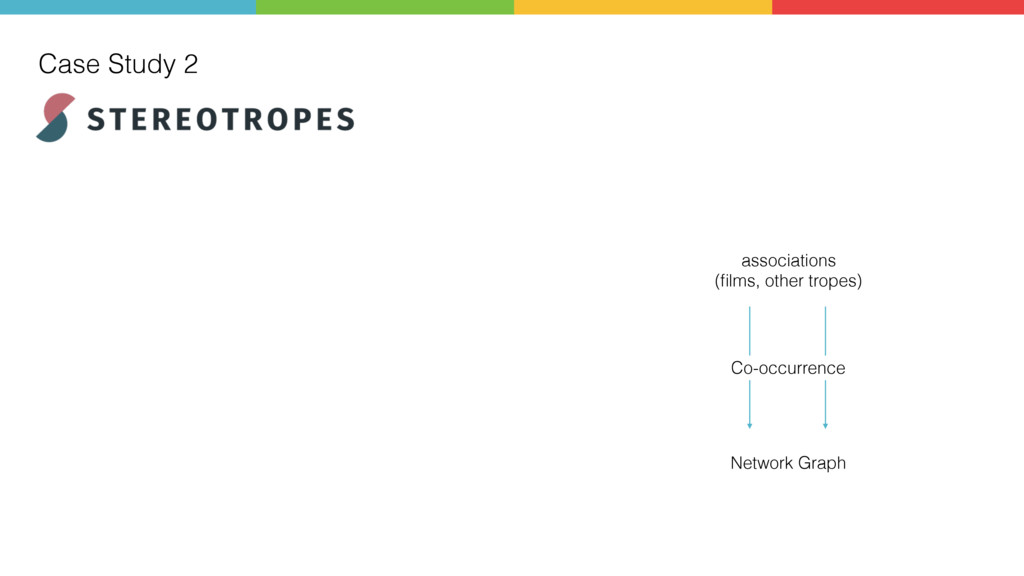
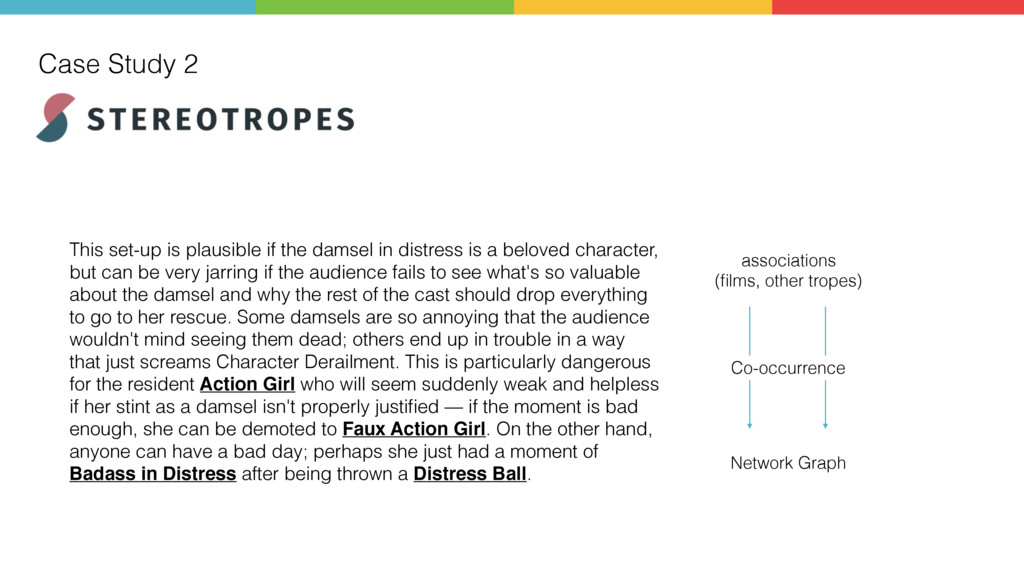
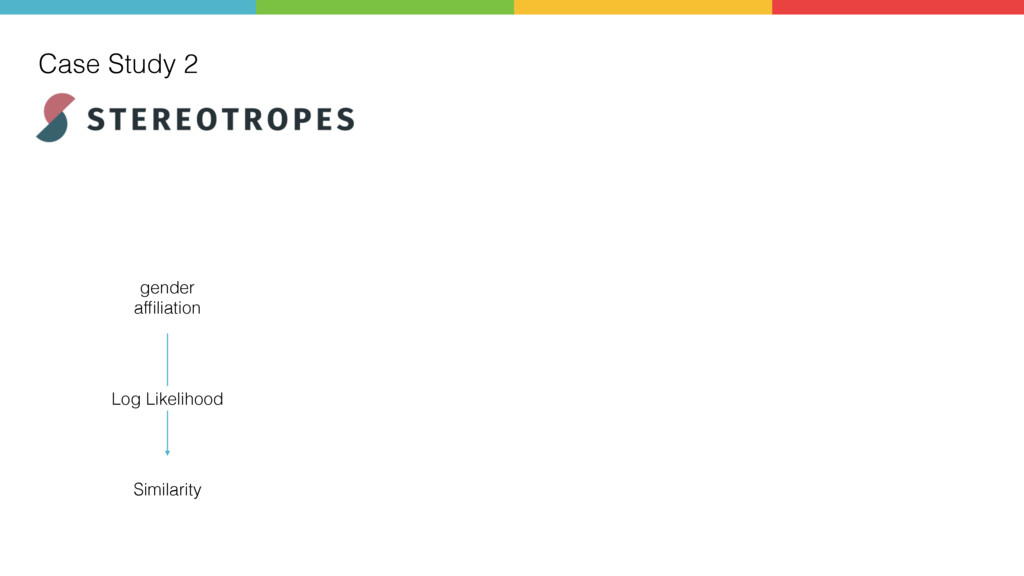
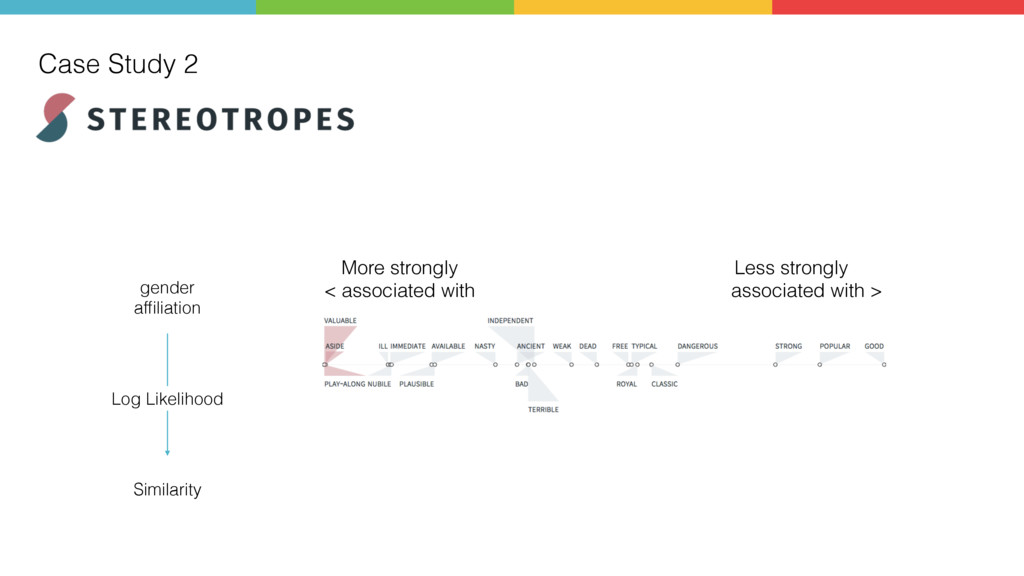
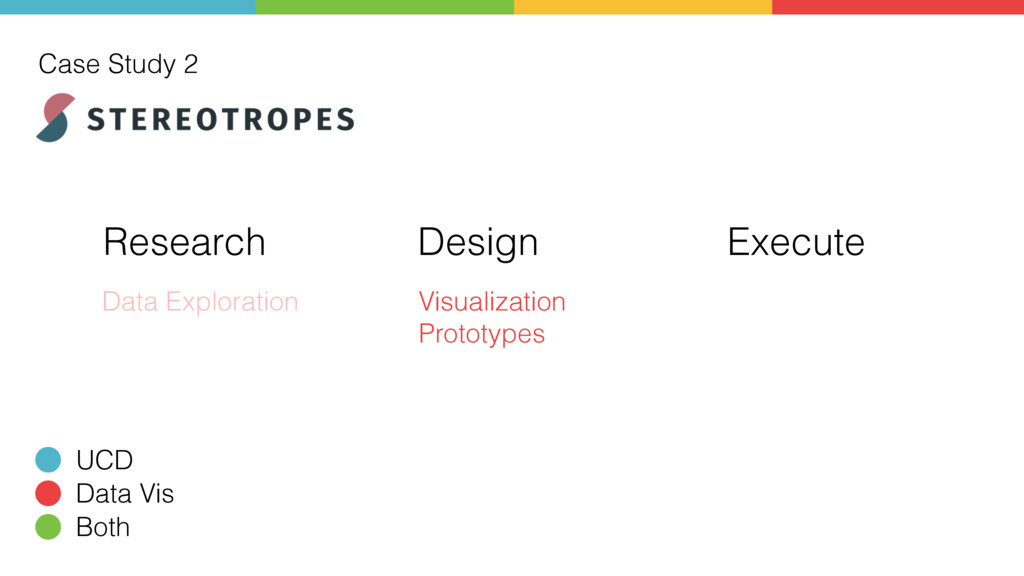
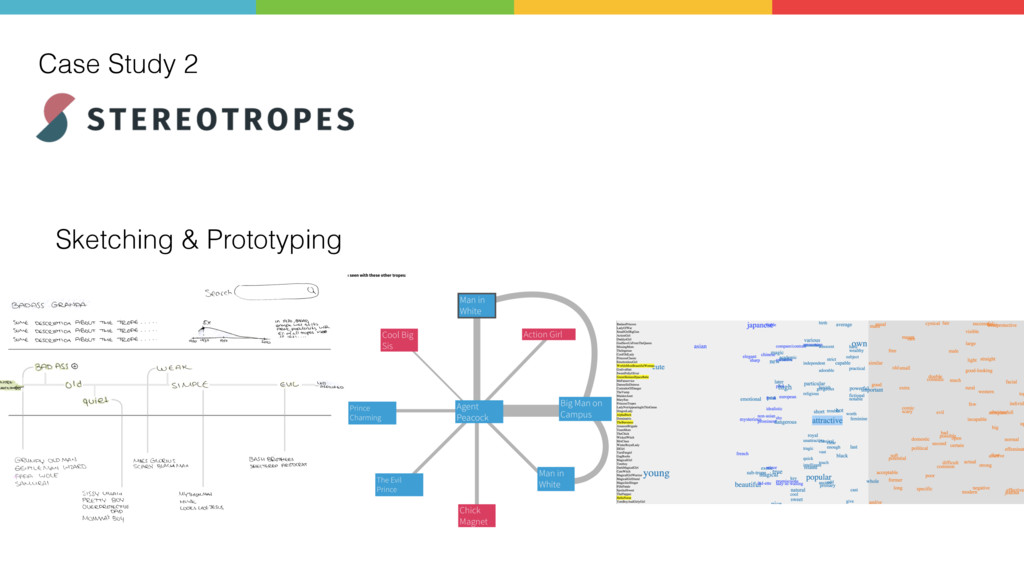
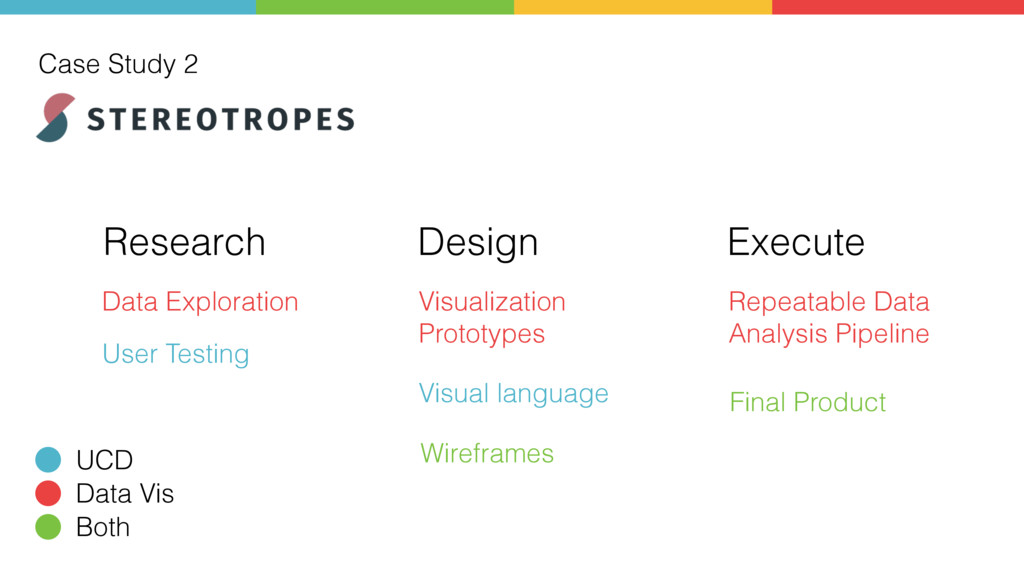
![Exploratory Visualizations [12] Stereotropes Design Case Study 2](https://files.speakerdeck.com/presentations/c288019a0fe243009966b8ecd7f977f6/slide_83.jpg)
![Exploratory Visualizations [12] Stereotropes Design Case Study 2](https://files.speakerdeck.com/presentations/c288019a0fe243009966b8ecd7f977f6/slide_84.jpg)
![Thanks! Irene Ros [email protected] @ireneros | @bocoup http://bocoup.com/DataVis](https://files.speakerdeck.com/presentations/c288019a0fe243009966b8ecd7f977f6/slide_94.jpg)