Upgrade to Pro — share decks privately, control downloads, hide ads and more …

Grace Hopper 2013

Irene Ros
October 03, 2013

Grace Hopper 2013

Irene Ros

October 03, 2013
Tweet

More Decks by Irene Ros

Other Decks in Technology

Transcript

  1. Keeping the YouTube Generation Engaged with Rich Media, Visualization &

    Animation Irene Ros @ireneros Bocoup | @bocoup http://bocoup.com Wednesday, October 2, 13
  2. Grace Hopper Conference 2013 | Irene Ros | Bocoup Data

    Structured Unstructured Wednesday, October 2, 13
  3. Grace Hopper Conference 2013 | Irene Ros | Bocoup Visual

    Forms Shapes Colors Sizes + Data Structured Unstructured Wednesday, October 2, 13
  4. Grace Hopper Conference 2013 | Irene Ros | Bocoup Visual

    Forms Shapes Colors Sizes + Data Structured Unstructured Narrative Structure + Interaction Wednesday, October 2, 13
  5. Grace Hopper Conference 2013 | Irene Ros | Bocoup Category

    Q1 Q2 Coats 30,000 40,000 Pants 400,000 500,000 Unstructured Information Structured Information Wednesday, October 2, 13
  6. Grace Hopper Conference 2013 | Irene Ros | Bocoup What

    is data visualization? Yes, but... Wednesday, October 2, 13
  7. Grace Hopper Conference 2013 | Irene Ros | Bocoup Visual

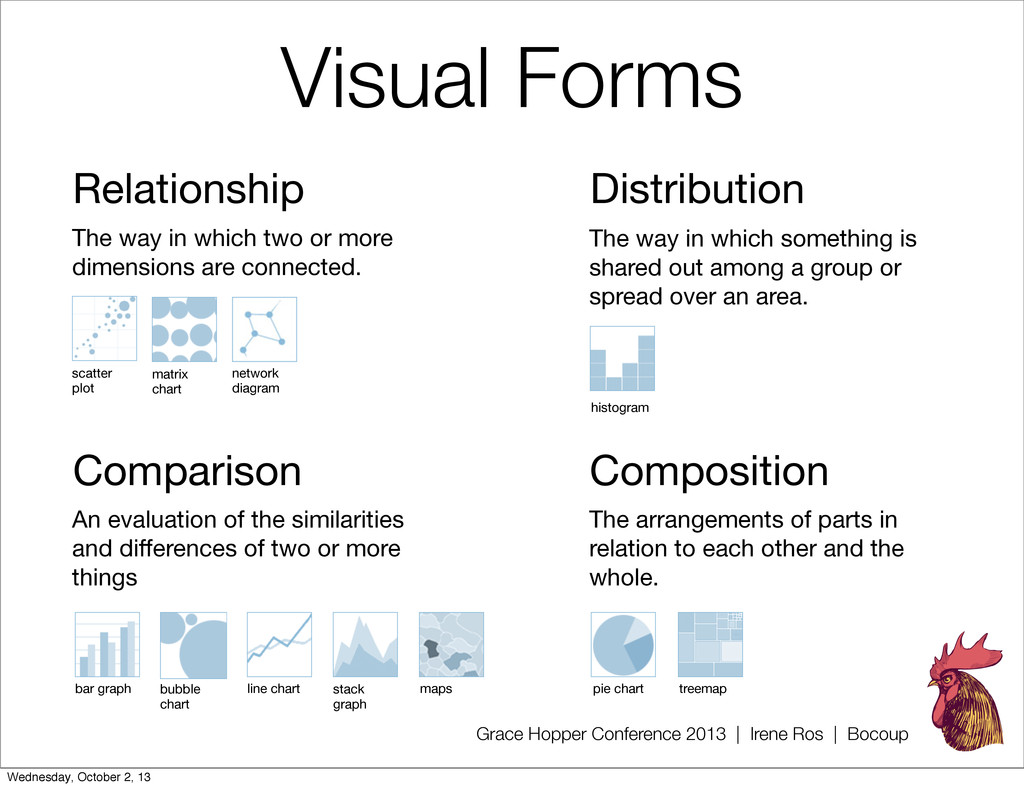
    Forms Relationship The way in which two or more dimensions are connected. scatter plot matrix chart network diagram Distribution The way in which something is shared out among a group or spread over an area. histogram Comparison An evaluation of the similarities and differences of two or more things bar graph line chart stack graph maps bubble chart Composition The arrangements of parts in relation to each other and the whole. pie chart treemap Wednesday, October 2, 13
  8. Grace Hopper Conference 2013 | Irene Ros | Bocoup What

    is data visualization? Wednesday, October 2, 13
  9. Grace Hopper Conference 2013 | Irene Ros | Bocoup 1.

    Magazine Style ‣single frame ‣written narrative ‣often one or two figures ‣usually static Wednesday, October 2, 13
  10. E. Cadora and L. Kurgan. Architecture and Justice (Brooklyn Crime

    Blocks). Columbia University’s Spatial Information Design Lab, 2006. http://www.spatialinformationdesignlab.org/MEDIA/PDF_04.pdf Grace Hopper Conference 2013 | Irene Ros | Bocoup Wednesday, October 2, 13
  11. Grace Hopper Conference 2013 | Irene Ros | Bocoup 2.

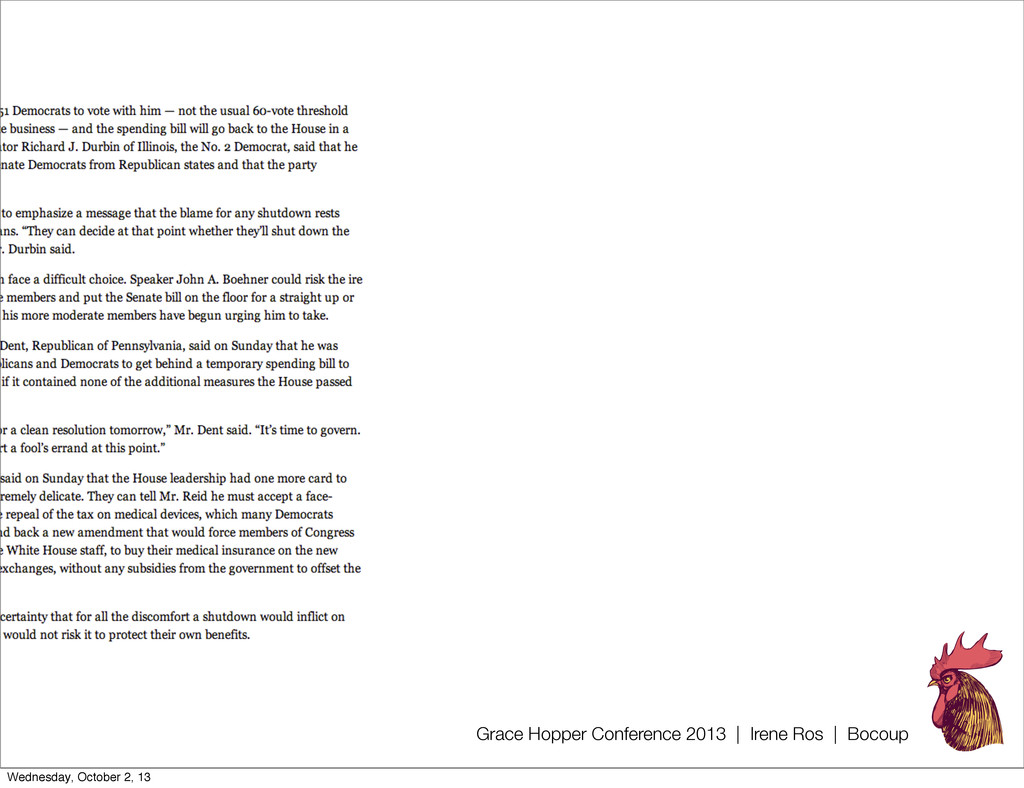
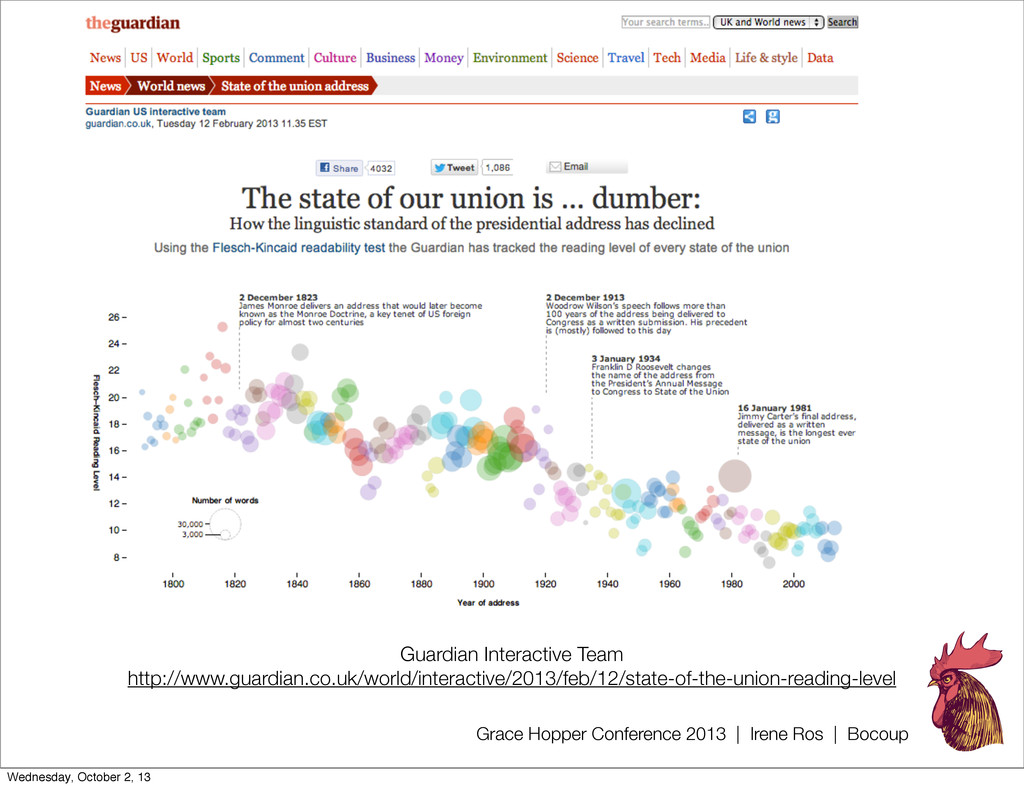
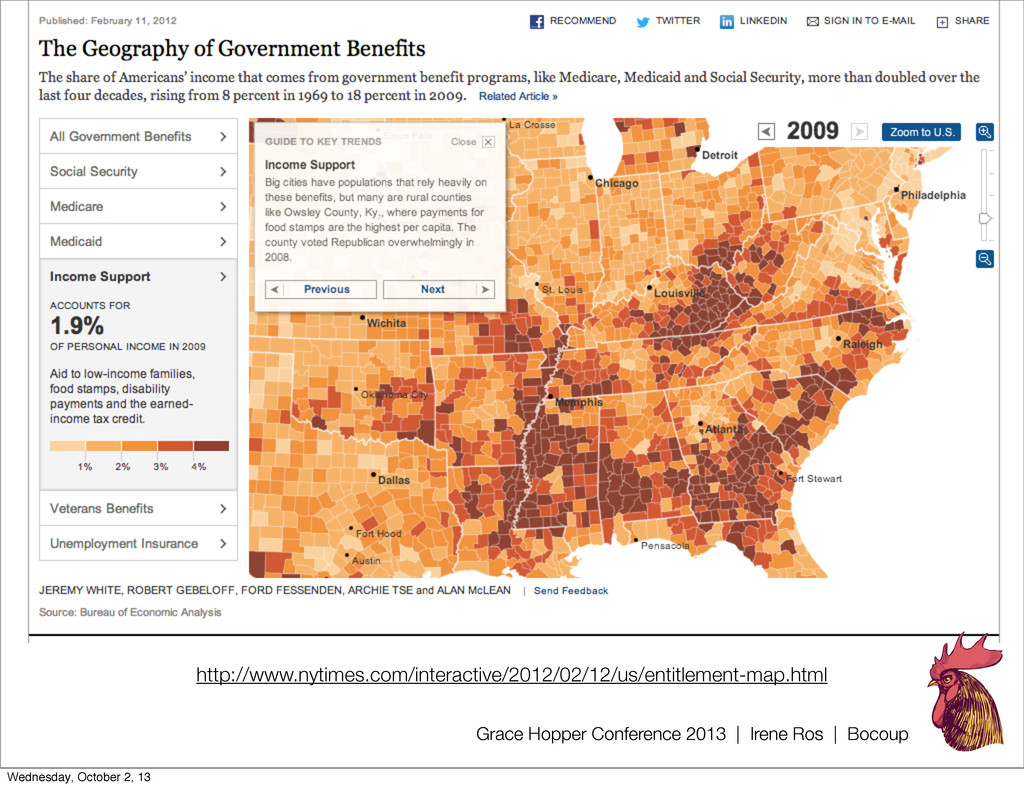
    Annotated Chart ‣Usually single chart ‣Some data points highlighted ‣textual explanation for those points ‣occasionally remainder interactive too Wednesday, October 2, 13
  12. Grace Hopper Conference 2013 | Irene Ros | Bocoup 3.

    Flow Chart (infographics) ‣Guided story ‣Broken down into steps ‣Has one or more possible paths Wednesday, October 2, 13
  13. Grace Hopper Conference 2013 | Irene Ros | Bocoup 4.

    Slide Show ‣Simple guided experience ‣Usually single linear path ‣Next/Previous buttons ‣Each slide builds on the previous Wednesday, October 2, 13
  14. Irene Ros [email protected] @ireneros | iros on github Open Source

    Data Visualization Fellowship Program Job Opportunities @bocoup | http://bocoup.com Wednesday, October 2, 13