mins The presentation begins at 8:00 am CEO Introduction – 15 mins The Good Stuff – 60 mins • Products & Technology • Solutions & use-cases • Customers • Partners What’s Next? – 15 mins Visit Validation Lab Agenda
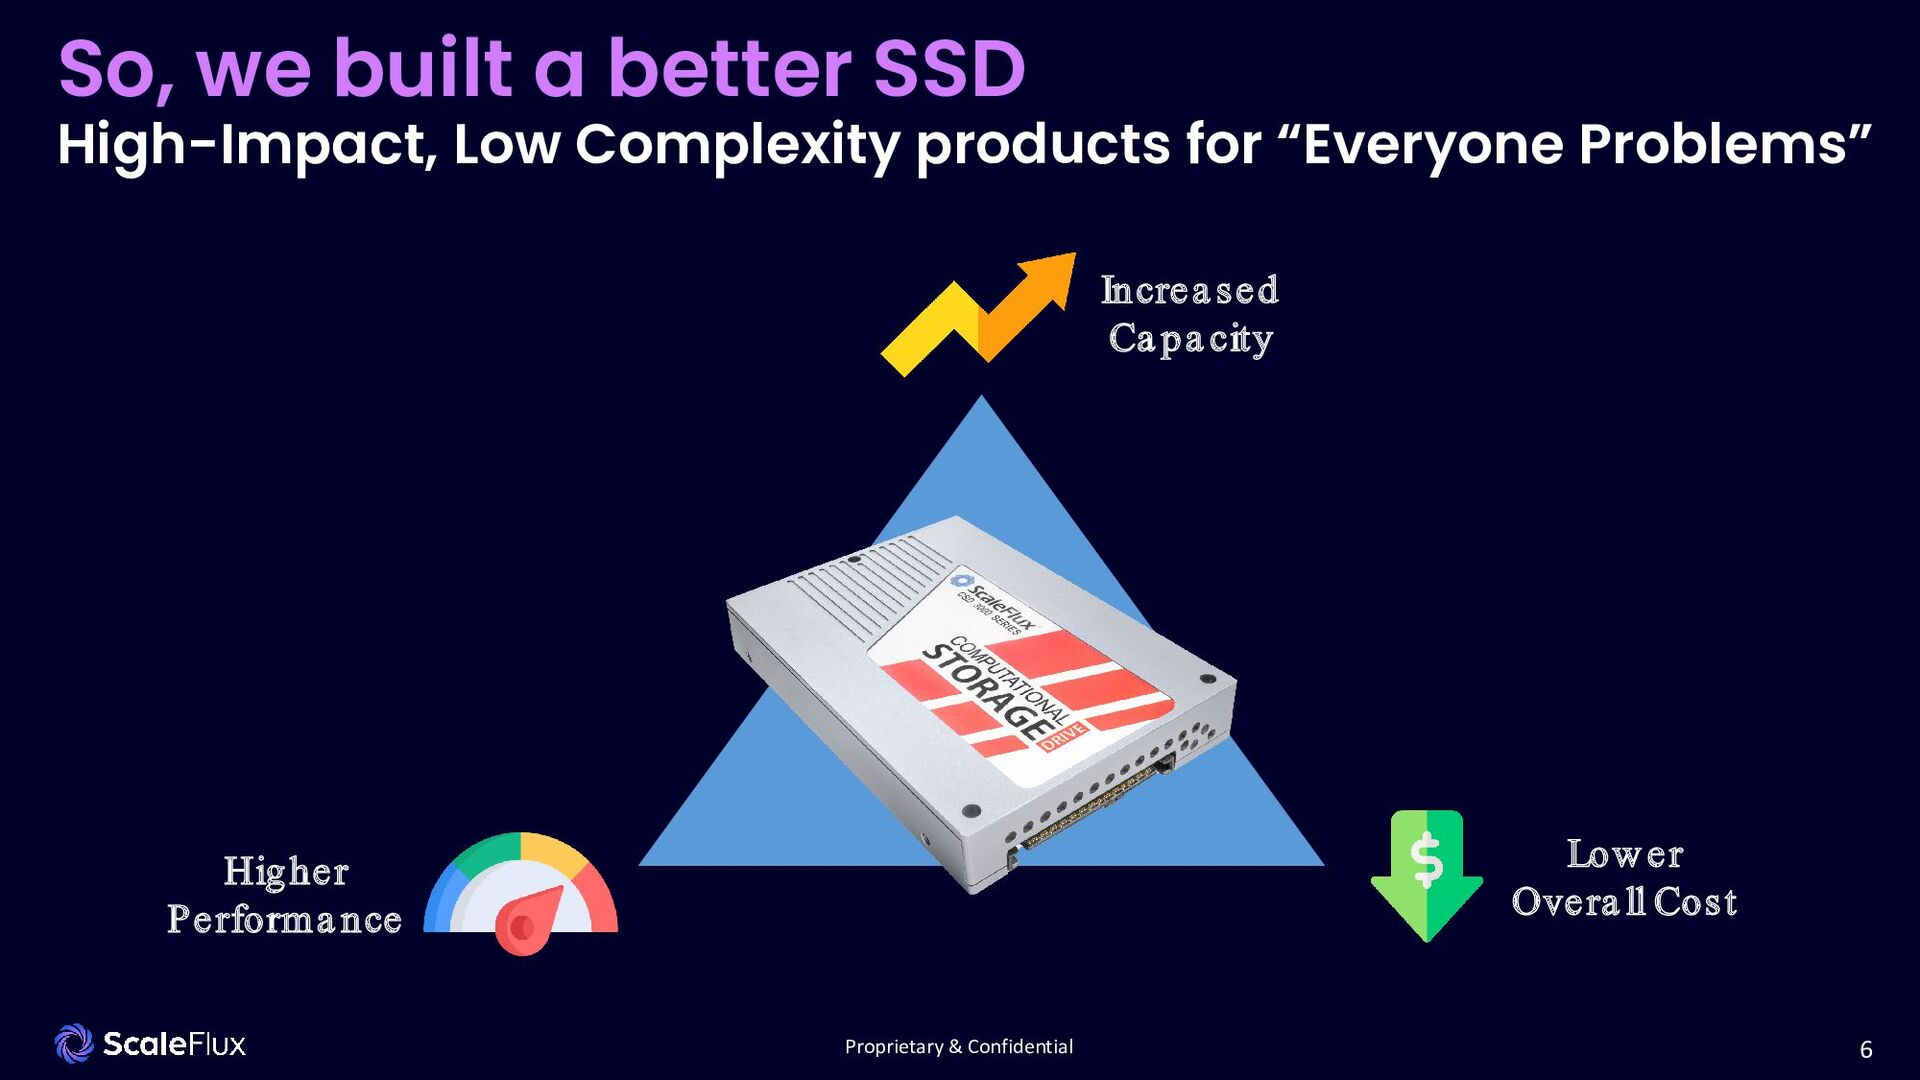
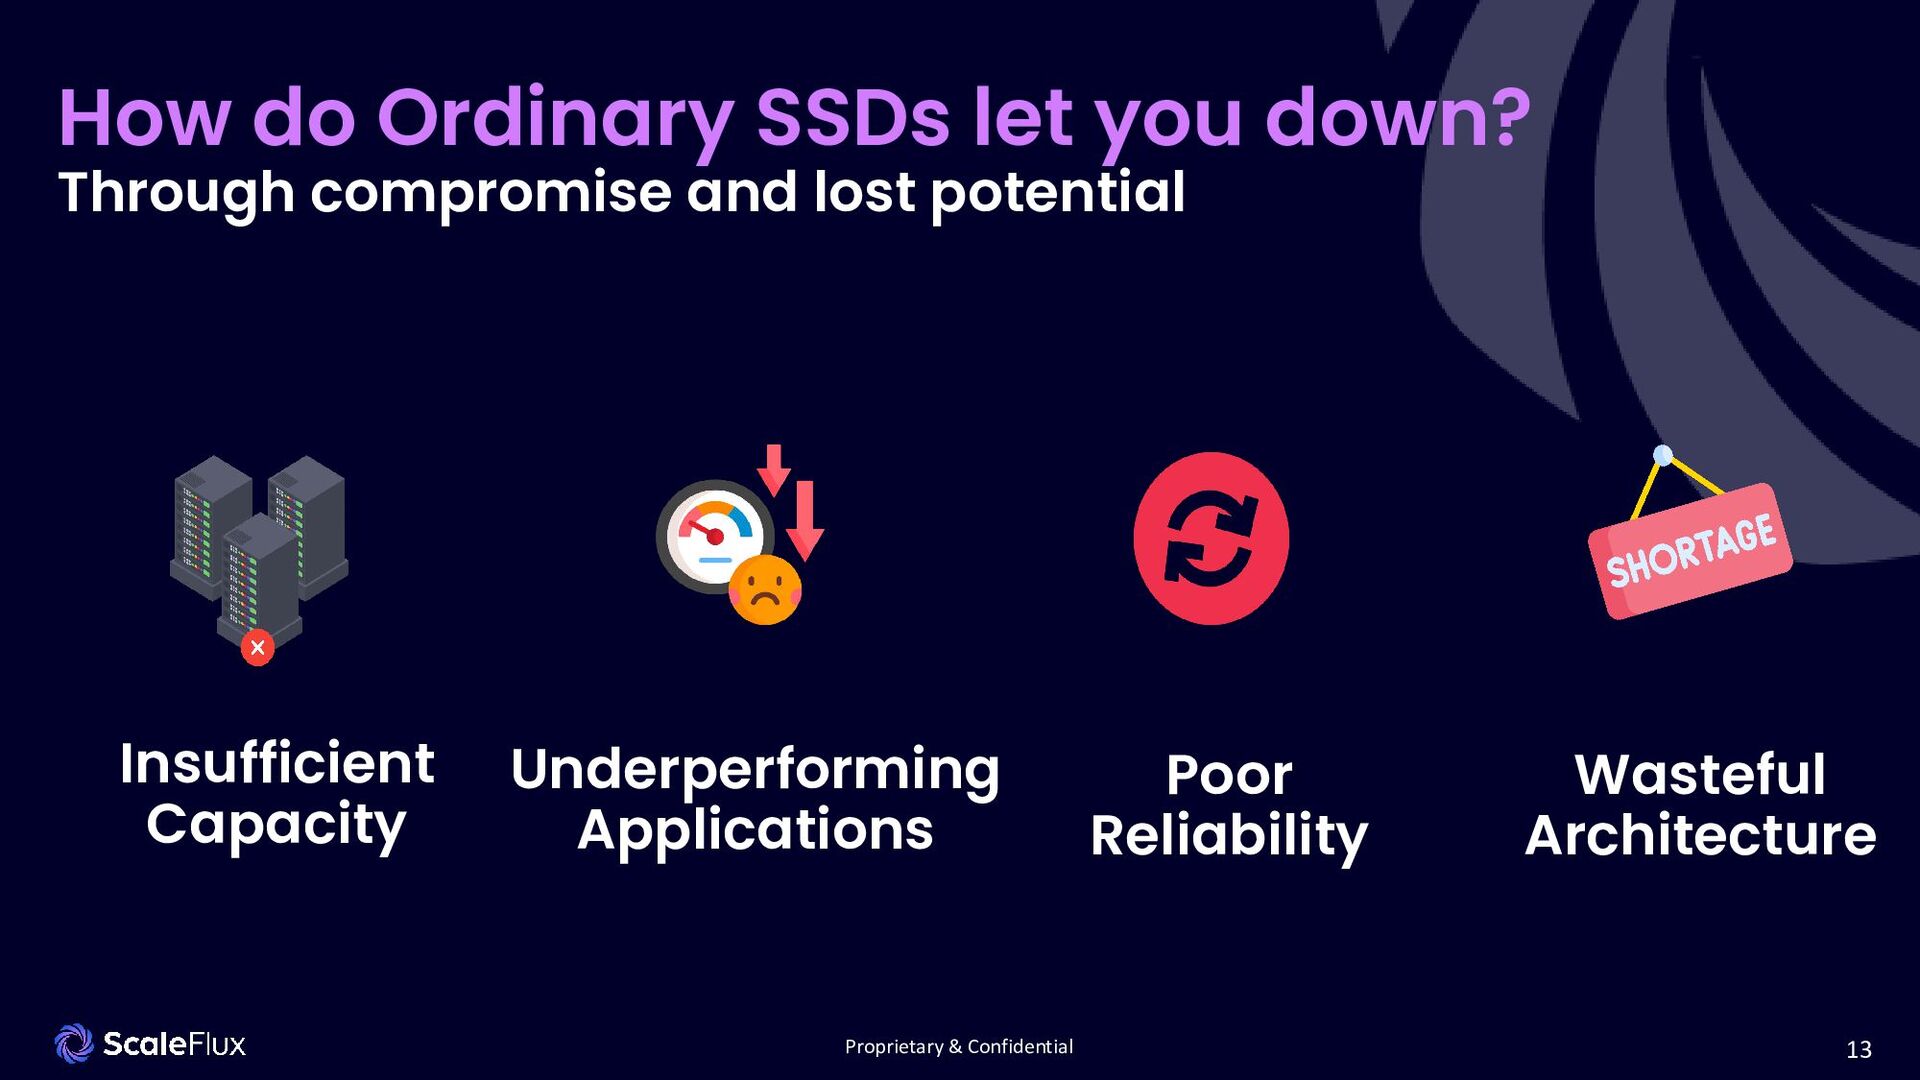
IT’s biggest “Everyone Problems” • Constant data growth • The complexity of everything • Is there ever an easy answer for anything? • A better SSD makes an immediate impact with no extra complexity Why does the market need a Better SSD? Ordinary SSDs can’t cut it
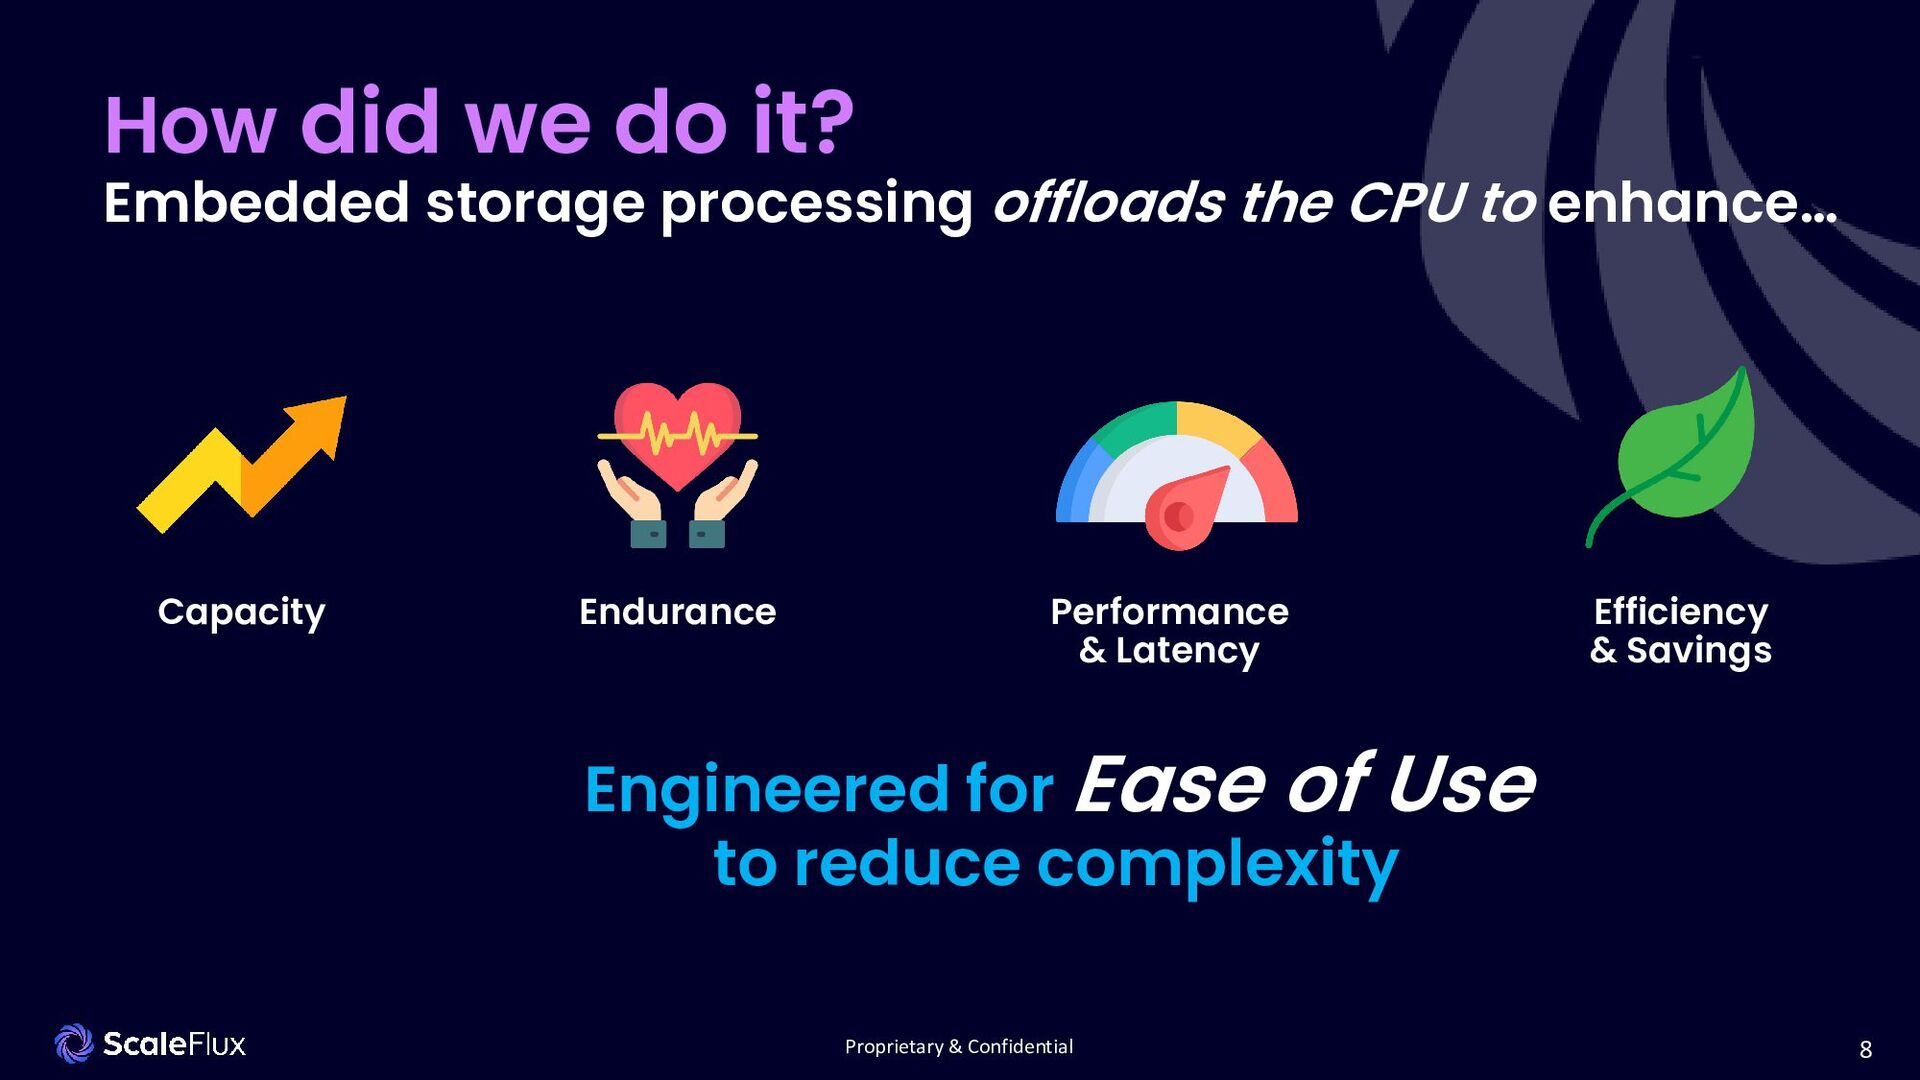
storage processing offloads the CPU to enhance… Efficiency & Savings Performance & Latency Endurance Capacity Engineered for Ease of Use to reduce complexity
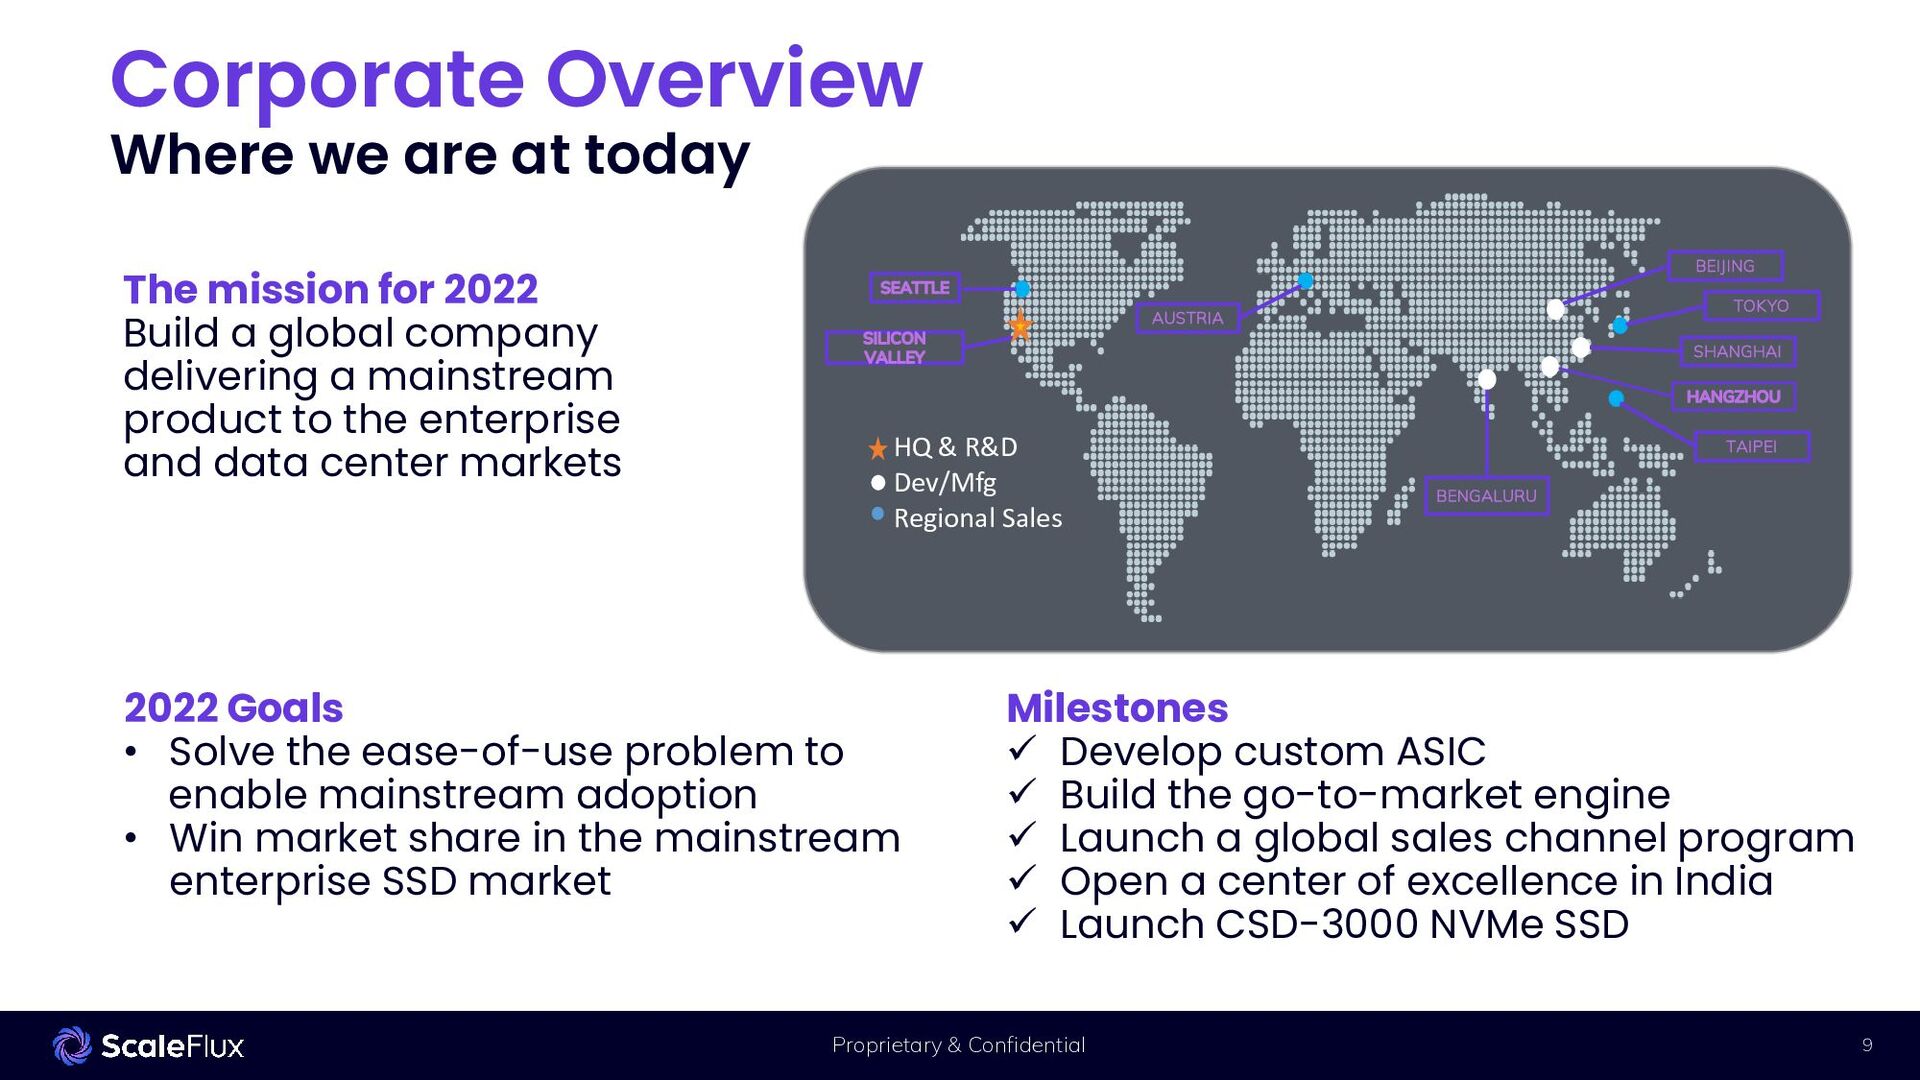
today 2022 Goals • Solve the ease-of-use problem to enable mainstream adoption • Win market share in the mainstream enterprise SSD market Milestones Develop custom ASIC Build the go-to-market engine Launch a global sales channel program Open a center of excellence in India Launch CSD-3000 NVMe SSD The mission for 2022 Build a global company delivering a mainstream product to the enterprise and data center markets SHANGHAI BEIJING TOKYO TAIPEI AUSTRIA HQ & R&D Dev/Mfg Regional Sales BENGALURU
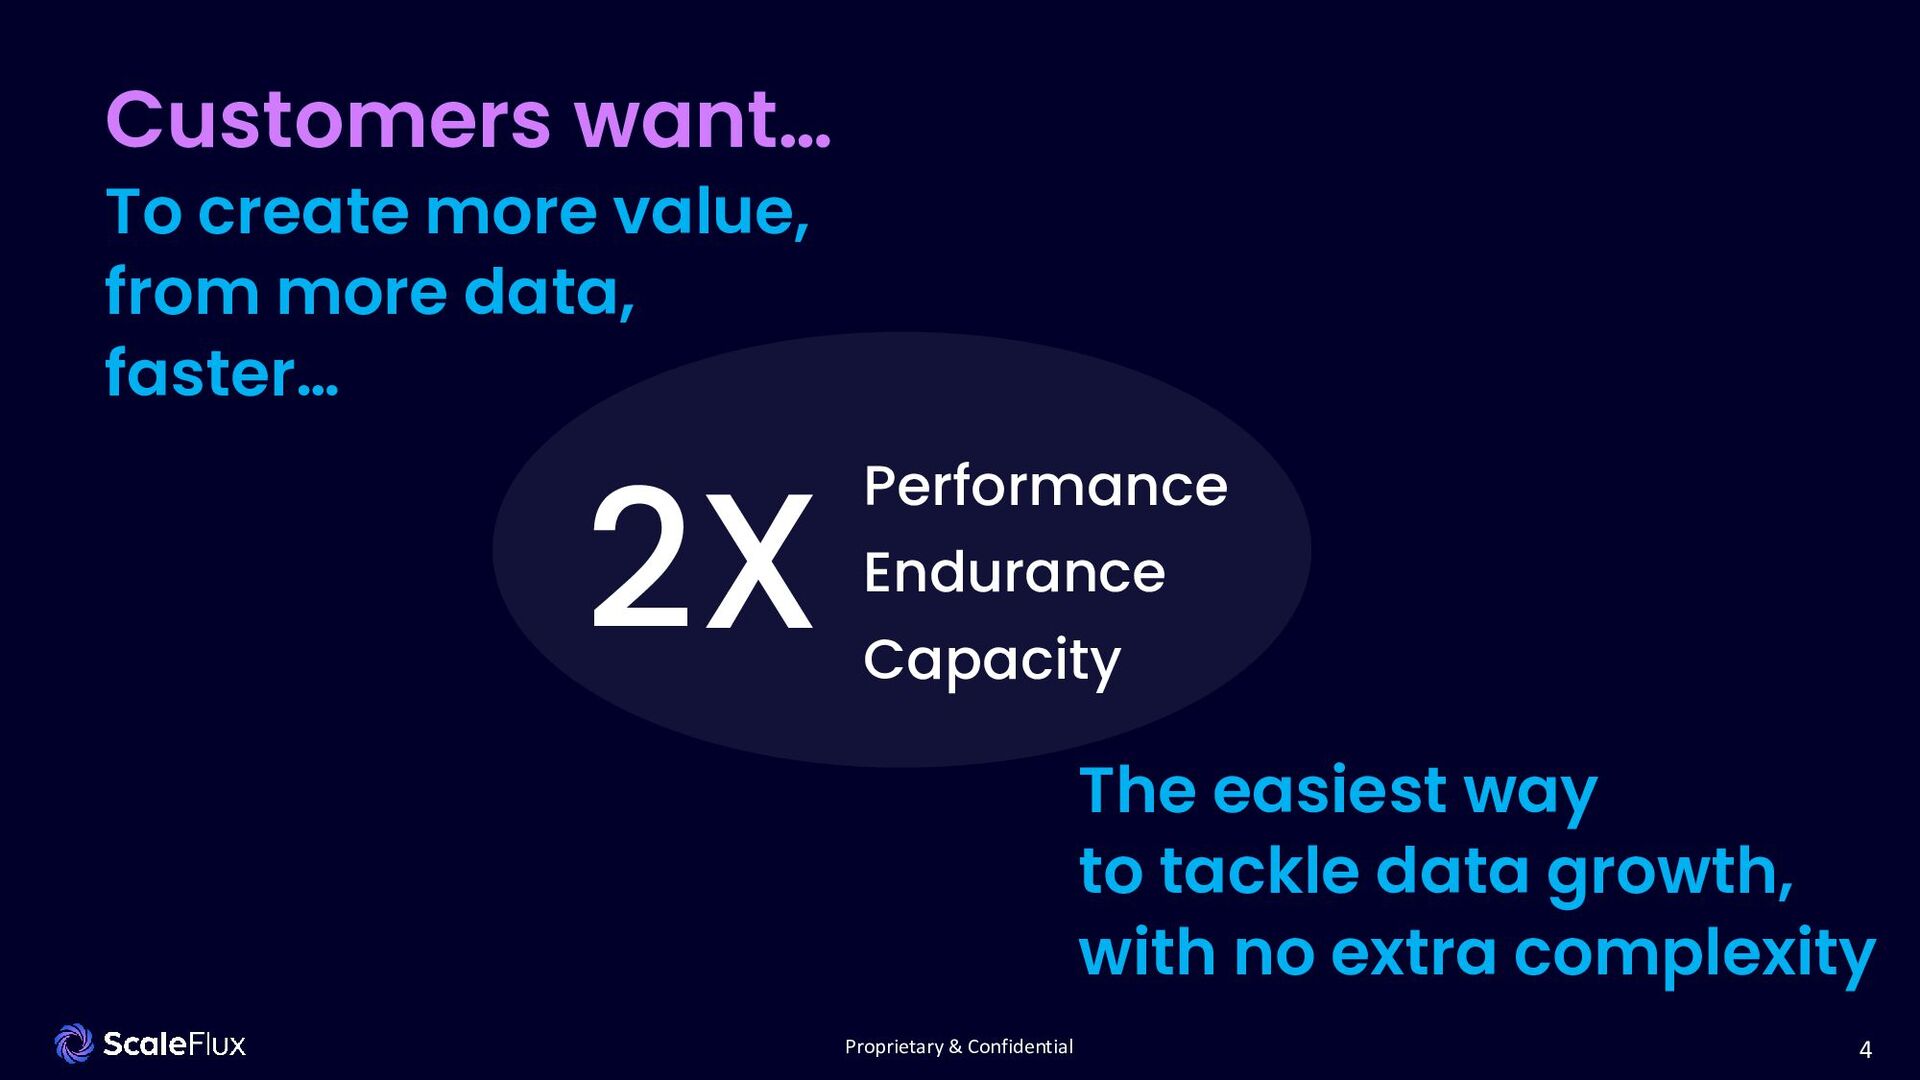
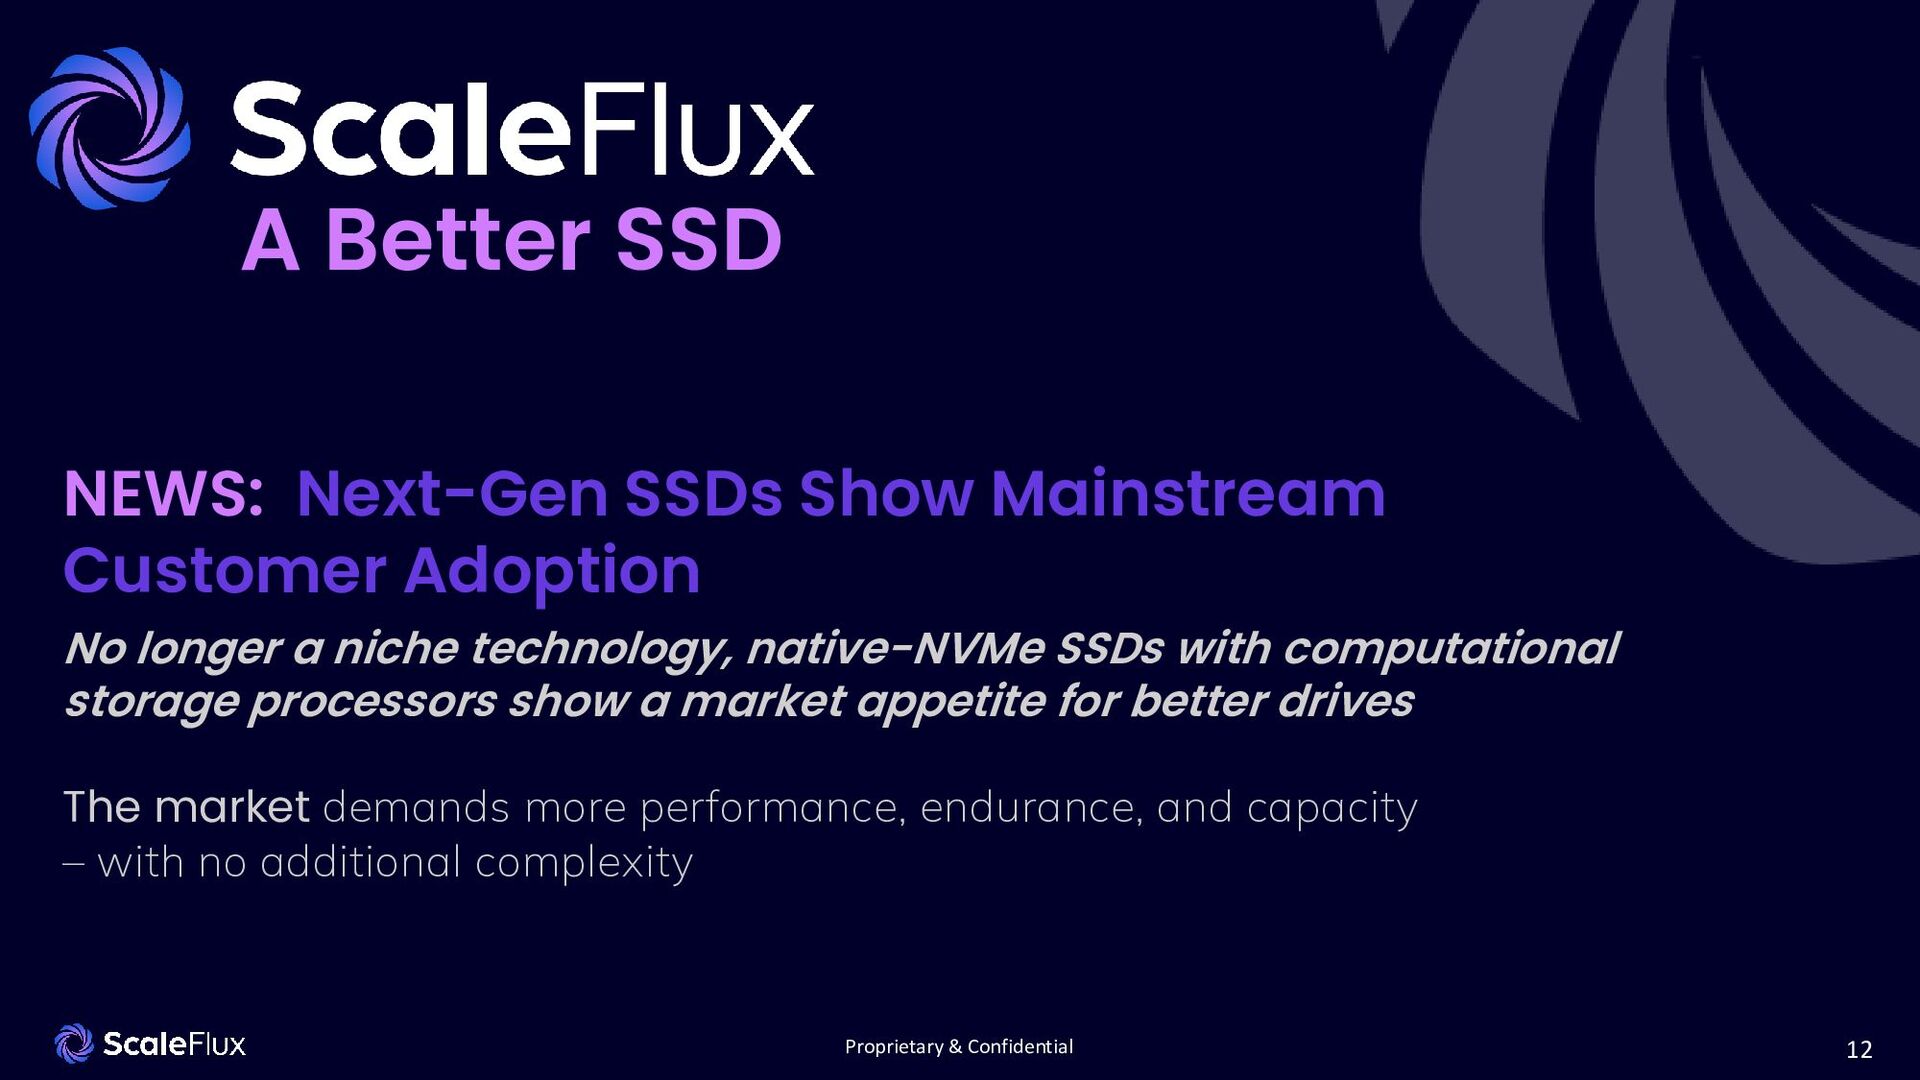
Adoption No longer a niche technology, native-NVMe SSDs with computational storage processors show a market appetite for better drives The market demands more performance, endurance, and capacity – with no additional complexity A Better SSD
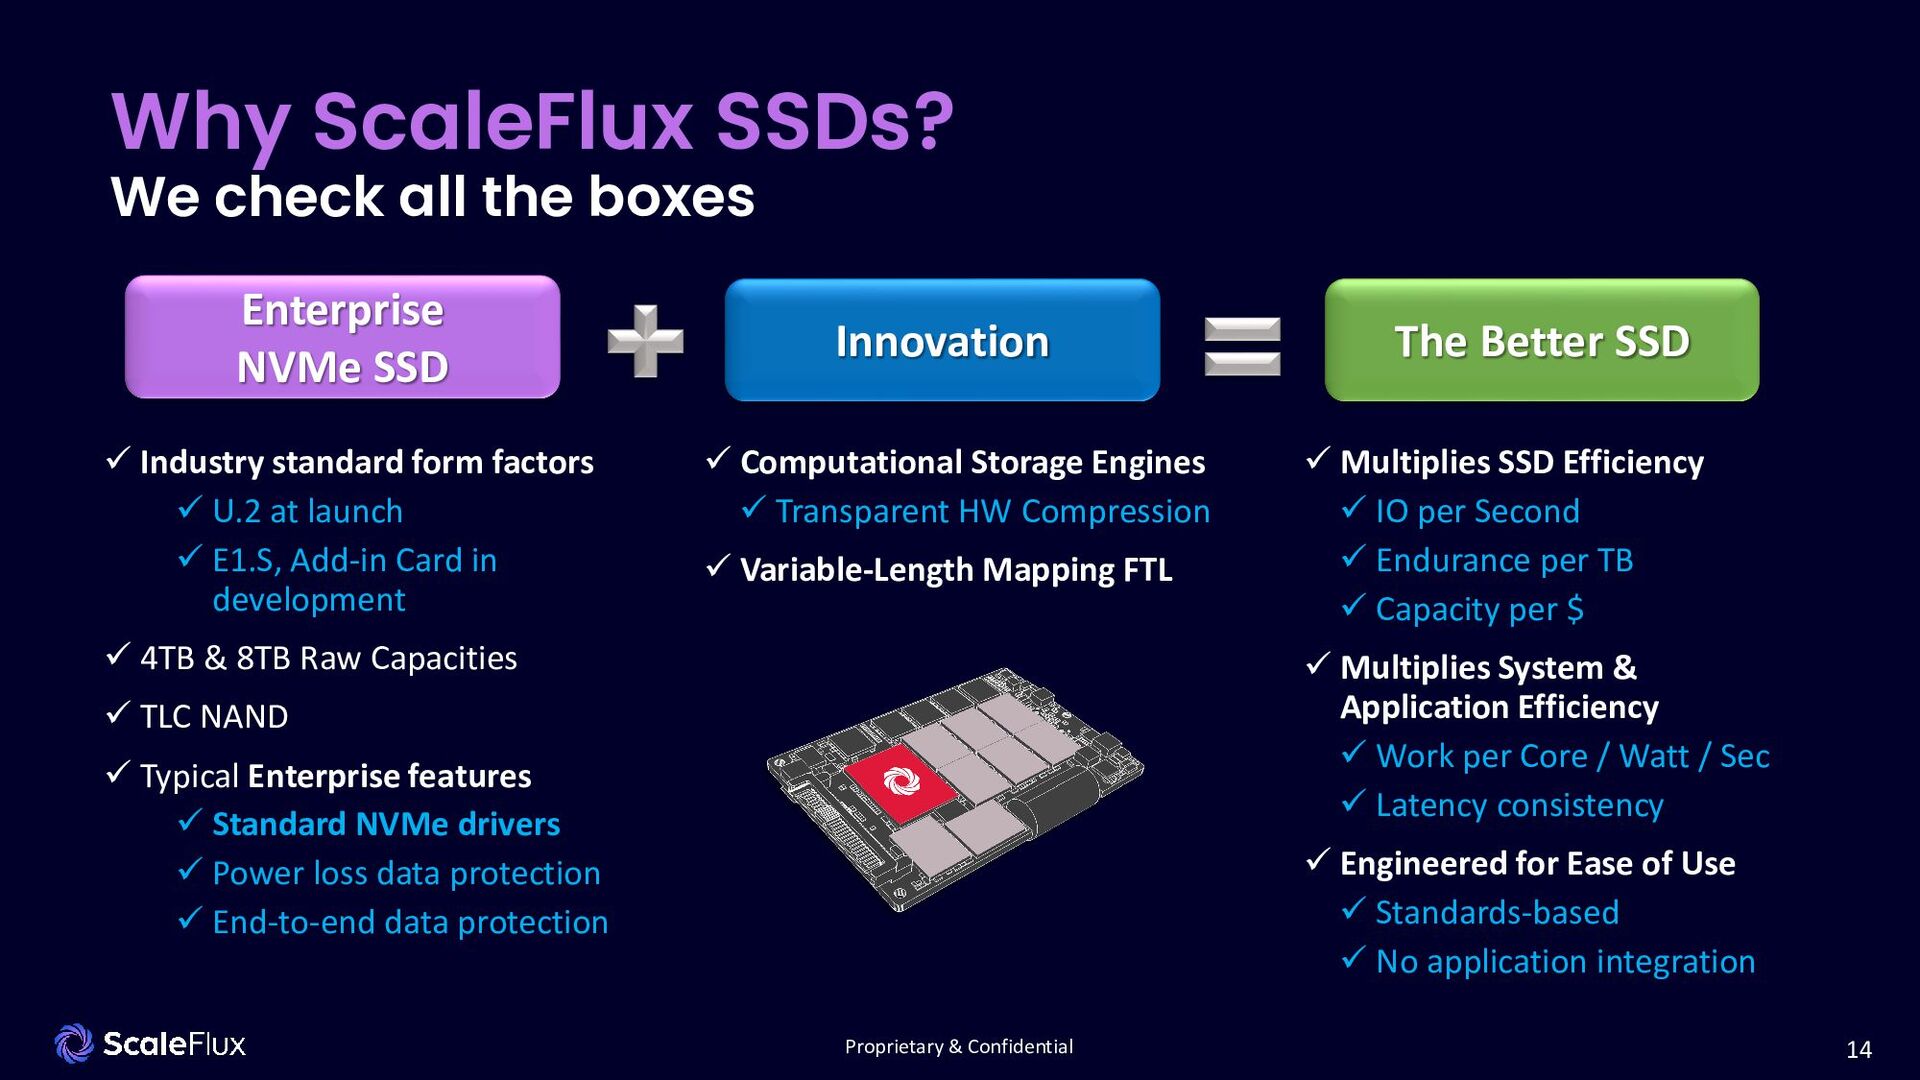
SSDs? We check all the boxes The Better SSD Industry standard form factors U.2 at launch E1.S, Add-in Card in development 4TB & 8TB Raw Capacities TLC NAND Typical Enterprise features Standard NVMe drivers Power loss data protection End-to-end data protection Computational Storage Engines Transparent HW Compression Variable-Length Mapping FTL Multiplies SSD Efficiency IO per Second Endurance per TB Capacity per $ Multiplies System & Application Efficiency Work per Core / Watt / Sec Latency consistency Engineered for Ease of Use Standards-based No application integration
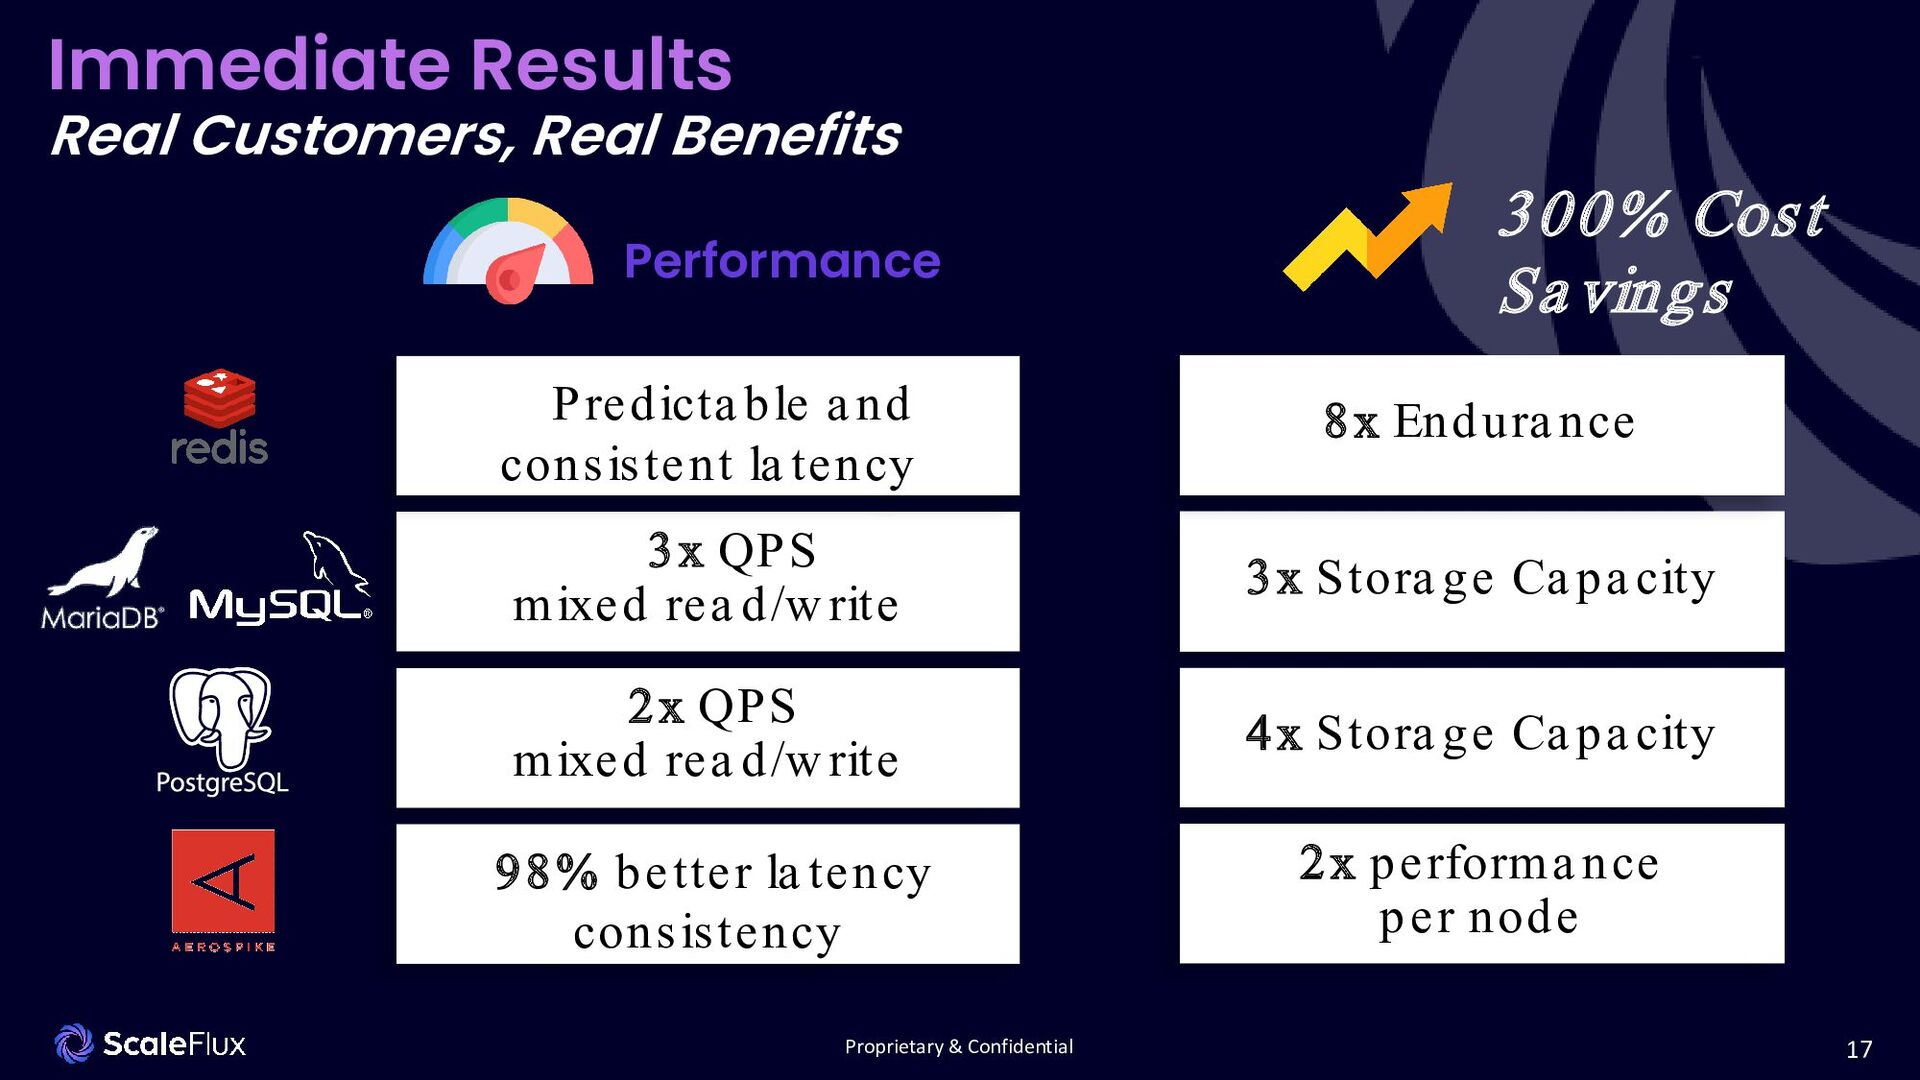
Performance 300% Cost Sa vings 3x QPS mixed rea d/write 3x Stora ge Ca pa city 2x QPS mixed rea d/write 4x Stora ge Ca pa city Predicta ble a nd consistent la tency 8x Endura nce 98% better la tency consistency 2x performa nce per node
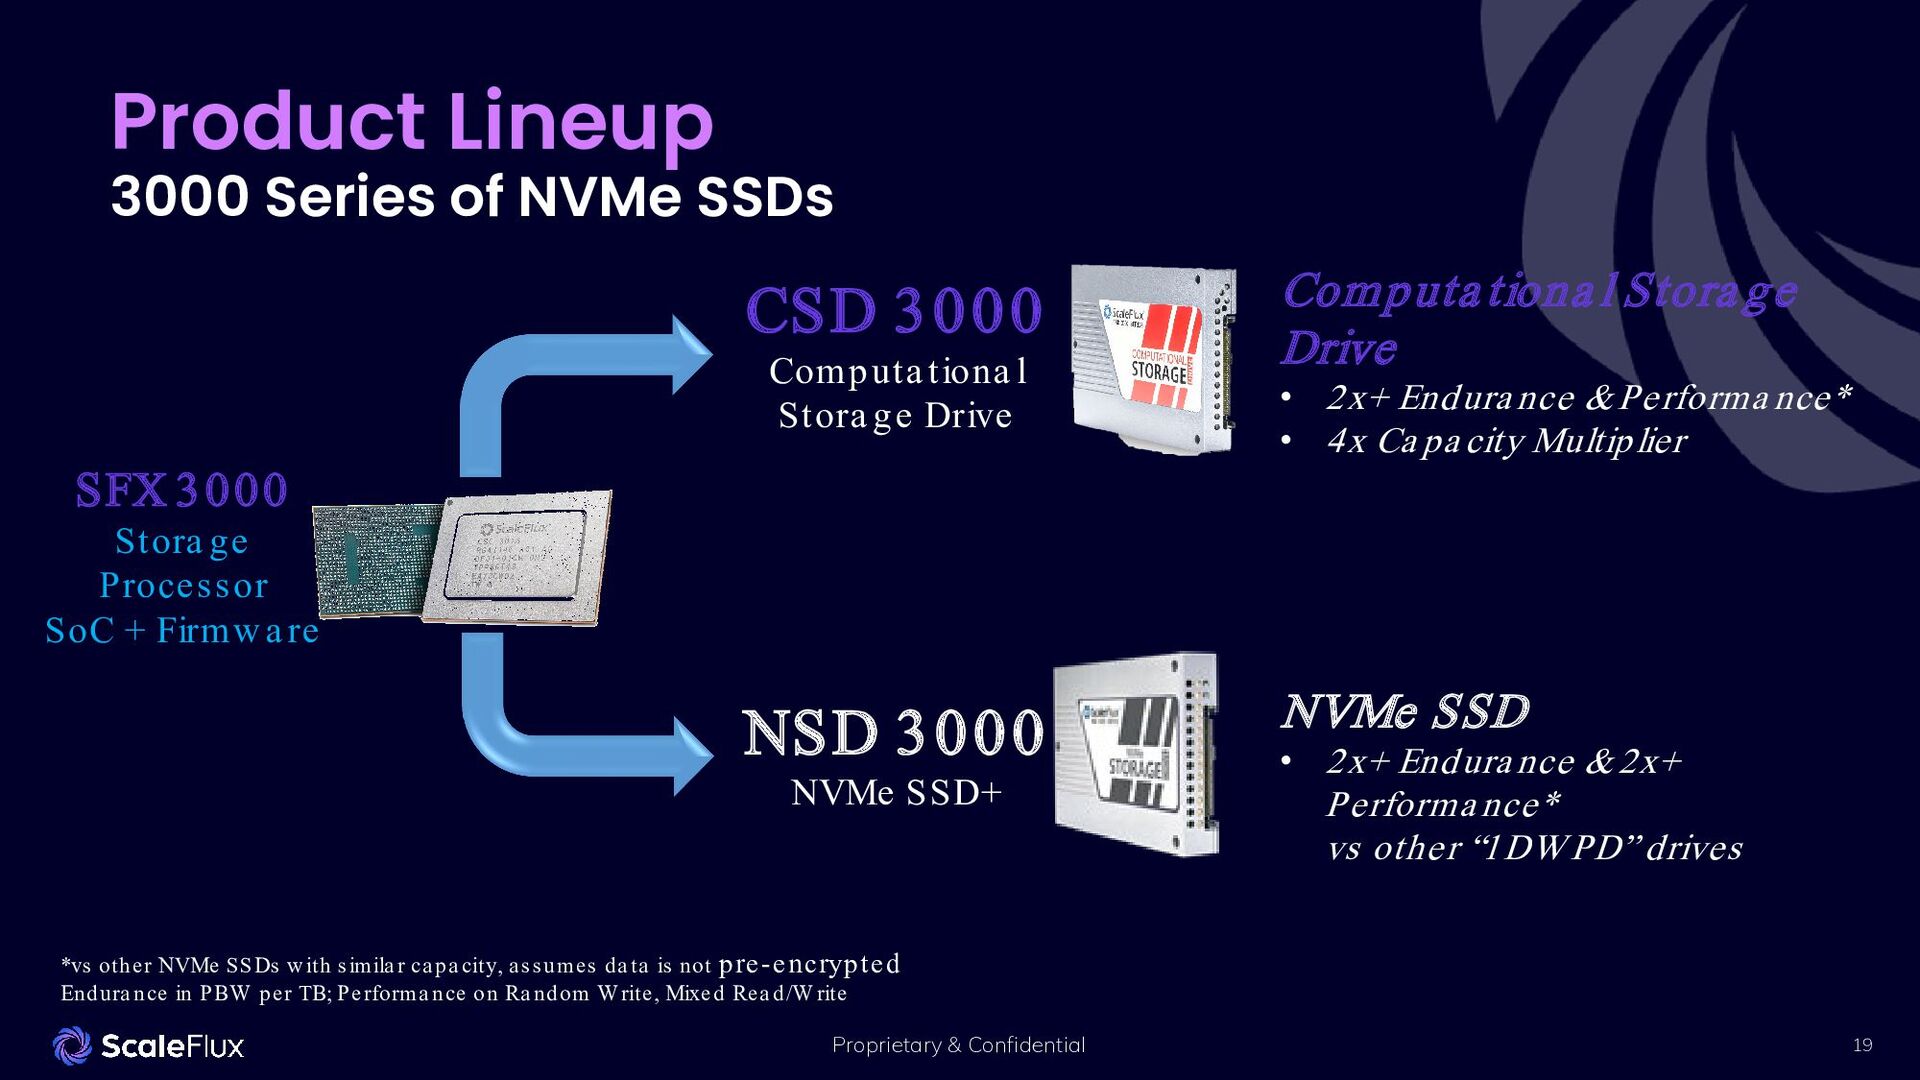
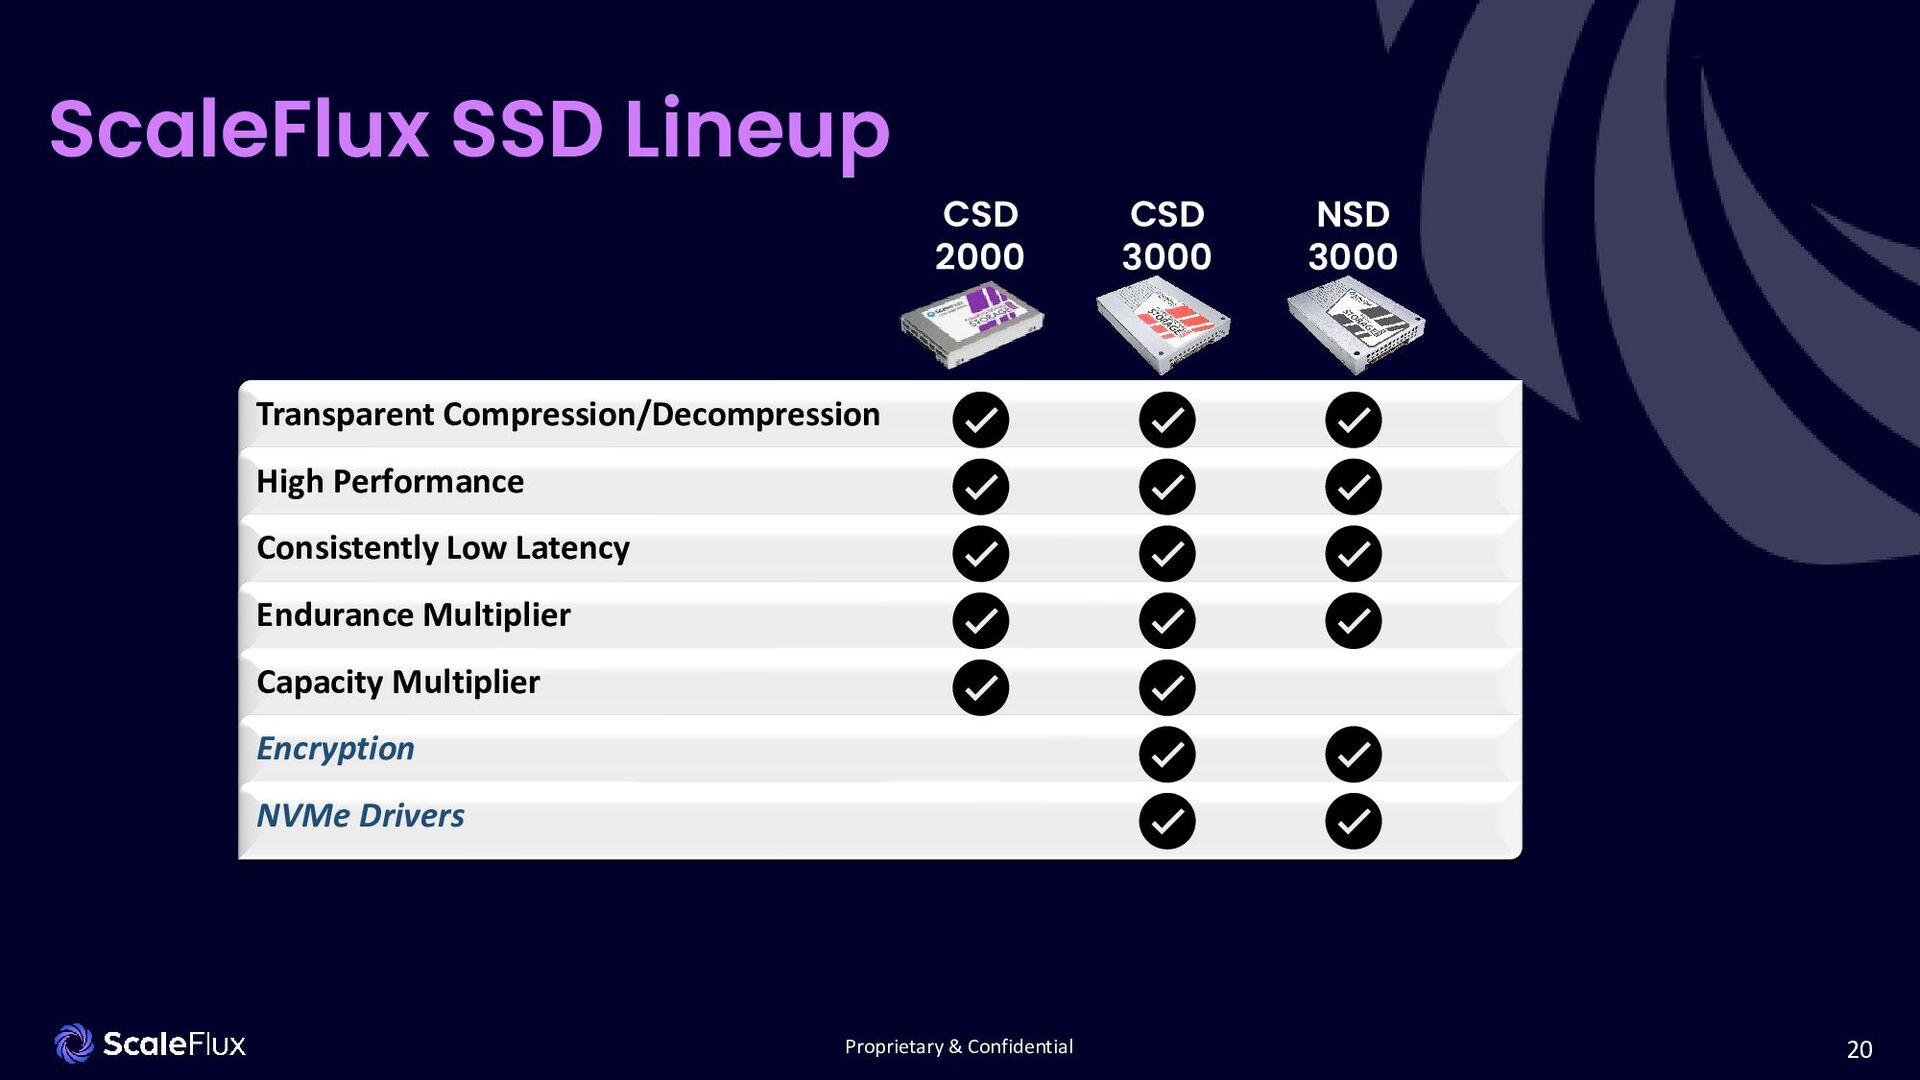
SSDs CSD 3000 Computa tiona l Stora ge Drive NSD 3000 NVMe SSD+ SFX 3000 Stora ge Processor SoC + Firmwa re NVMe SSD • 2x+ Endurance & 2x+ Performance* vs other “1DW PD” drives Computational Storage Drive • 2x+ Endurance & Performance* • 4x Capacity Multiplier *vs other NVMe SSDs with simila r ca pa city, a ssumes da ta is not pre-encrypted Endura nce in PBW per TB; Performa nce on Ra ndom W rite, Mixed Rea d/W rite
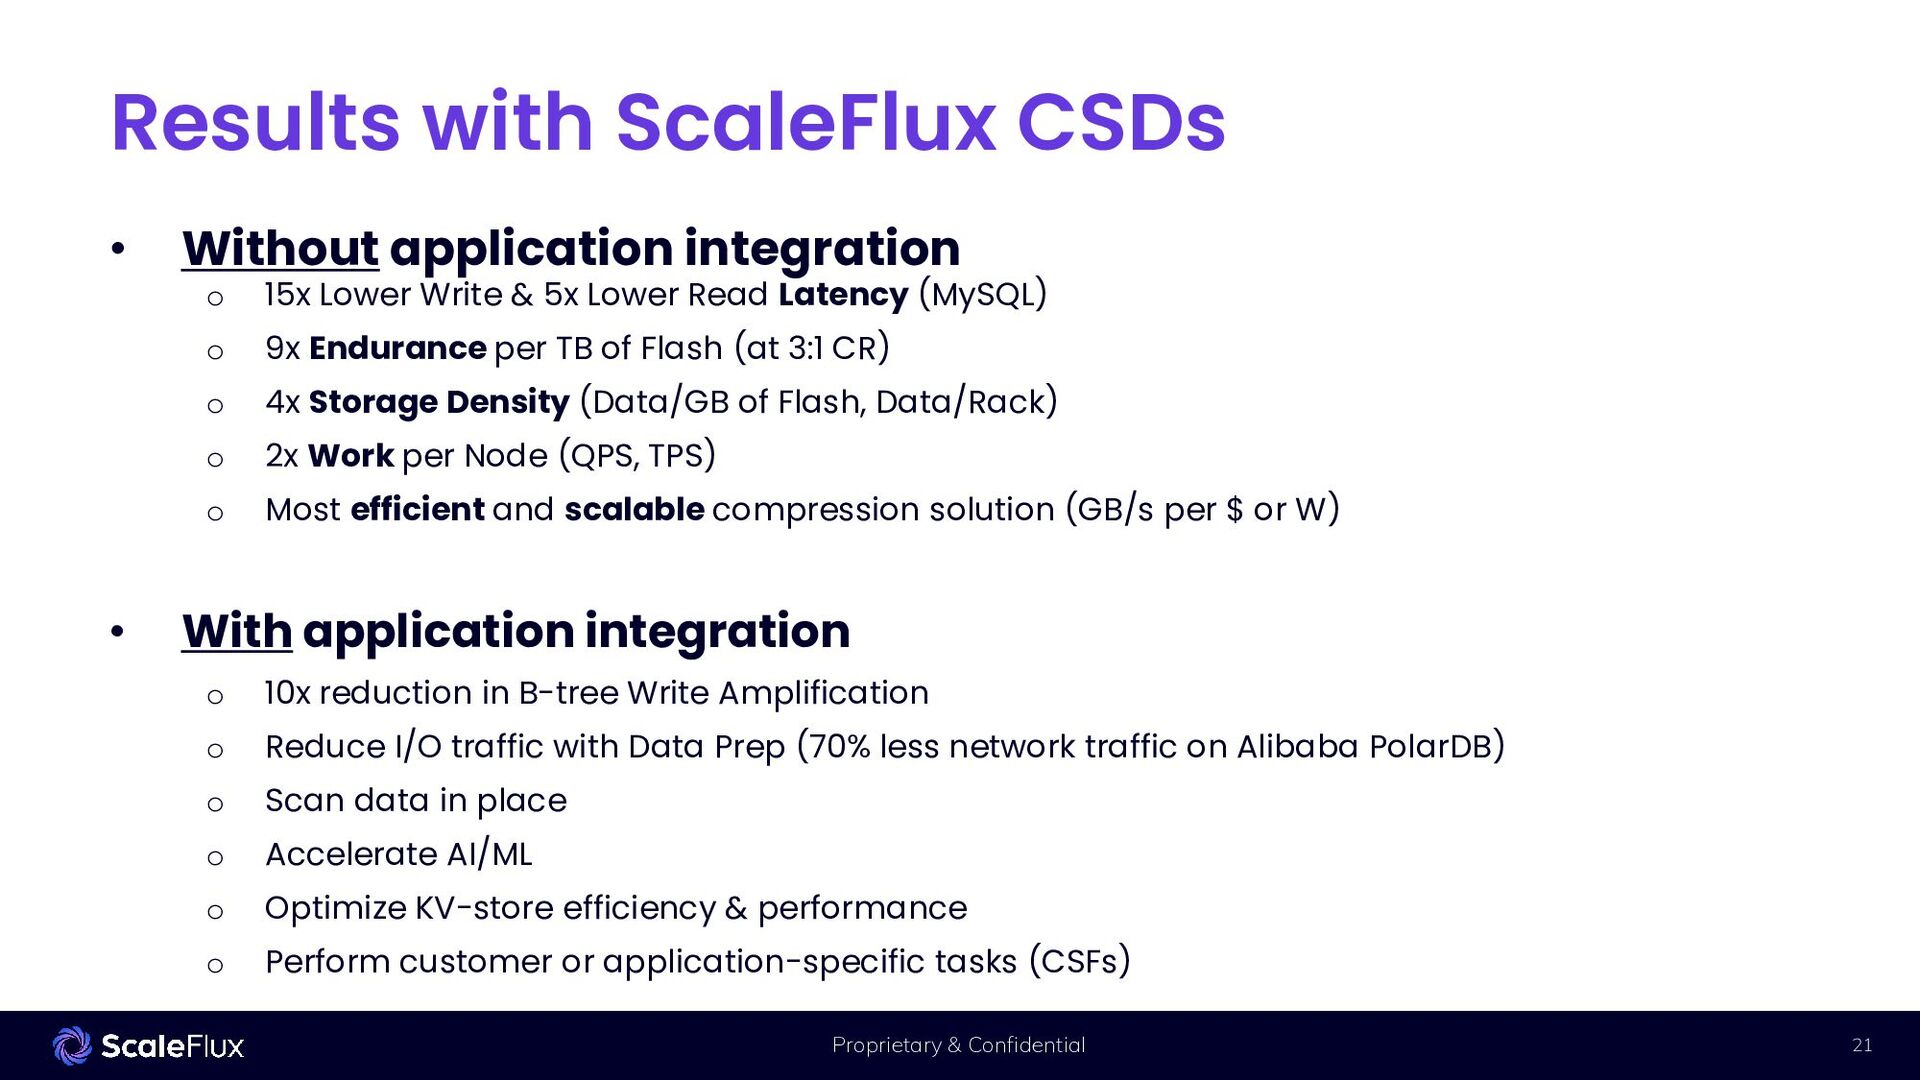
Lower Write & 5x Lower Read Latency (MySQL) o 9x Endurance per TB of Flash (at 3:1 CR) o 4x Storage Density (Data/GB of Flash, Data/Rack) o 2x Work per Node (QPS, TPS) o Most efficient and scalable compression solution (GB/s per $ or W) • With application integration o 10x reduction in B-tree Write Amplification o Reduce I/O traffic with Data Prep (70% less network traffic on Alibaba PolarDB) o Scan data in place o Accelerate AI/ML o Optimize KV-store efficiency & performance o Perform customer or application-specific tasks (CSFs) Results with ScaleFlux CSDs
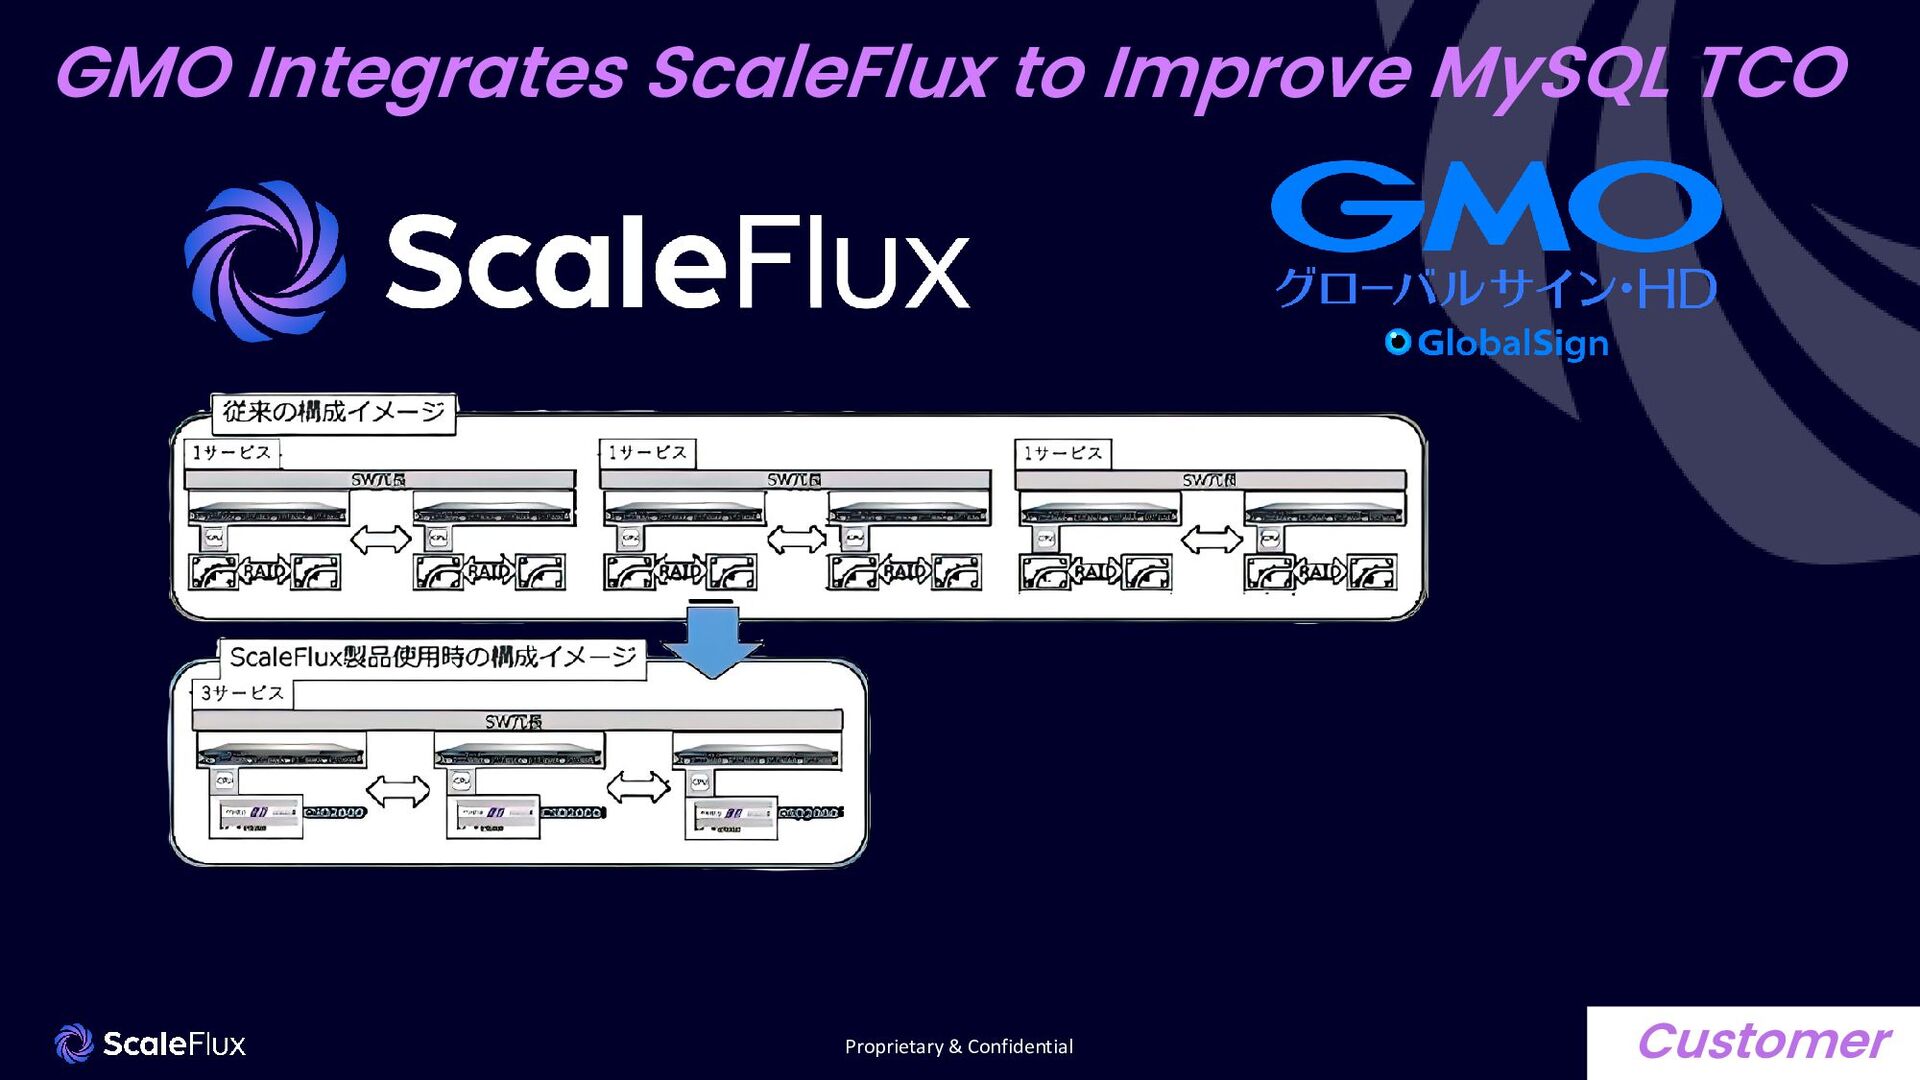
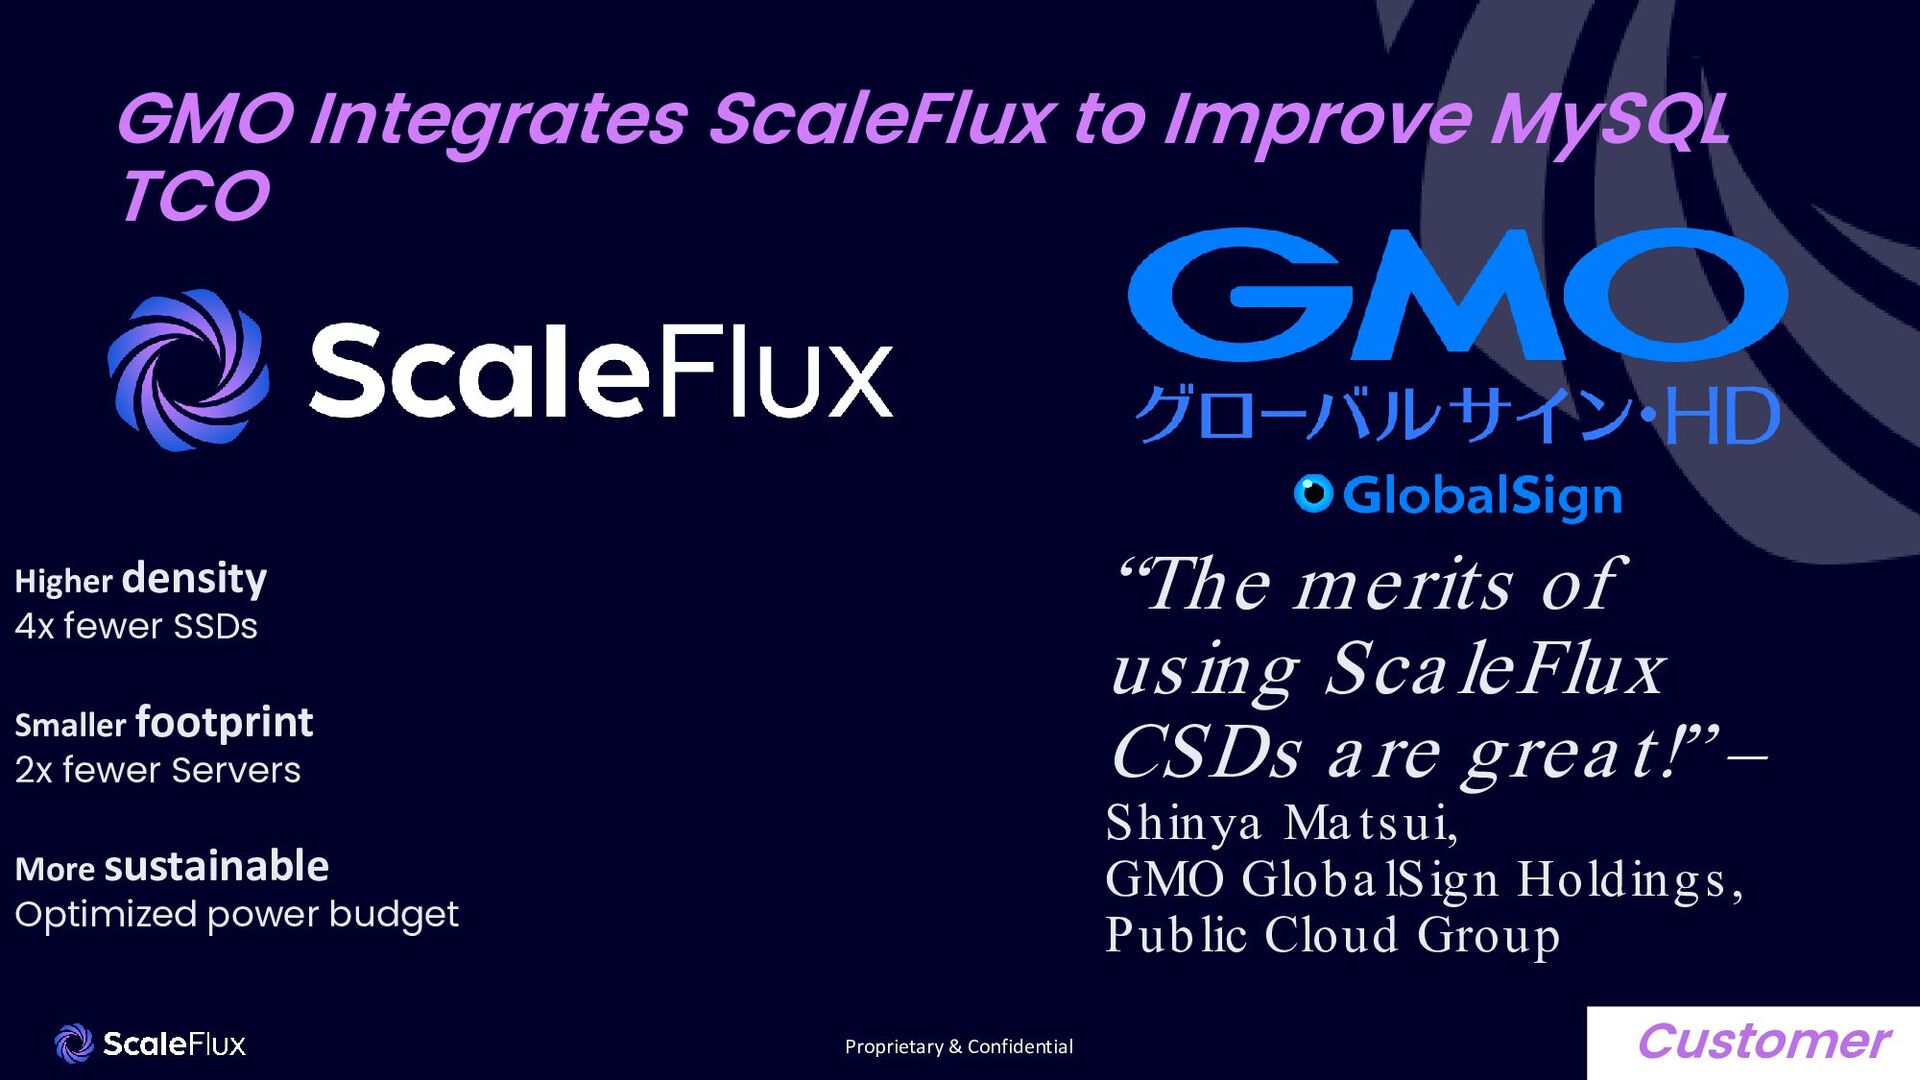
TCO Higher density 4x fewer SSDs Smaller footprint 2x fewer Servers More sustainable Optimized power budget “The merits of using ScaleFlux CSDs are great!” – Shinya Ma tsui, GMO Globa lSign Holdings, Public Cloud Group Customer
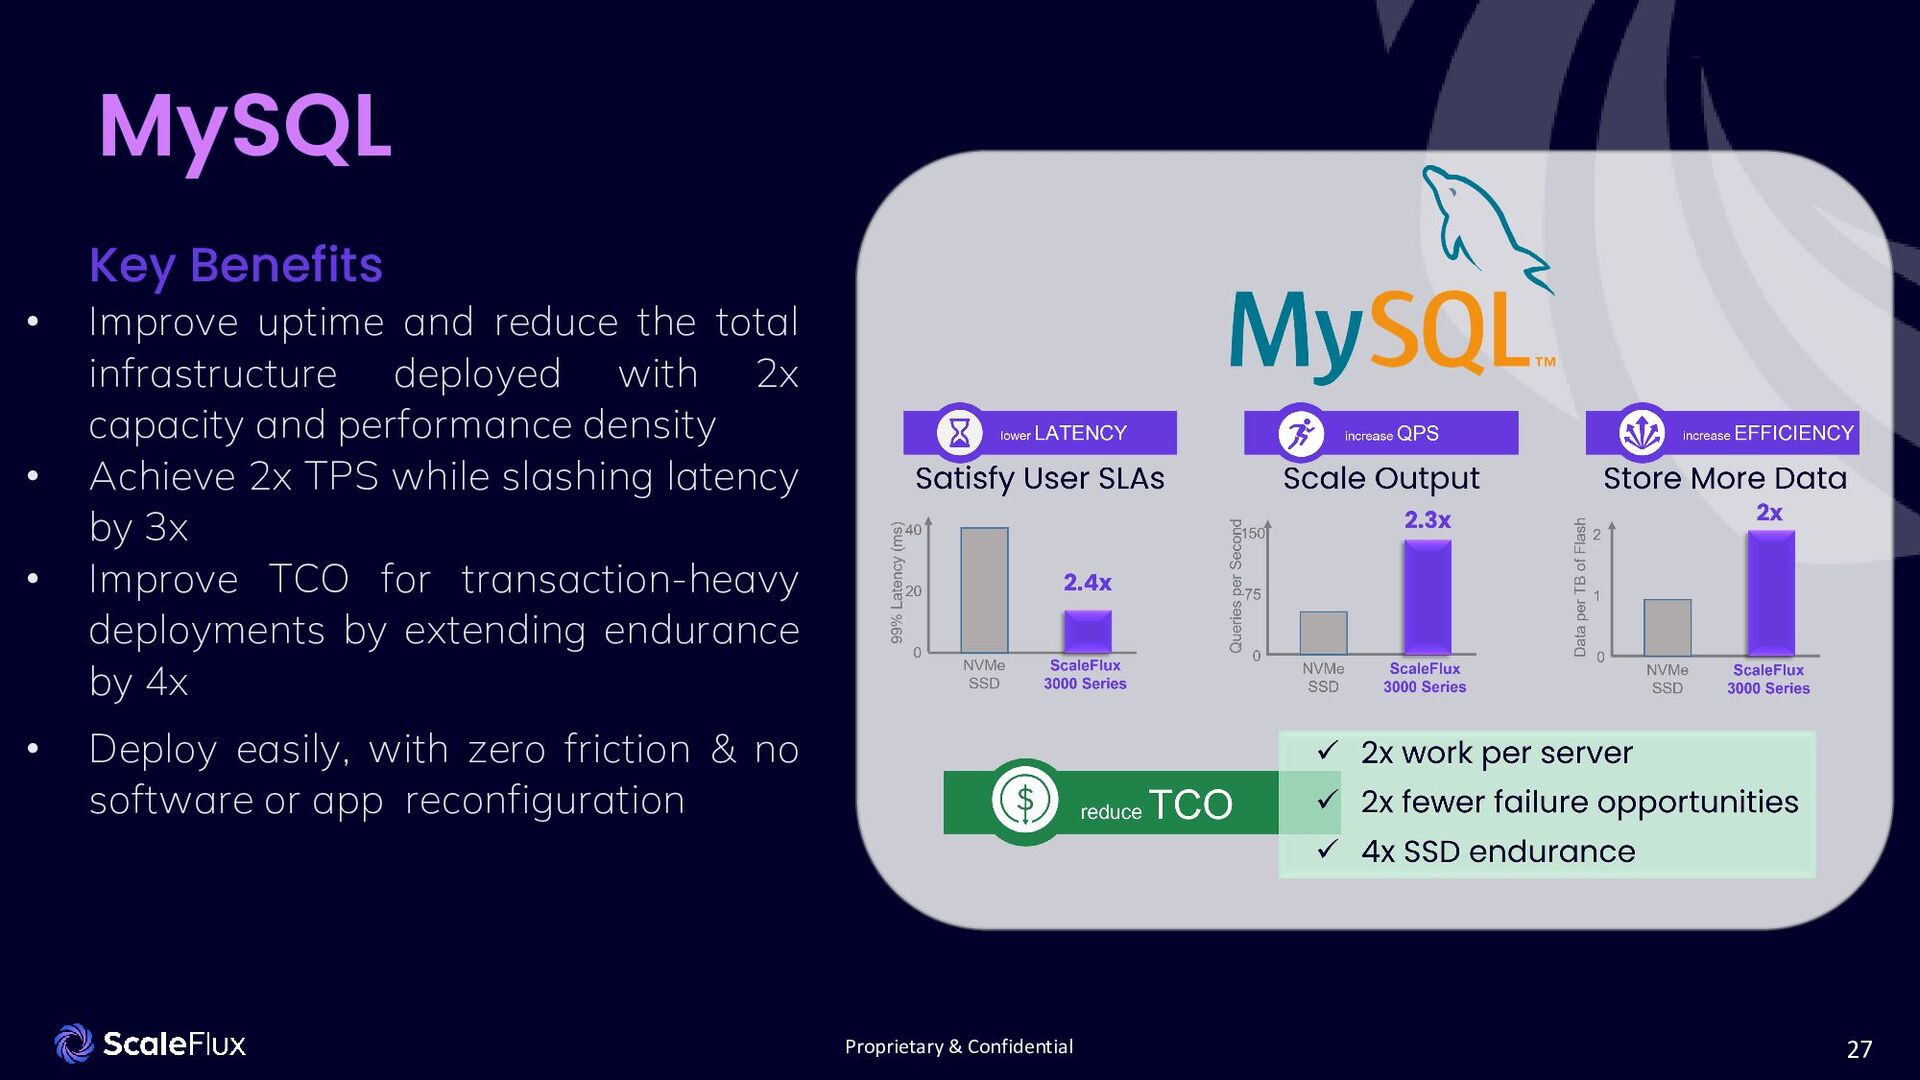
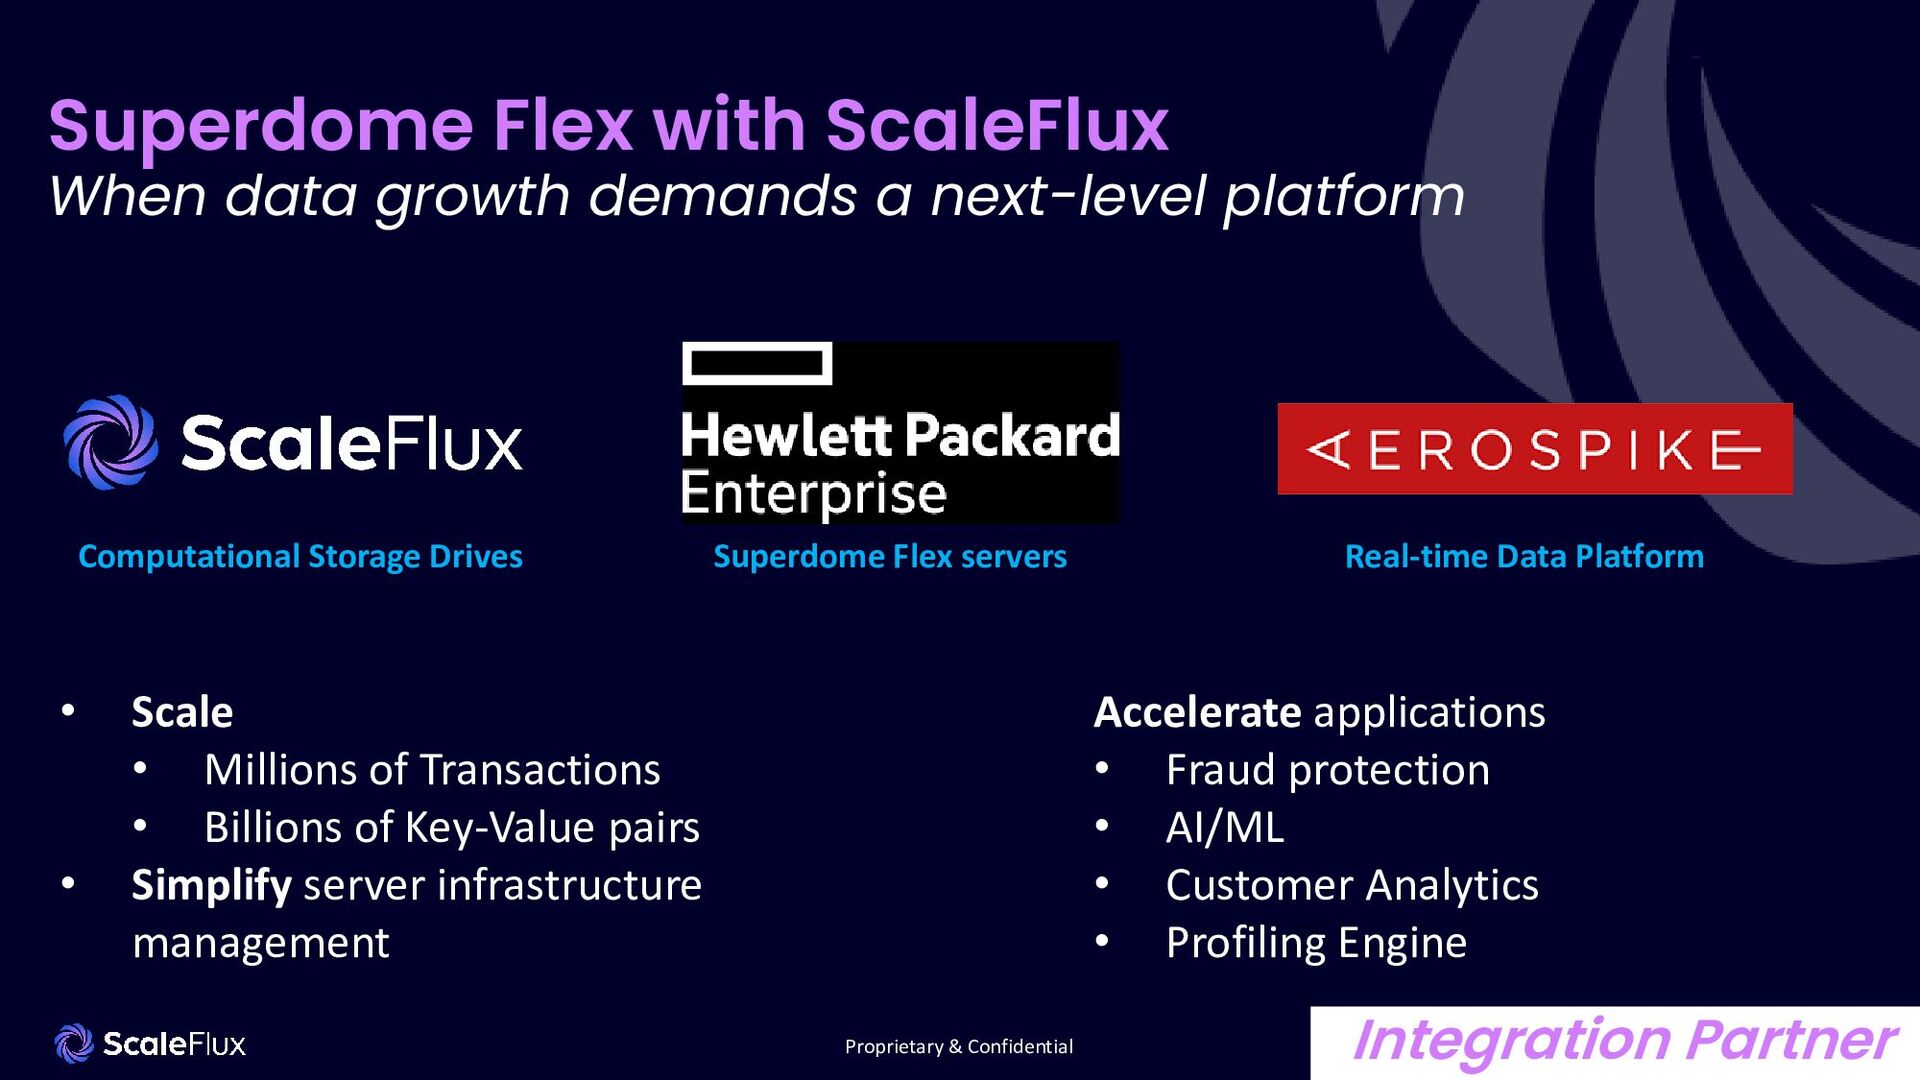
and reduce the total infrastructure deployed with 2x capacity and performance density • Achieve 2x TPS while slashing latency by 3x • Improve TCO for transaction-heavy deployments by extending endurance by 4x • Deploy easily, with zero friction & no software or app reconfiguration
TPS while slashing latency by 3x • Improve uptime and reduce the total infrastructure deployed with 2x capacity and performance density • Deploy easily, with zero friction & no software or app reconfiguration
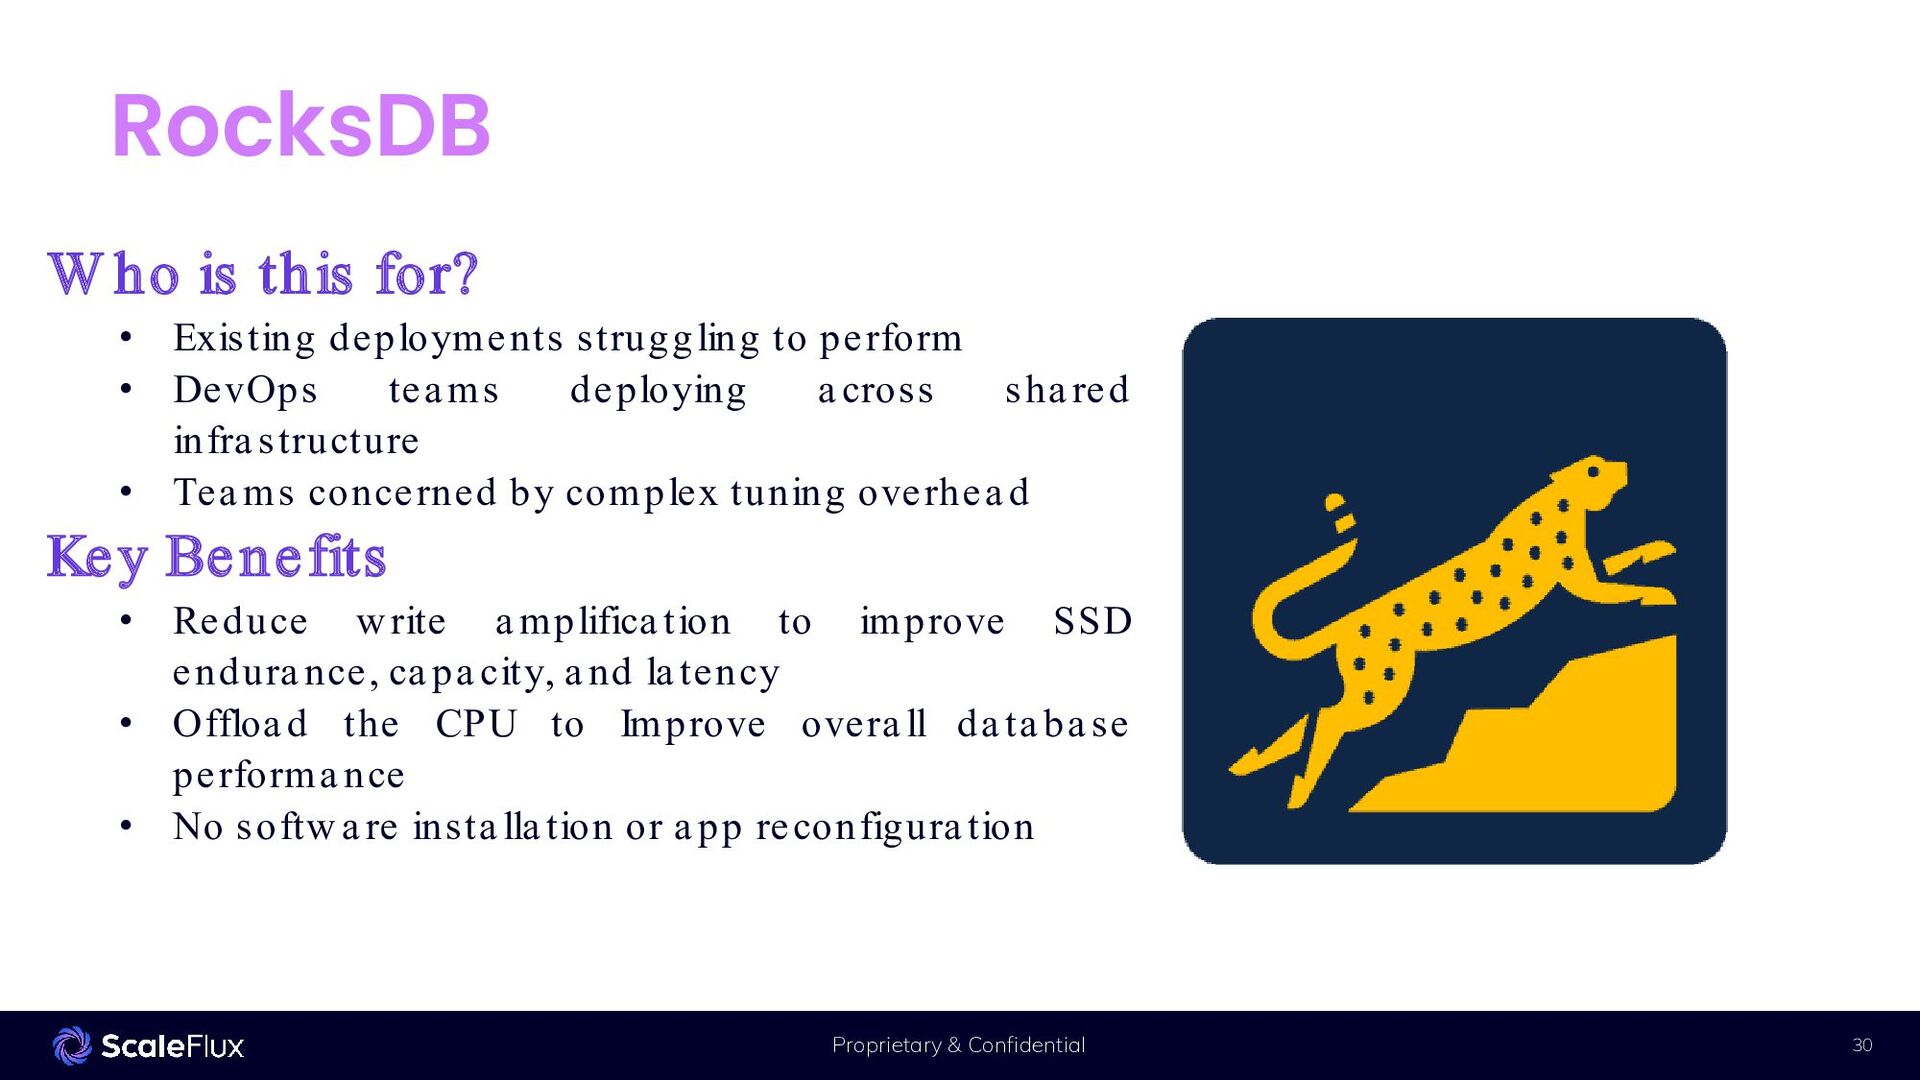
Existing deployments struggling to perform • DevOps teams deploying a cross shared infra structure • Tea ms concerned by complex tuning overhea d Key Benefits • Reduce write a mplifica tion to improve SSD endura nce, ca pa city, a nd la tency • Offloa d the CPU to Improve overa ll da ta base performa nce • No softwa re insta lla tion or a pp reconfigura tion RocksDB
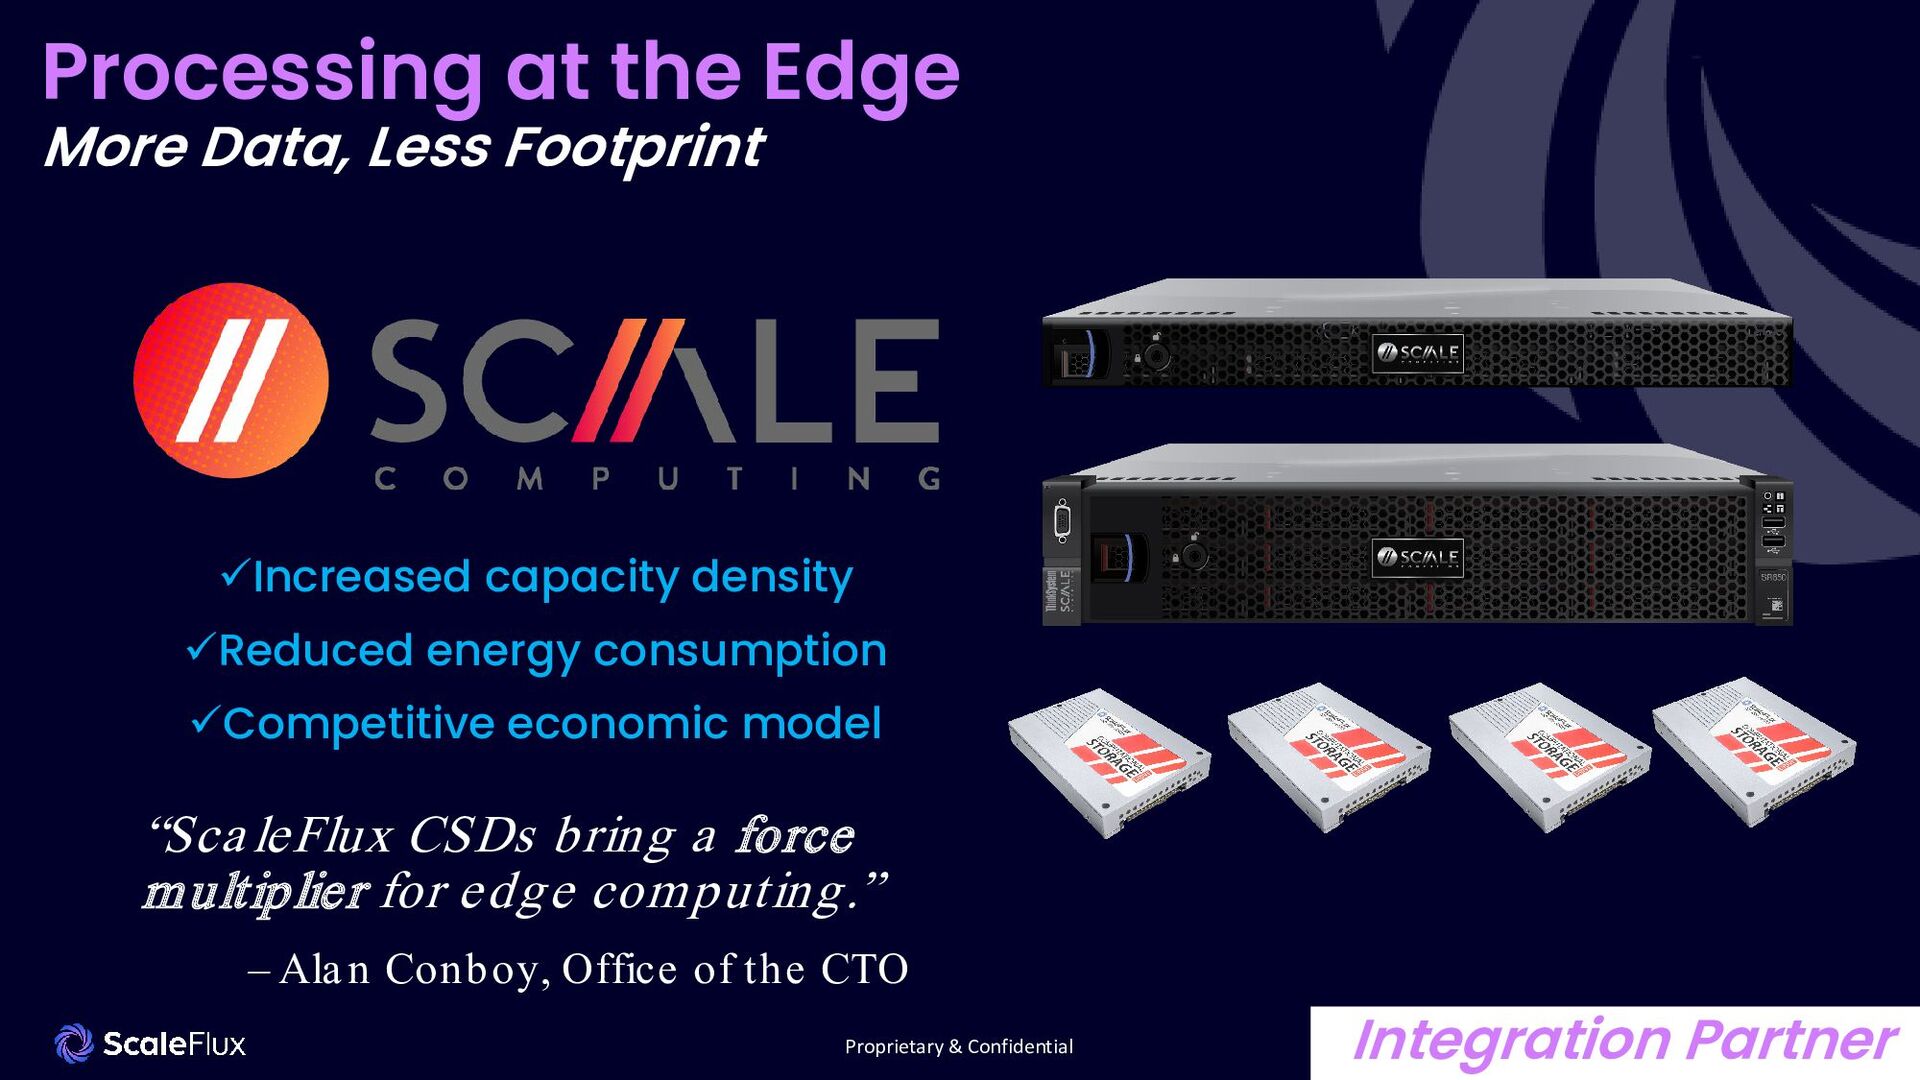
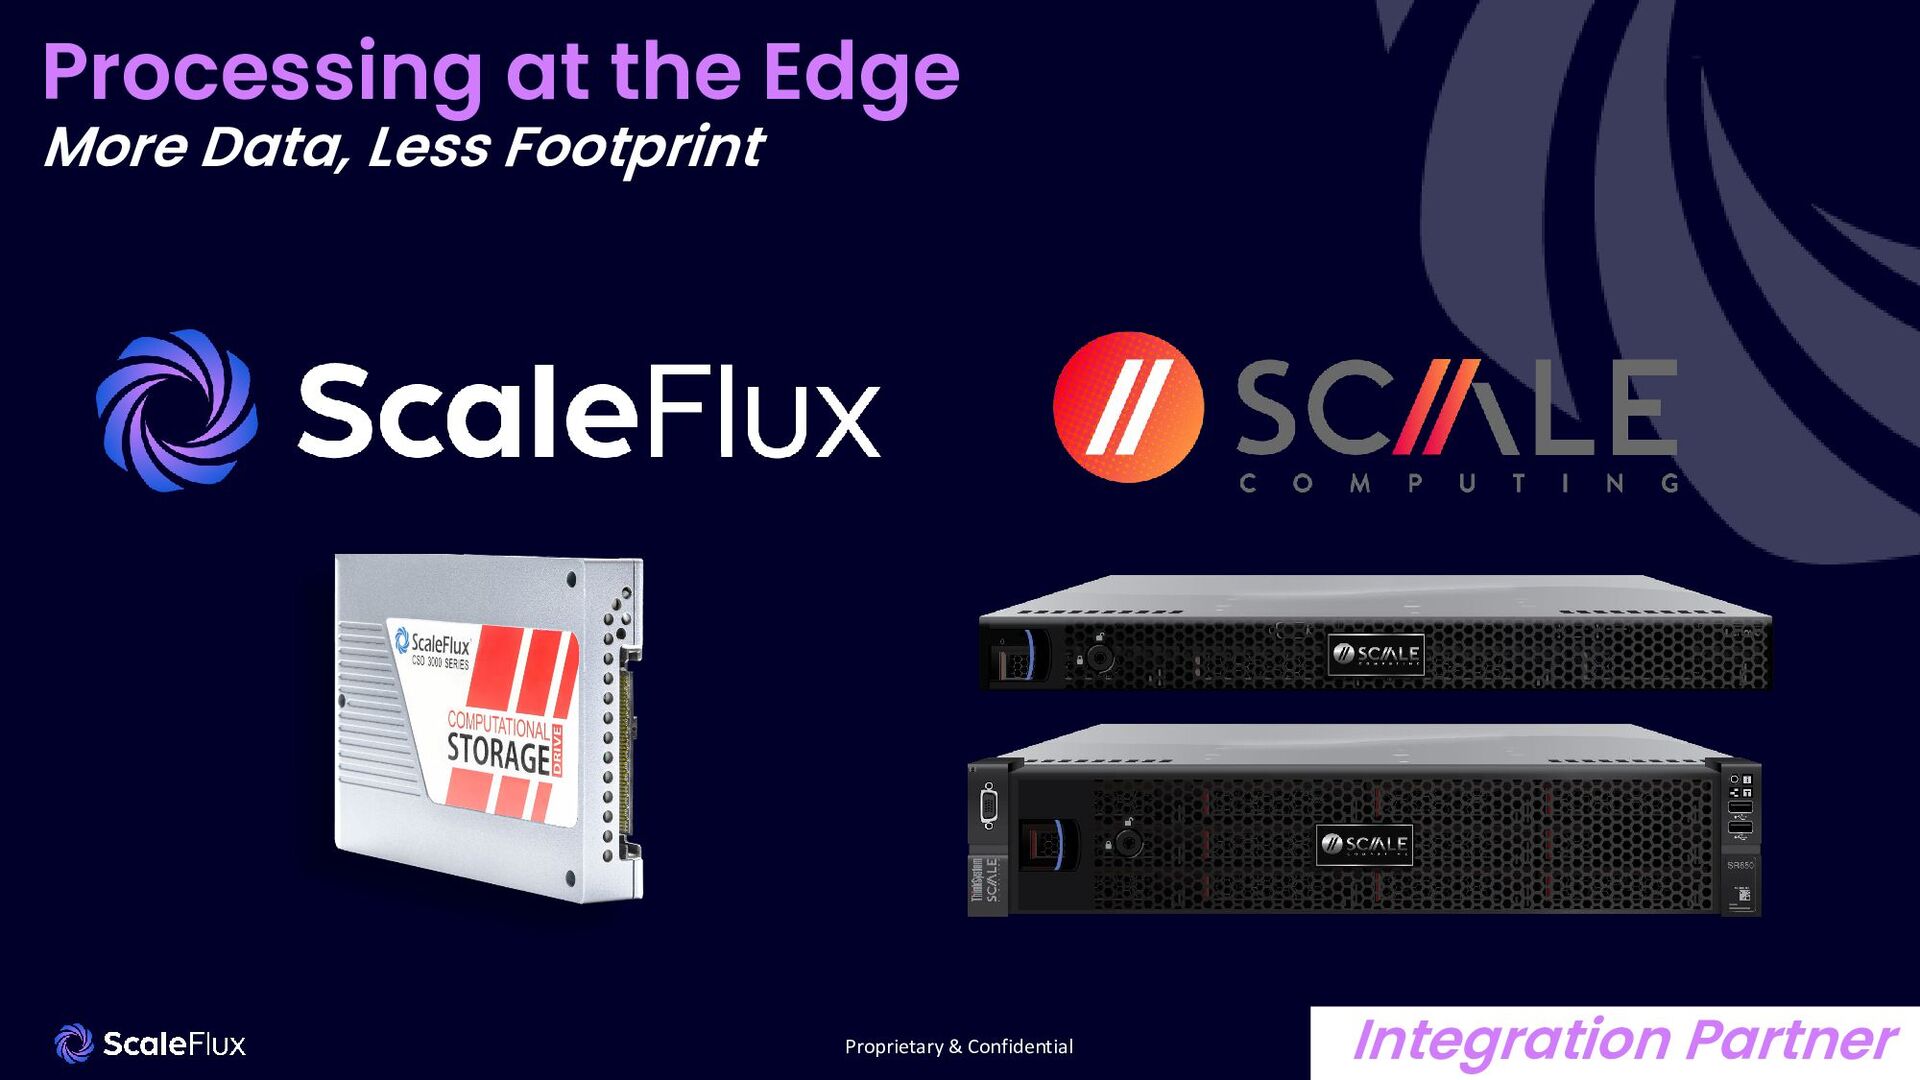
Less Footprint Increased capacity density Reduced energy consumption Competitive economic model “ScaleFlux CSDs bring a force multiplier for edge computing.” – Ala n Conboy, Office of the CTO Integration Partner
options • New form factors • PCIe Gen5 support • What about that processor? • Joint development and collabs • Stay tuned… Looking into the future – 2023
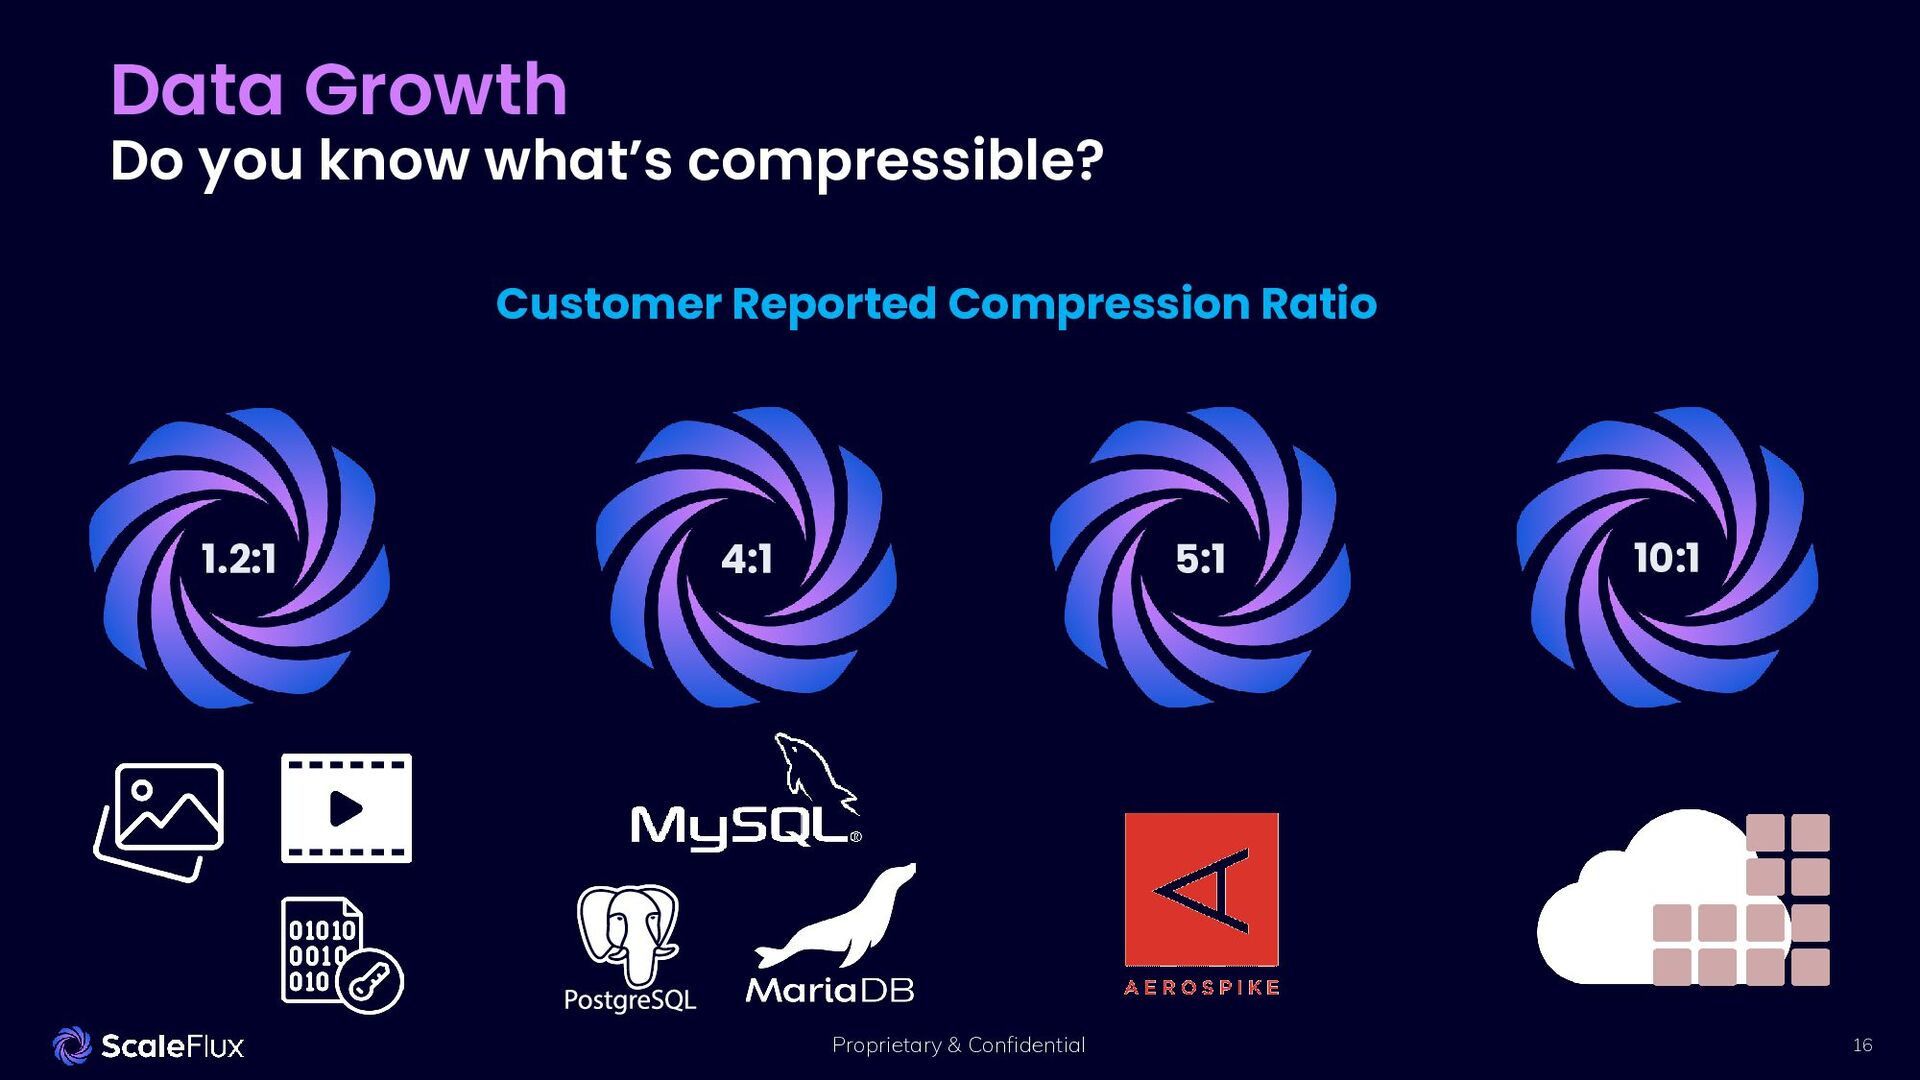
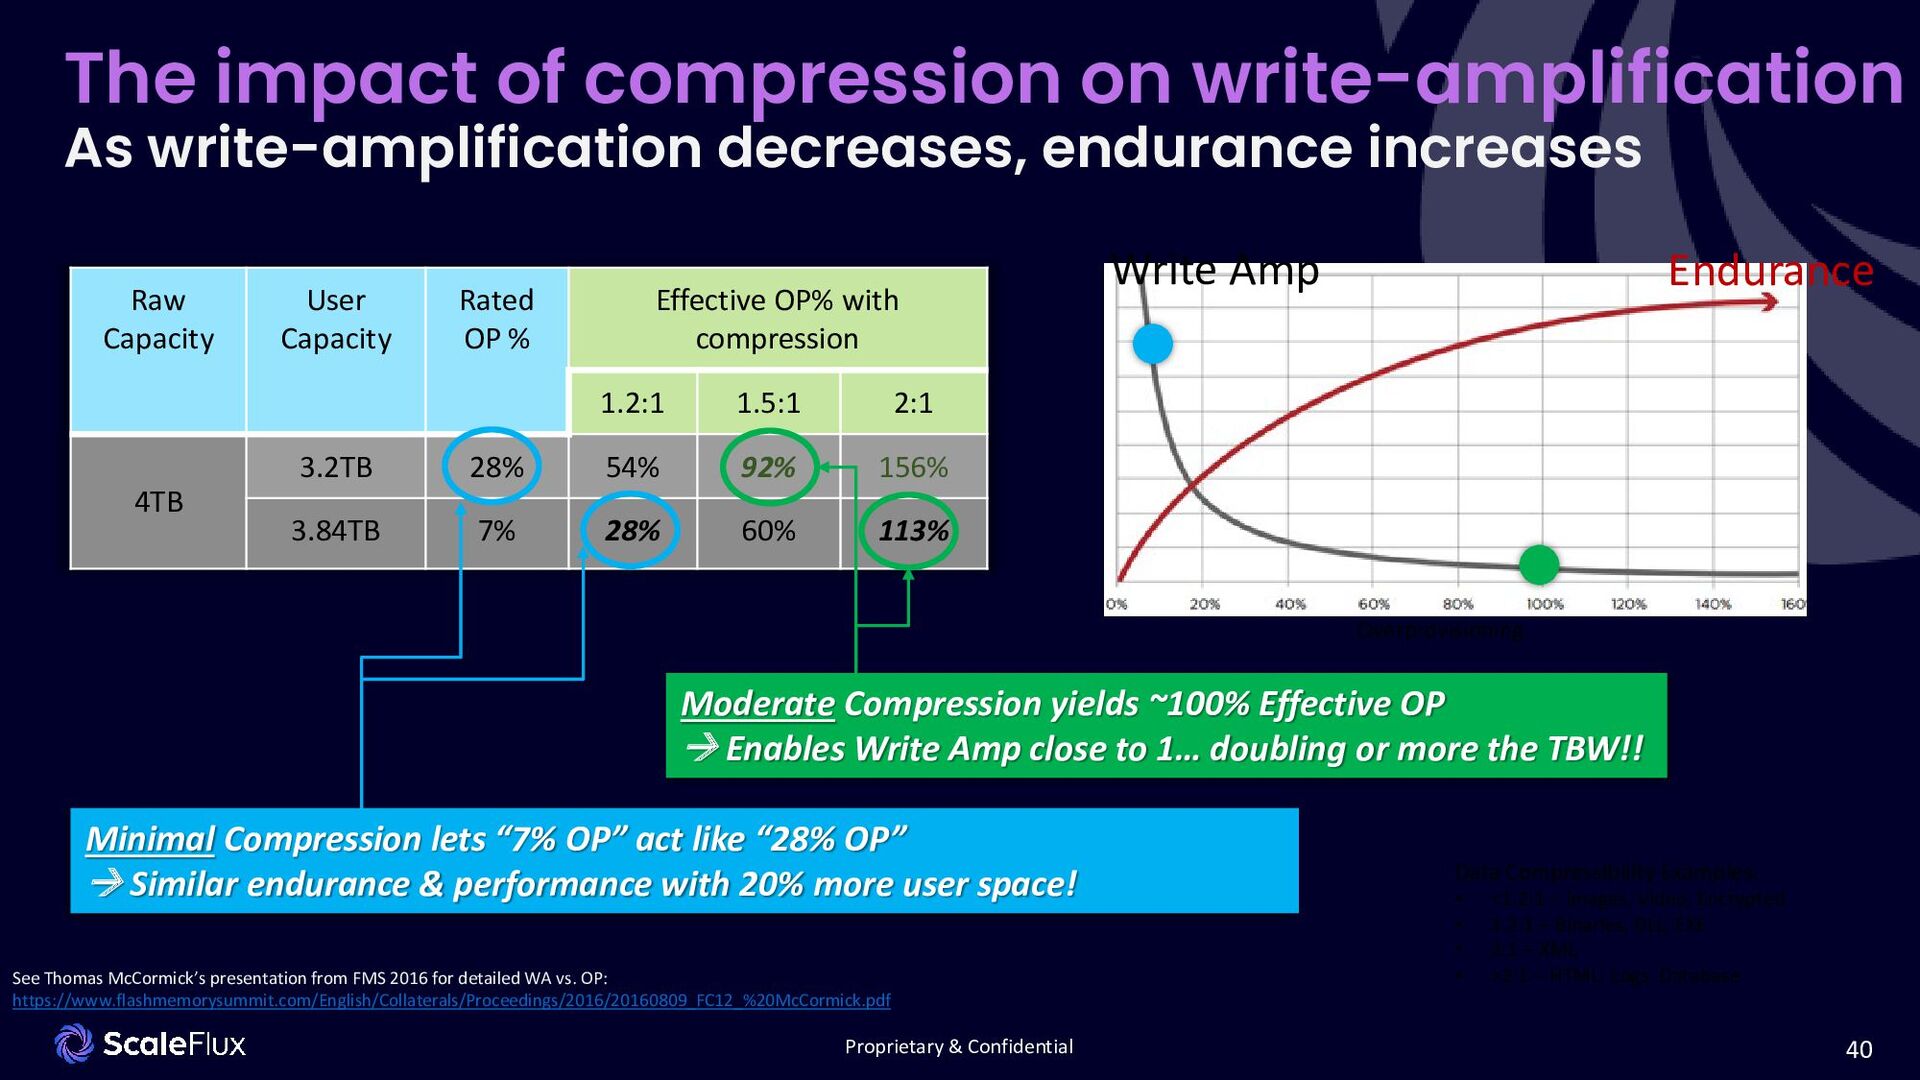
As write-amplification decreases, endurance increases Raw Capacity User Capacity Rated OP % Effective OP% with compression 1.2:1 1.5:1 2:1 4TB 3.2TB 28% 54% 92% 156% 3.84TB 7% 28% 60% 113% Minimal Compression lets “7% OP” act like “28% OP” Similar endurance & performance with 20% more user space! Moderate Compression yields ~100% Effective OP Enables Write Amp close to 1… doubling or more the TBW!! See Thomas McCormick’s presentation from FMS 2016 for detailed WA vs. OP: https://www.flashmemorysummit.com/English/Collaterals/Proceedings/2016/20160809_FC12_%20McCormick.pdf Write Amp Overprovisioning Endurance Data Compressibility Examples: • <1.2:1 – Images, Video, Encrypted • 1.2:1 – Binaries, DLL, EXE • 2:1 – XML • >2:1 – HTML, Logs, Database
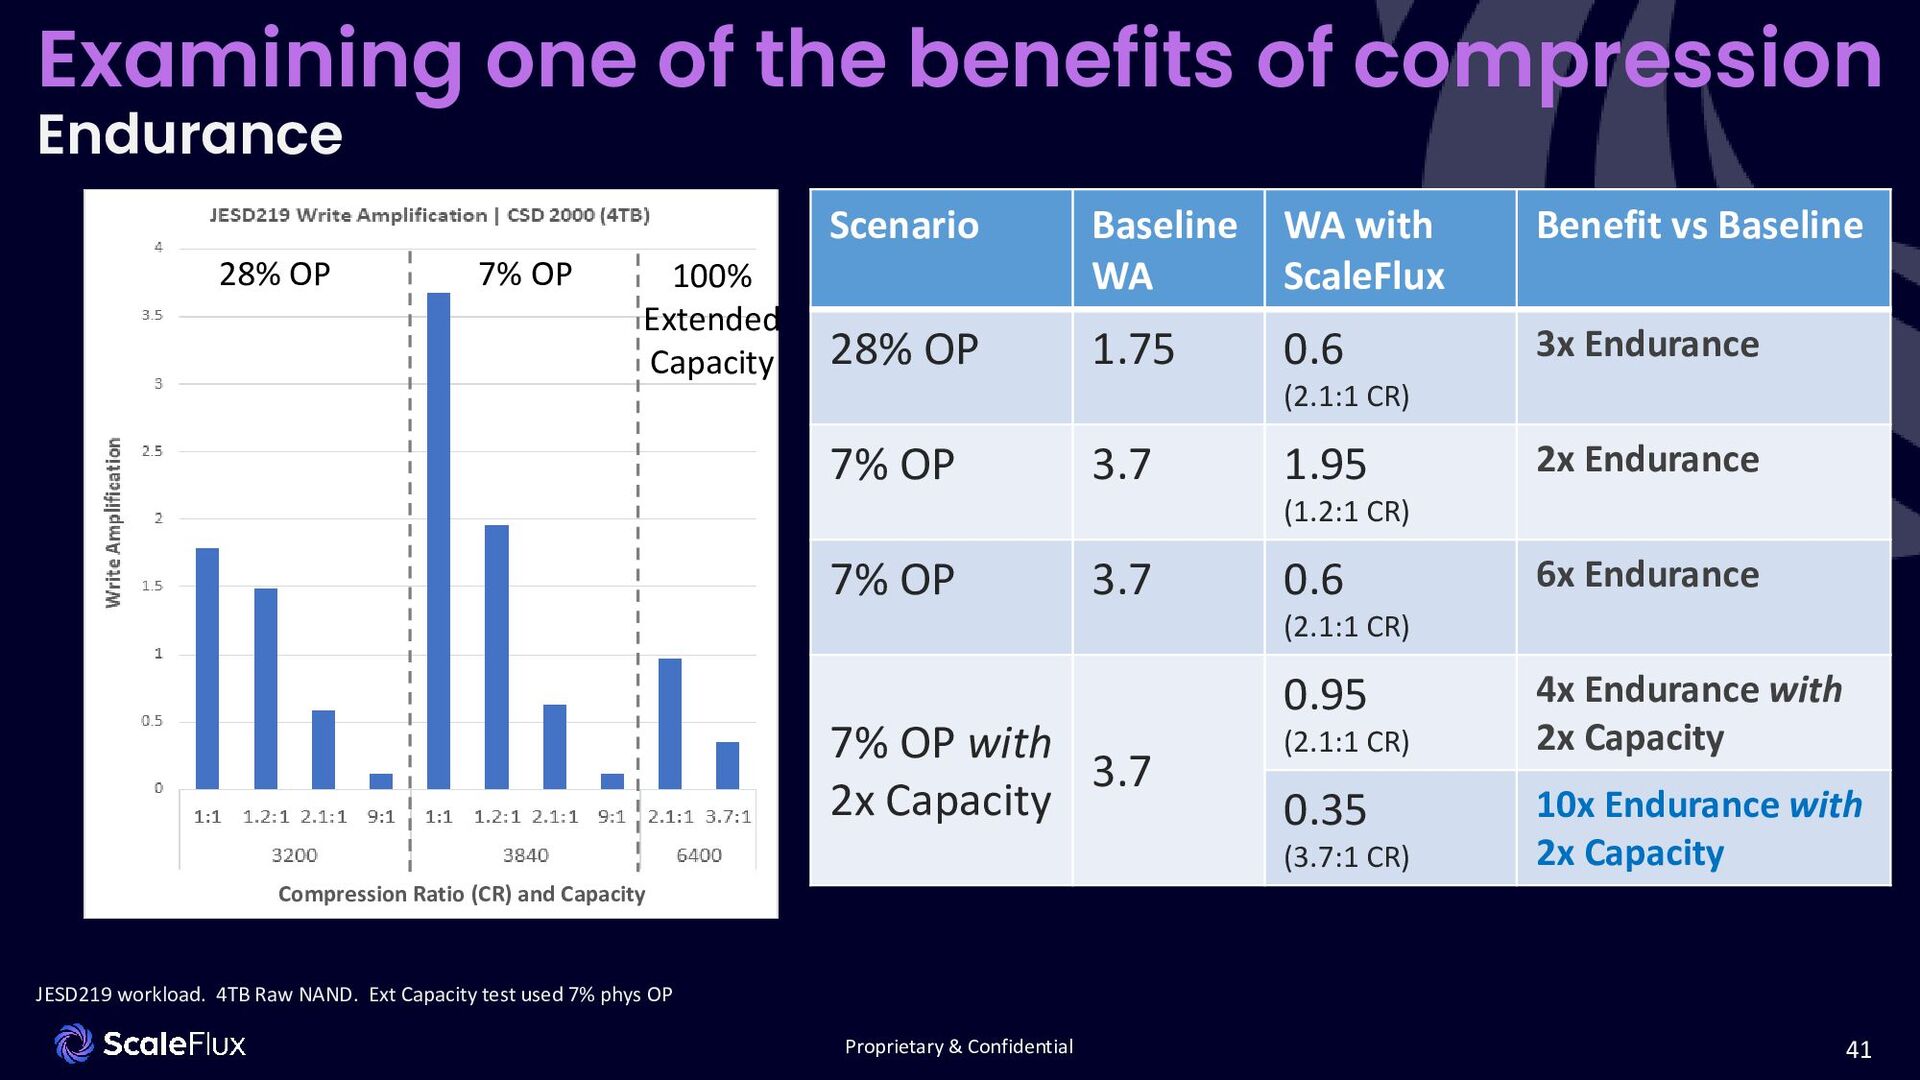
compression Endurance JESD219 workload. 4TB Raw NAND. Ext Capacity test used 7% phys OP Scenario Baseline WA WA with ScaleFlux Benefit vs Baseline 28% OP 1.75 0.6 (2.1:1 CR) 3x Endurance 7% OP 3.7 1.95 (1.2:1 CR) 2x Endurance 7% OP 3.7 0.6 (2.1:1 CR) 6x Endurance 7% OP with 2x Capacity 3.7 0.95 (2.1:1 CR) 4x Endurance with 2x Capacity 0.35 (3.7:1 CR) 10x Endurance with 2x Capacity 28% OP 7% OP 100% Extended Capacity Compression Ratio (CR) and Capacity