that occupy a large amount of traffic ▪ A heavy hitter could correspond to an individual flow or connection ▪ It could also be an aggregation of multiple flows/connections that share some common property, but which themselves may not be heavy hitters ▪ It spends lots of time & lots of memory to analyze HHs Heavy Hitters (HHs)
some properties of HH ▪ E.g., IP prefix ▪ Aggregations can be defined on one or more dimensions ▪ E.g., src/dest IP address prefix, src/dst port, protocol Hierarchical Heavy Hitters (HHHs)
the acronym of Center for Applied Internet Data Analysis ▪ Hosted in UC San Diego ▪ CAIDA Traffic is a data set of 10G traces collected from high-speed monitors on a commercial backbone links ▪ From 2008 to 2019, provided in PCAP format ▪ Often used in academic for fair evaluation ▪ Anyone can apply for it, but NDA required CAIDA Traffic
▪ Conducted in 2020.01, which includes ▪ 4 small small networks (< 1K hosts) ▪ 6 medium networks (1 ~ 10 K hosts) ▪ 4 large networks (10 ~ 100K hosts) ▪ 5 extra-large networks (> 100K hosts) ▪ Common problems: ▪ Low throughput ▪ Intermittent events ▪ Single user only problem Survey with ISPs, DCs, Enterprises
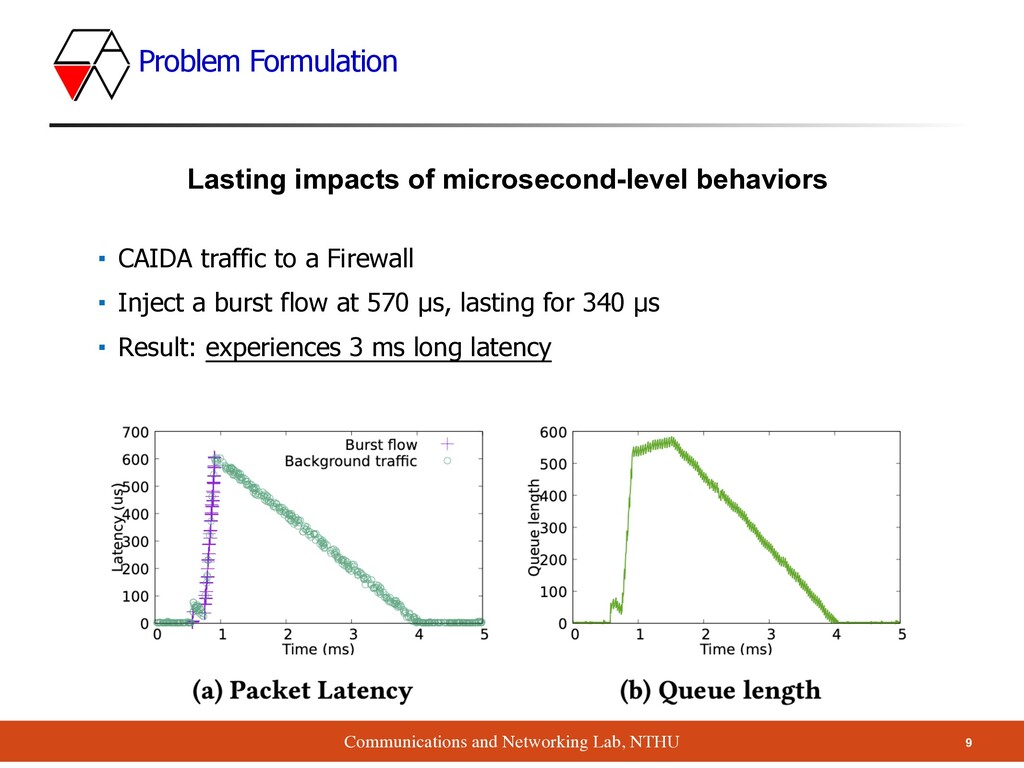
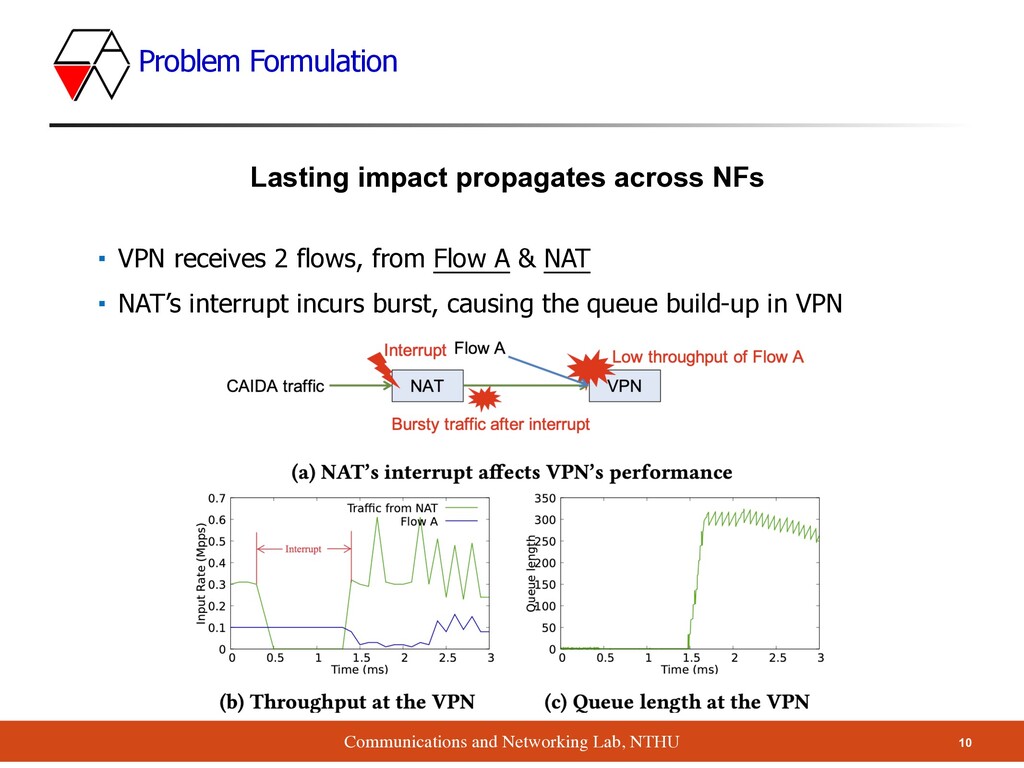
traffic to a Firewall ▪ Inject a burst flow at 570 µs, lasting for 340 µs ▪ Result: experiences 3 ms long latency Lasting impacts of microsecond-level behaviors
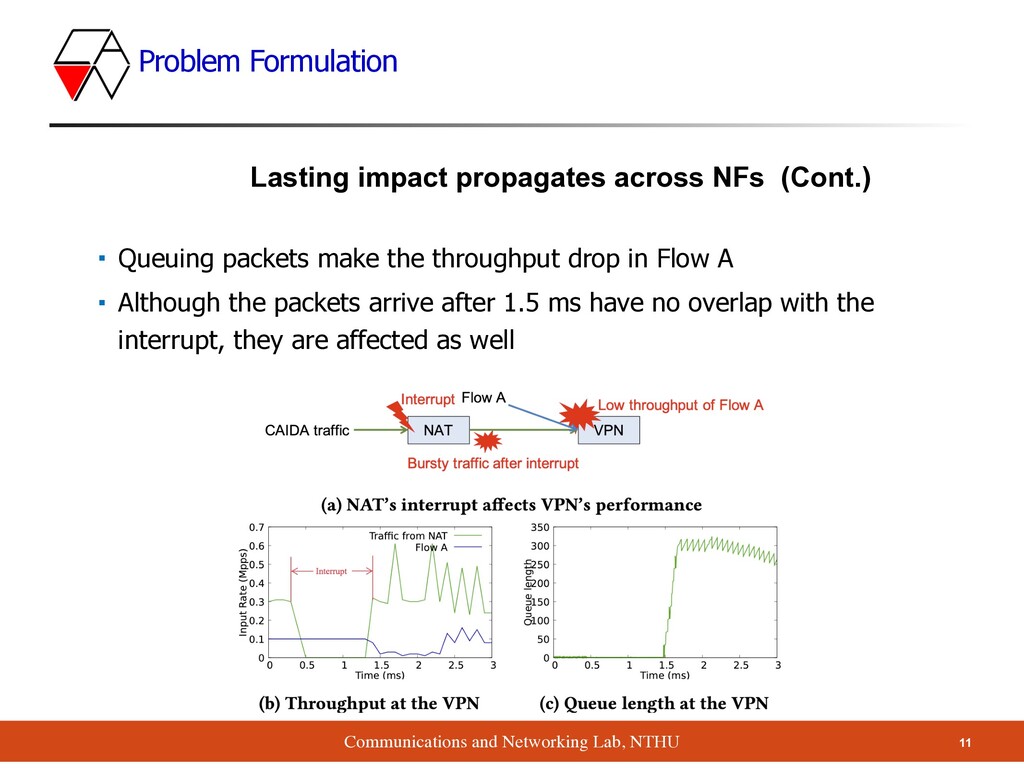
propagates across NFs (Cont.) ▪ Queuing packets make the throughput drop in Flow A ▪ Although the packets arrive after 1.5 ms have no overlap with the interrupt, they are affected as well
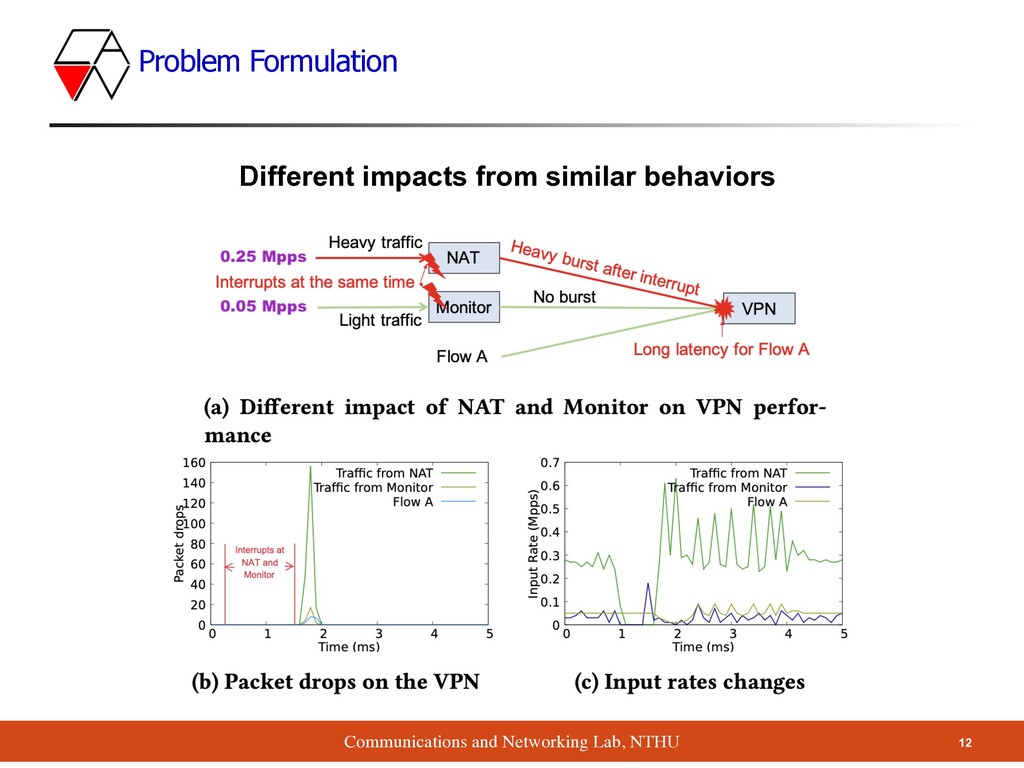
NAT & Monitor occur interrupt at the same time, all of the flows experience different levels of packets loss ▪ Who is the main culprit? NAT or Monitor? ▪ It’s hard to identify unless we refer to the input rate of VPN ▪ The authors want to quantify the impact of these behaviors Different impacts from similar behaviors (Cont.)
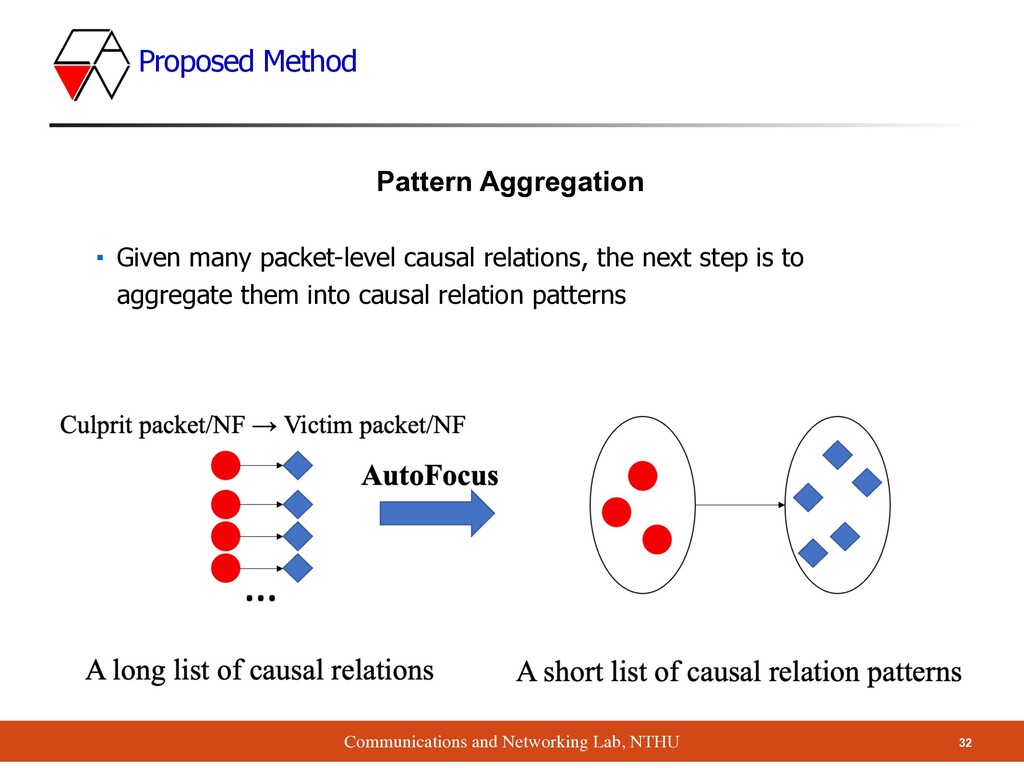
1: impact propagation over time ▪ Local diagnosis based on queuing period ▪ Challenge 2: impact propagation across NFs ▪ Propagation diagnosis based on timespan analysis ▪ Challenge 3: too many root causes for too many victim packets ▪ Pattern aggregation: use AutoFocus to aggregate diagnosis results Roadmap
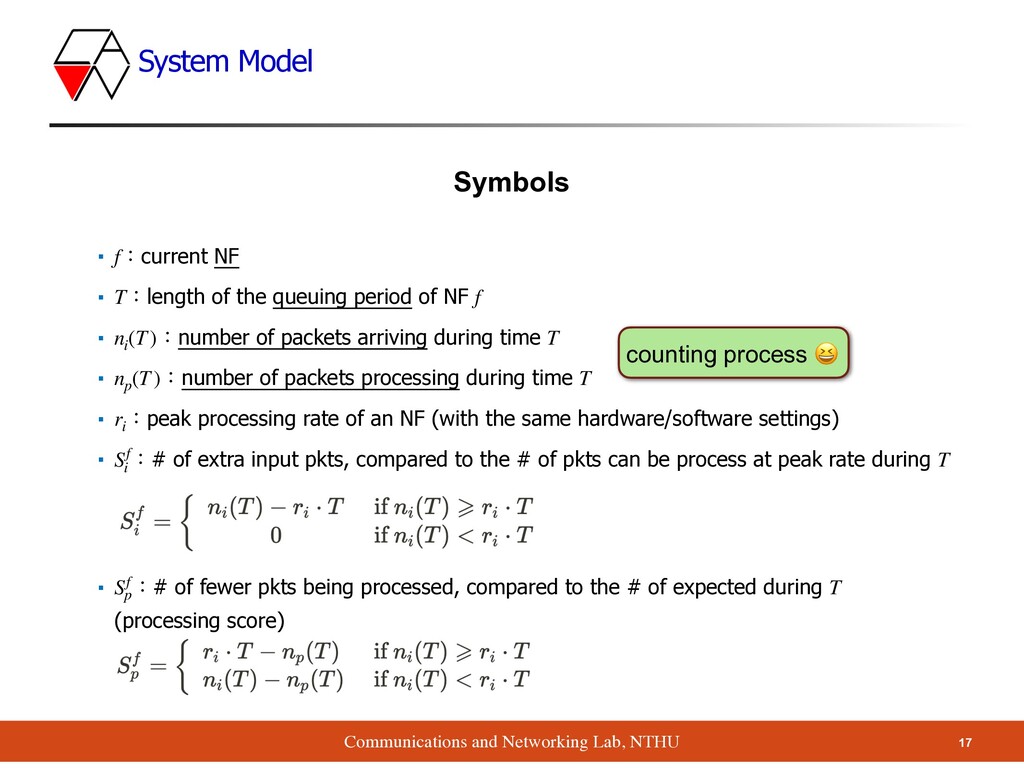
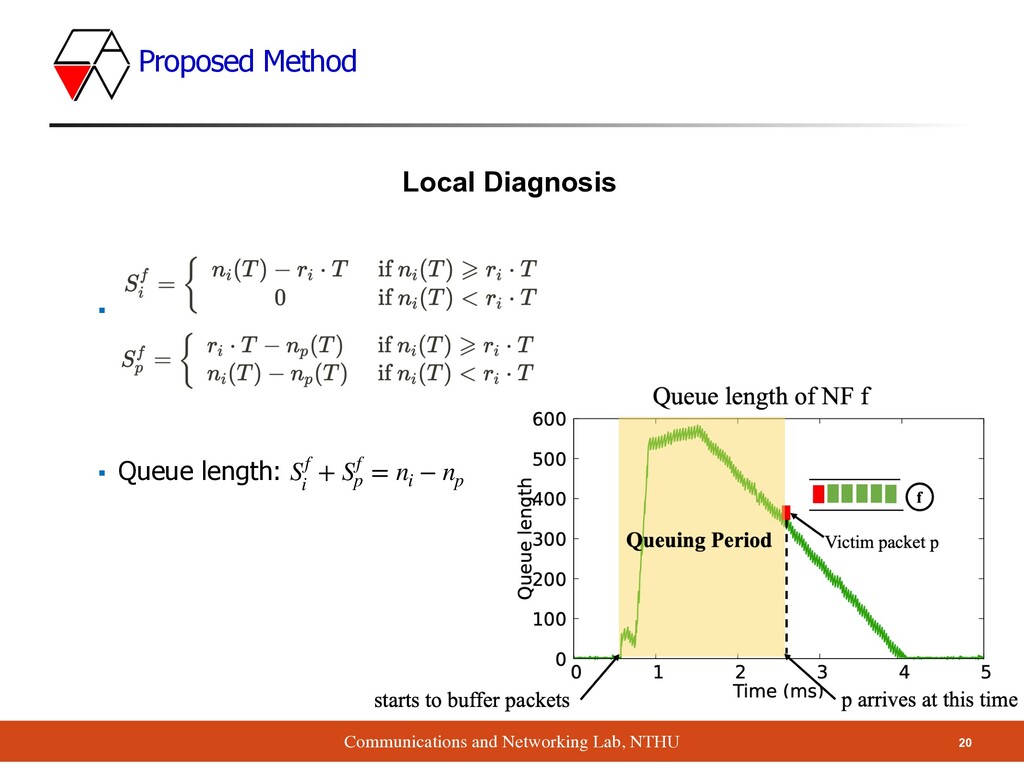
NF ▪ :length of the queuing period of NF ▪ :number of packets arriving during time ▪ :number of packets processing during time ▪ :peak processing rate of an NF (with the same hardware/software settings) ▪ :# of extra input pkts, compared to the # of pkts can be process at peak rate during ▪ :# of fewer pkts being processed, compared to the # of expected during (processing score) f T f ni (T) T np (T) T ri Sf i T Sf p T Symbols counting process 😆
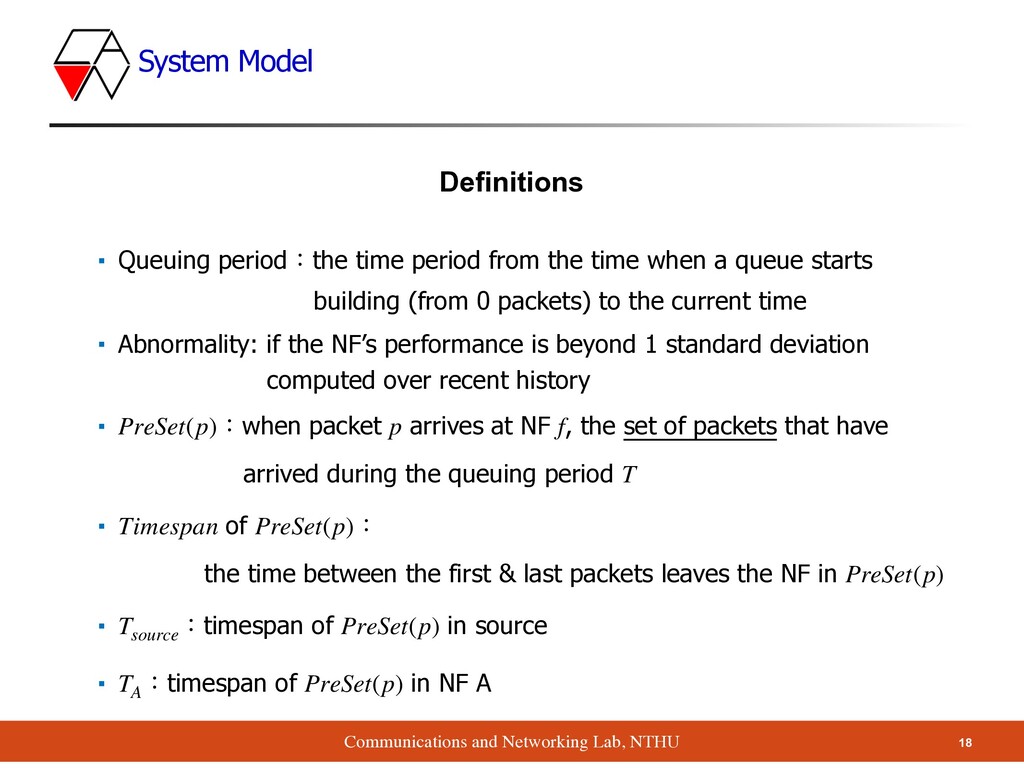
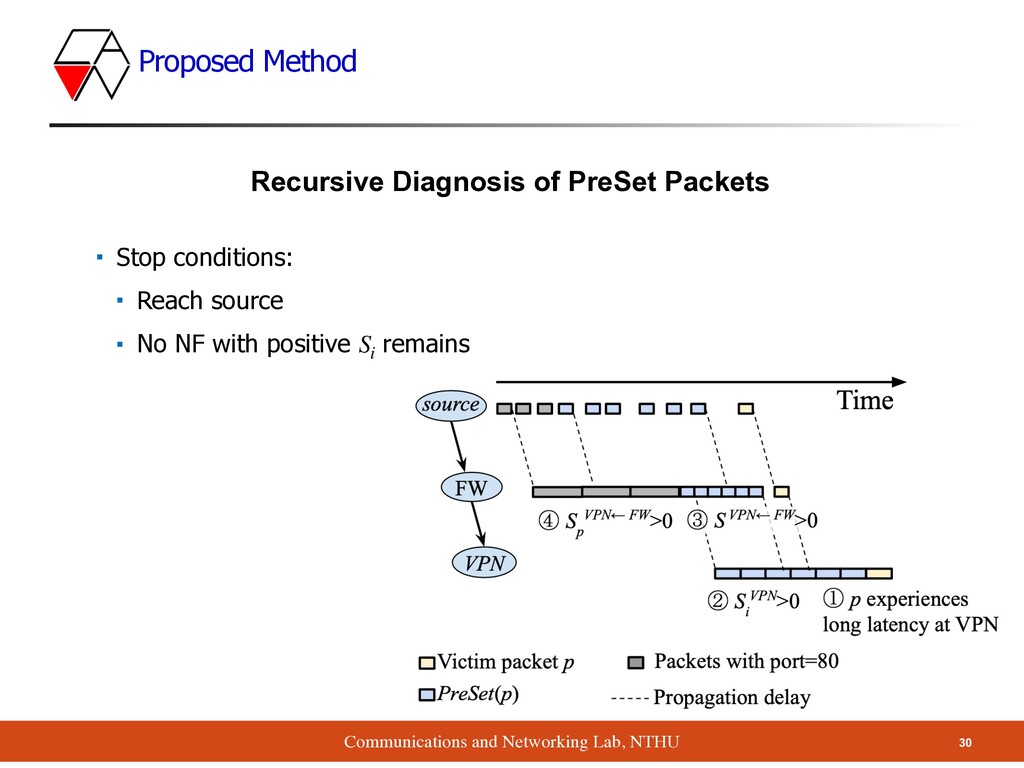
time period from the time when a queue starts building (from 0 packets) to the current time ▪ Abnormality: if the NF’s performance is beyond 1 standard deviation computed over recent history ▪ :when packet arrives at NF , the set of packets that have arrived during the queuing period ▪ of : the time between the first & last packets leaves the NF in ▪ :timespan of in source ▪ :timespan of in NF A Queuing period PreSet(p) p f T Timespan PreSet(p) PreSet(p) Tsource PreSet(p) TA PreSet(p) Definitions
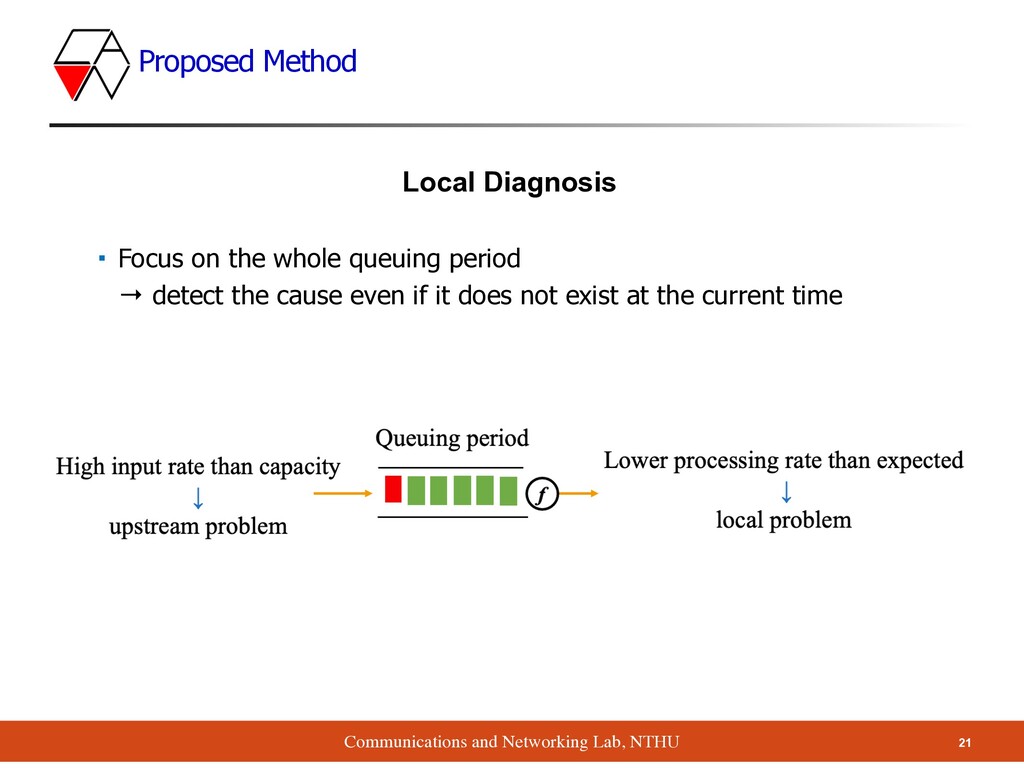
input rate is higher than peak processing rate → queue must build up ▪ Reasons: ▪ Upstream NFs ▪ Input source ▪ We’re going to discuss the causal relations among NFs Sf i > 0 Propagation Diagnosis
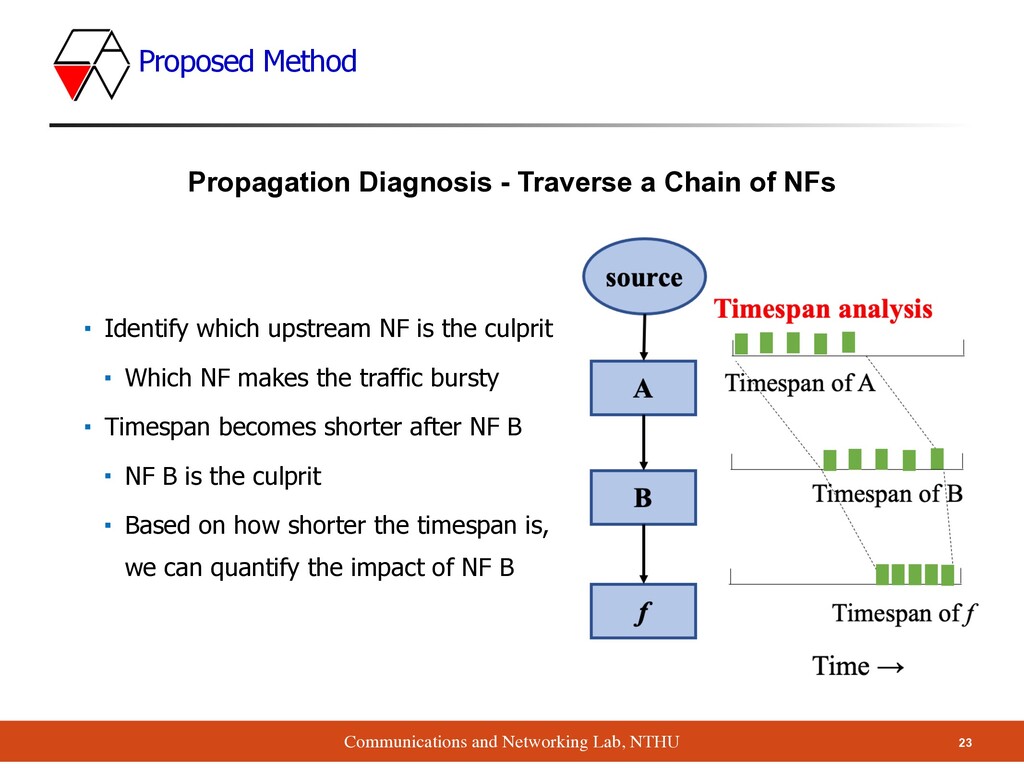
which upstream NF is the culprit ▪ Which NF makes the traffic bursty ▪ Timespan becomes shorter after NF B ▪ NF B is the culprit ▪ Based on how shorter the timespan is, we can quantify the impact of NF B Propagation Diagnosis - Traverse a Chain of NFs
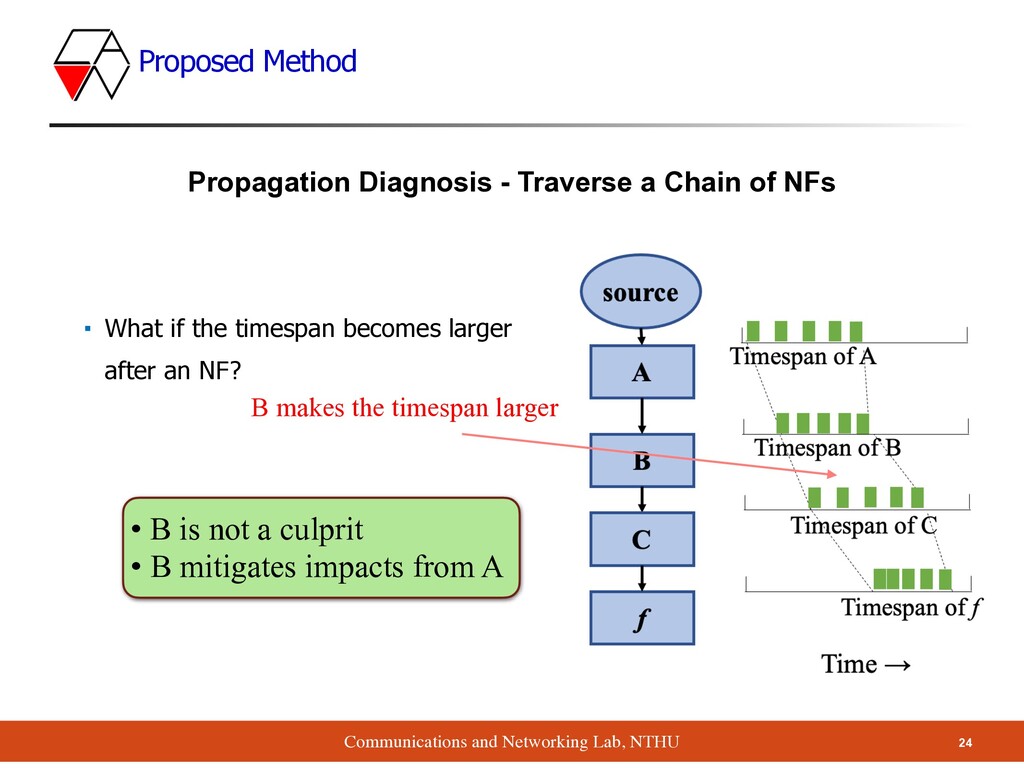
if the timespan becomes larger after an NF? Propagation Diagnosis - Traverse a Chain of NFs B makes the timespan larger • B is not a culprit • B mitigates impacts from A
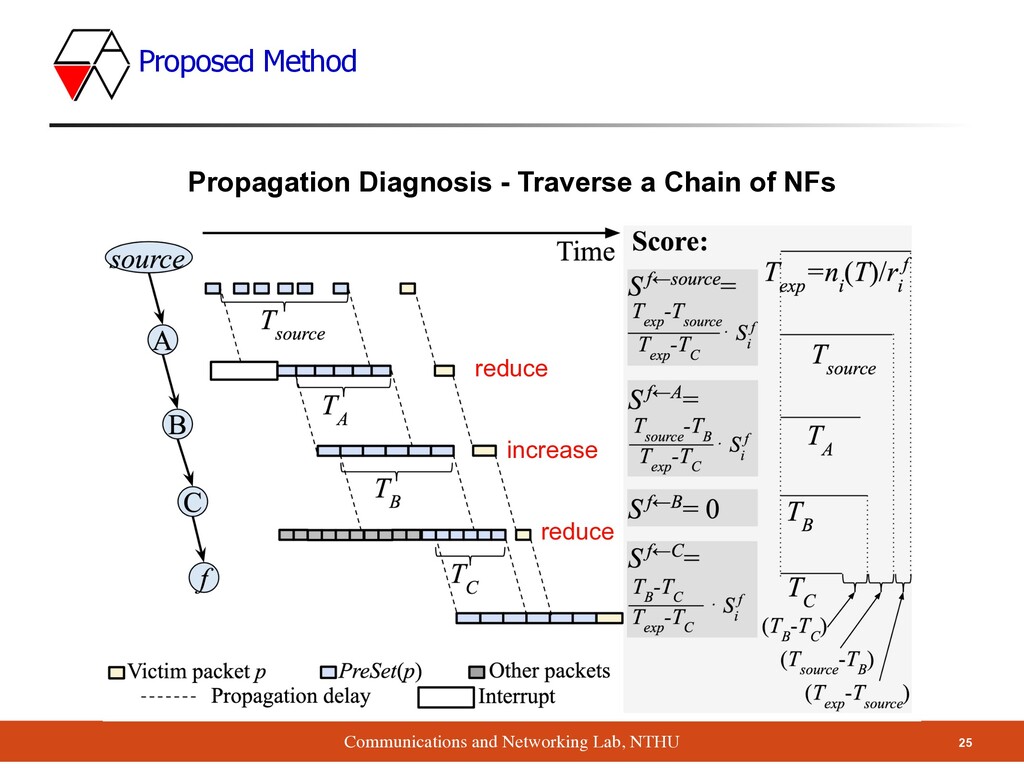
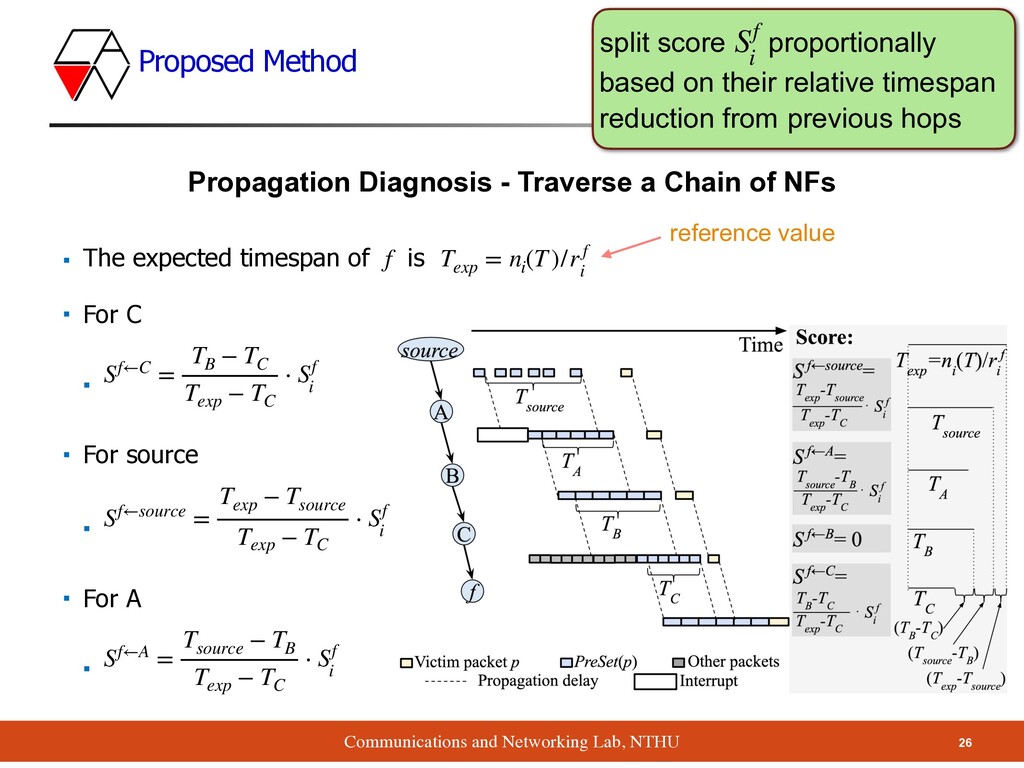
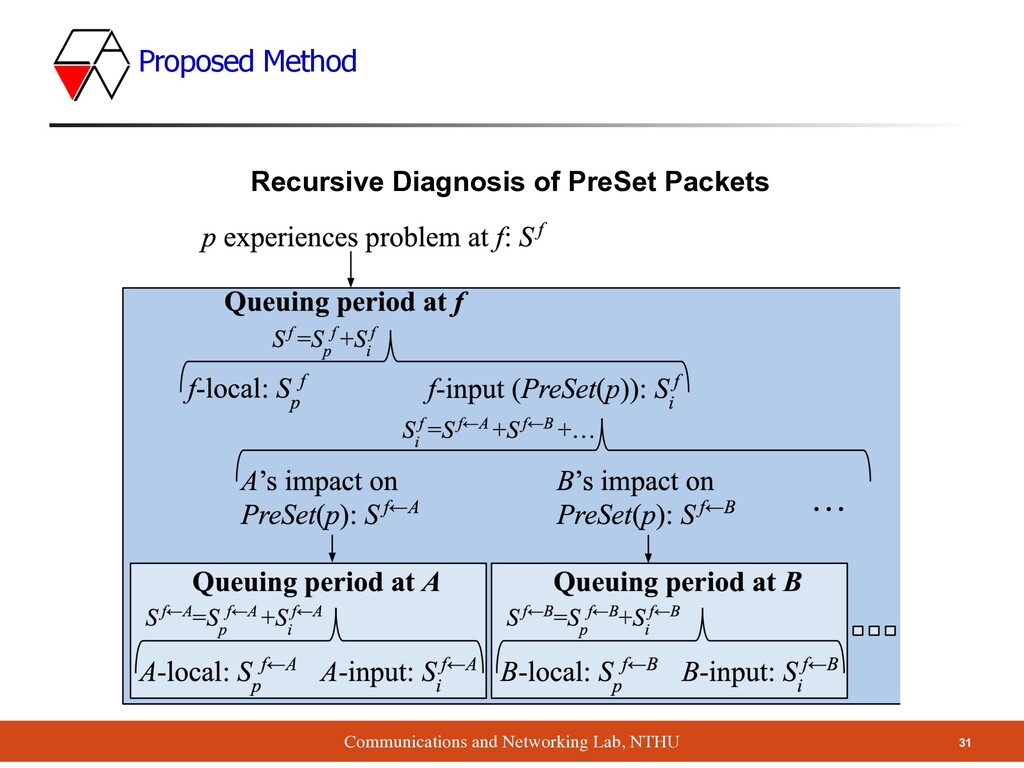
- Traverse a Chain of NFs ▪ The expected timespan of is ▪ For C ▪ ▪ For source ▪ ▪ For A ▪ f Texp = ni (T)/r f i Sf←C = TB − TC Texp − TC ⋅ Sf i Sf←source = Texp − Tsource Texp − TC ⋅ Sf i Sf←A = Tsource − TB Texp − TC ⋅ Sf i reference value split score proportionally based on their relative timespan reduction from previous hops Sf i
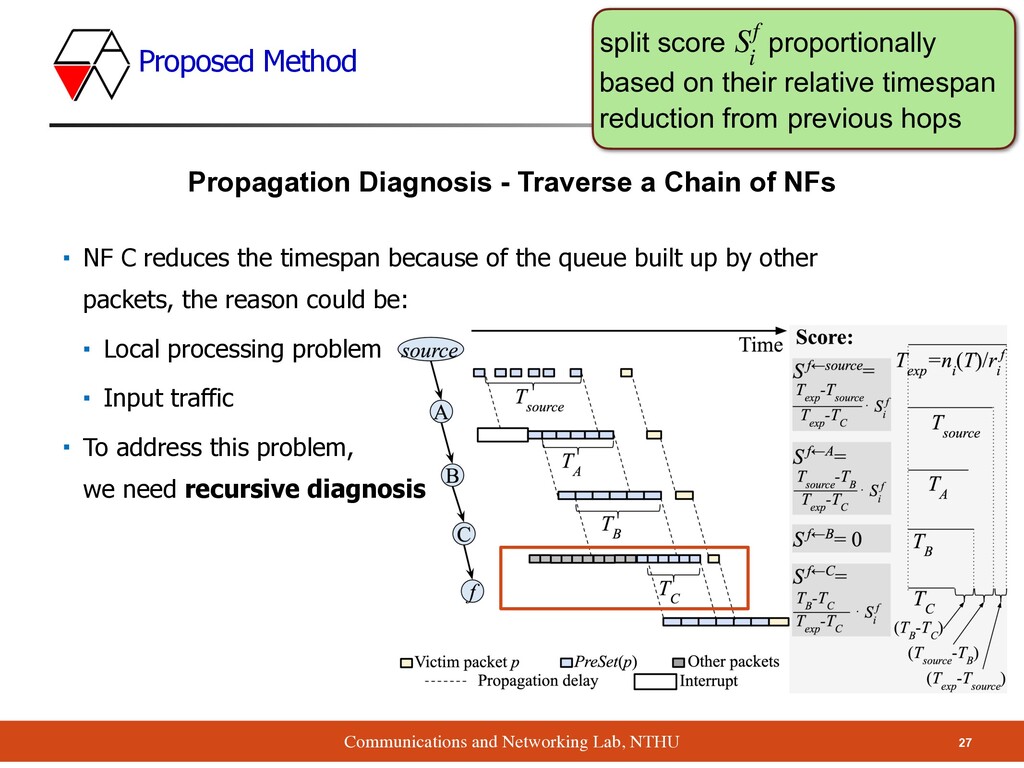
- Traverse a Chain of NFs ▪ NF C reduces the timespan because of the queue built up by other packets, the reason could be: ▪ Local processing problem ▪ Input traffic ▪ To address this problem, we need recursive diagnosis split score proportionally based on their relative timespan reduction from previous hops Sf i
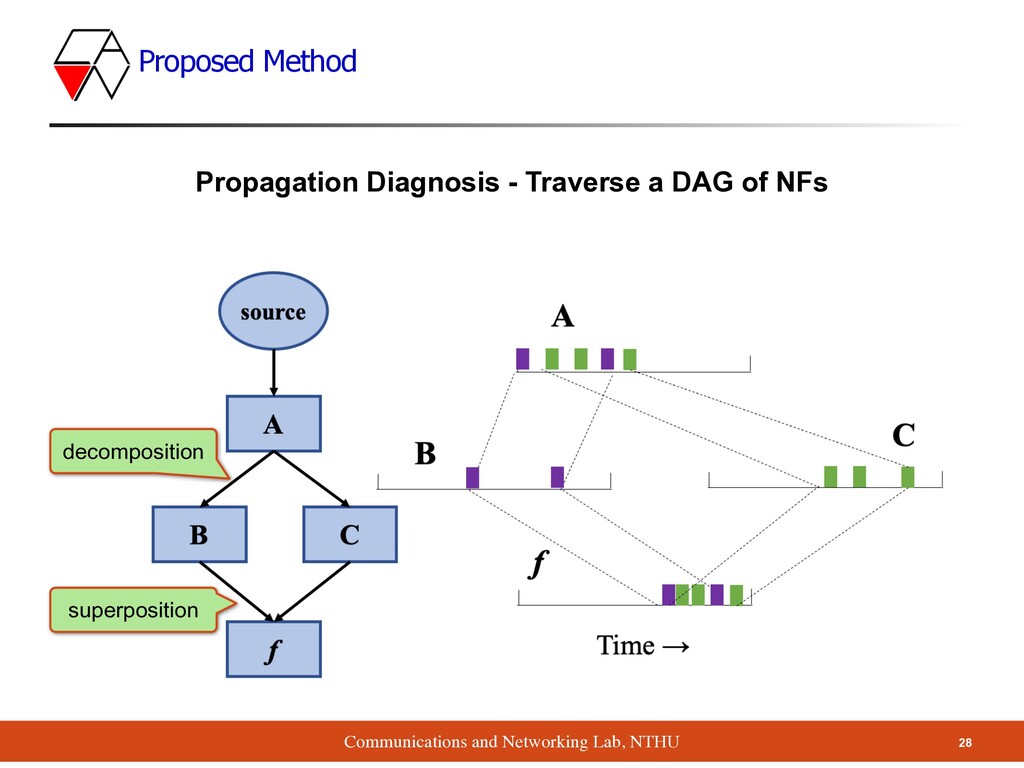
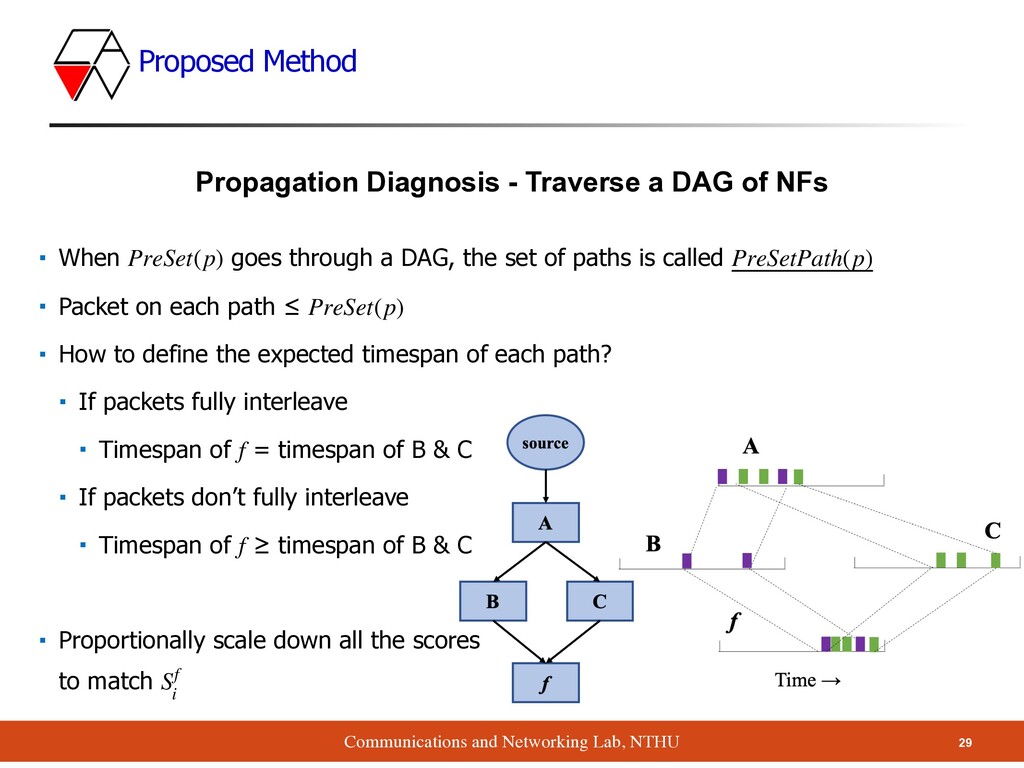
- Traverse a DAG of NFs ▪ When goes through a DAG, the set of paths is called ▪ Packet on each path ≤ ▪ How to define the expected timespan of each path? ▪ If packets fully interleave ▪ Timespan of = timespan of B & C ▪ If packets don’t fully interleave ▪ Timespan of ≥ timespan of B & C ▪ Proportionally scale down all the scores to match PreSet(p) PreSetPath(p) PreSet(p) f f Sf i
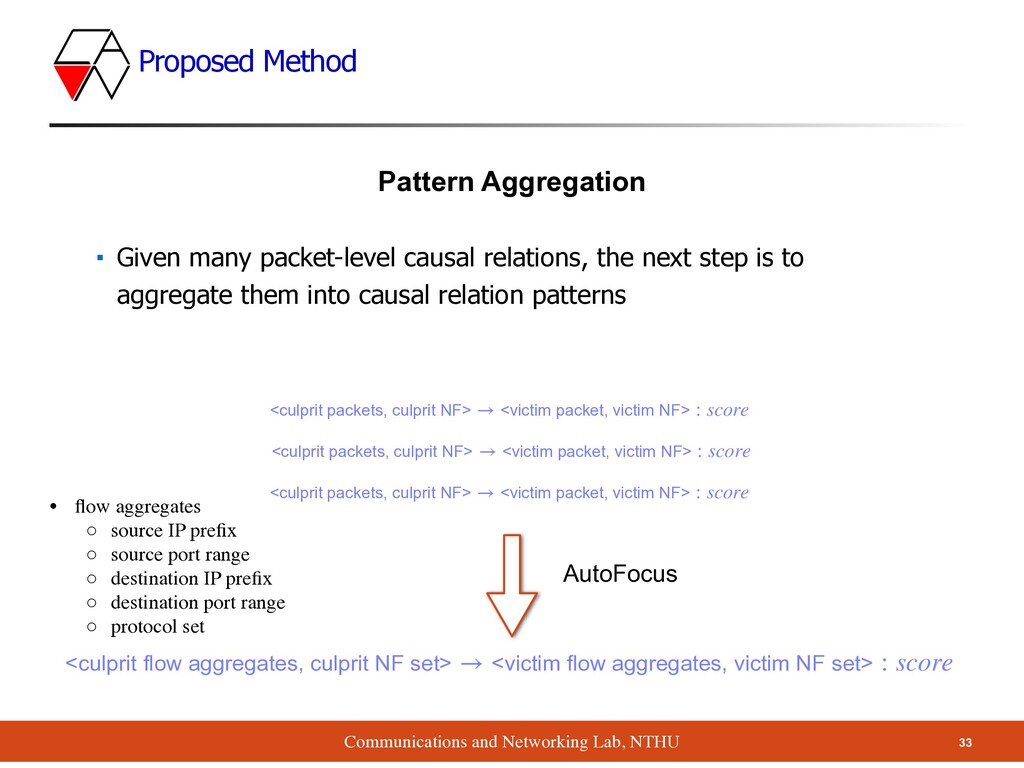
▪ Given many packet-level causal relations, the next step is to aggregate them into causal relation patterns <culprit packets, culprit NF> → <victim packet, victim NF> : score <culprit flow aggregates, culprit NF set> → <victim flow aggregates, victim NF set> : score <culprit packets, culprit NF> → <victim packet, victim NF> : score <culprit packets, culprit NF> → <victim packet, victim NF> : score AutoFocus • fl ow aggregate s ◦ source IP pre fi x ◦ source port rang e ◦ destination IP pre fi x ◦ destination port rang e ◦ protocol set
Data collector (runtime) ▪ Instrument the DPDK lib’s I/O functions to collect required information ▪ About 200 LOC ▪ Diagnosis module (offline) ▪ Finding the causal relations of victim packets ▪ About 6000 LOC 34 Implementation
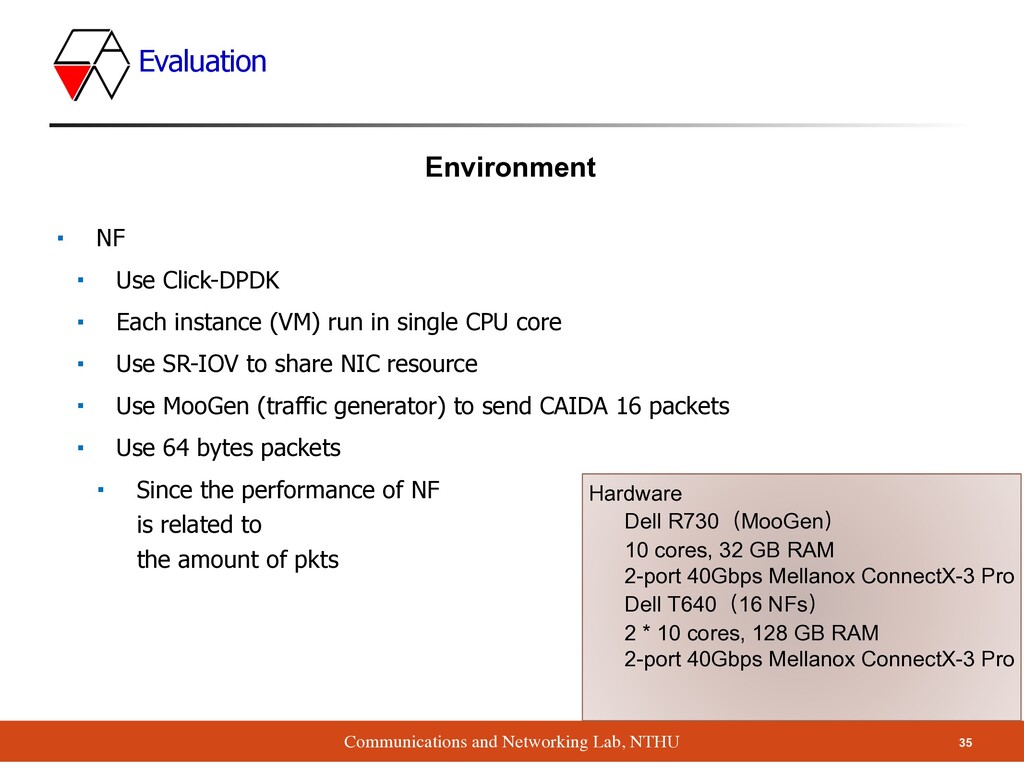
▪ Each instance (VM) run in single CPU core ▪ Use SR-IOV to share NIC resource ▪ Use MooGen (traffic generator) to send CAIDA 16 packets ▪ Use 64 bytes packets ▪ Since the performance of NF is related to the amount of pkts Hardware Dell R730(MooGen) 10 cores, 32 GB RAM 2-port 40Gbps Mellanox ConnectX-3 Pro Dell T640(16 NFs) 2 * 10 cores, 128 GB RAM 2-port 40Gbps Mellanox ConnectX-3 Pro 35 Evaluation Environment
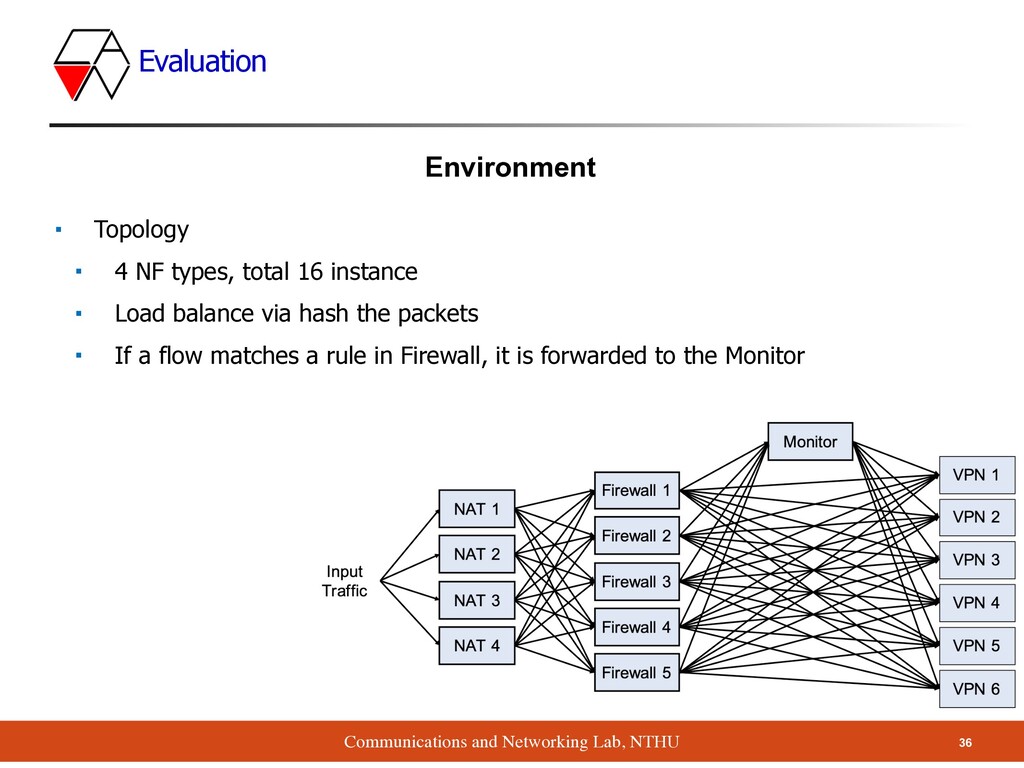
types, total 16 instance ▪ Load balance via hash the packets ▪ If a flow matches a rule in Firewall, it is forwarded to the Monitor 36 Evaluation Environment
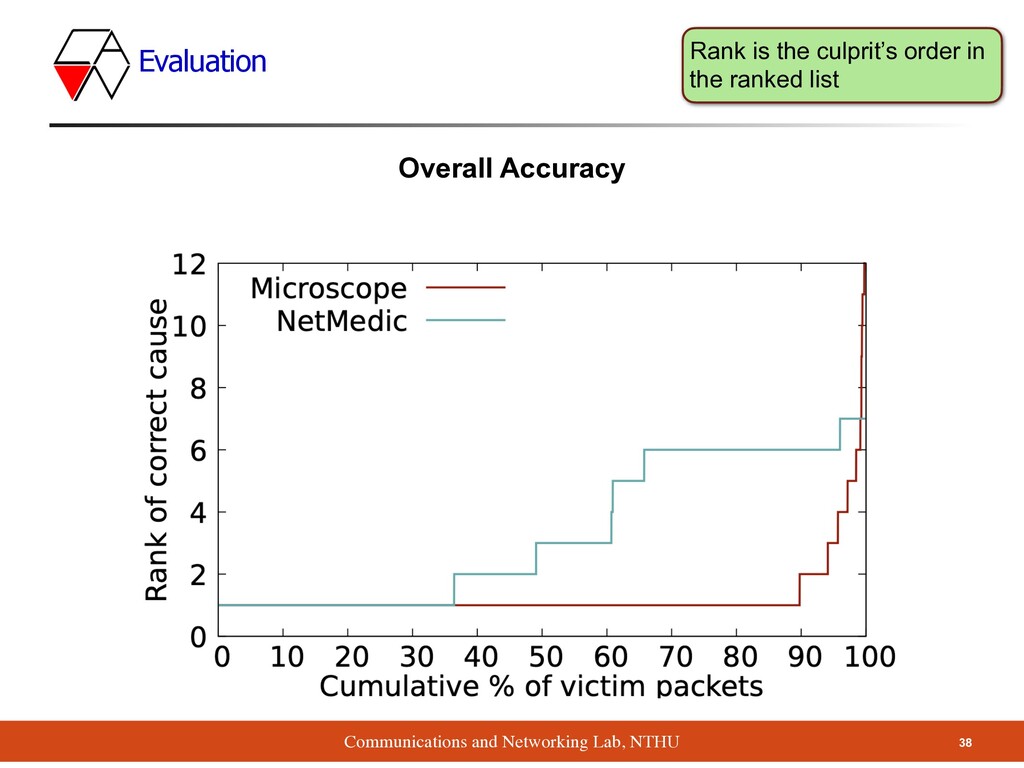
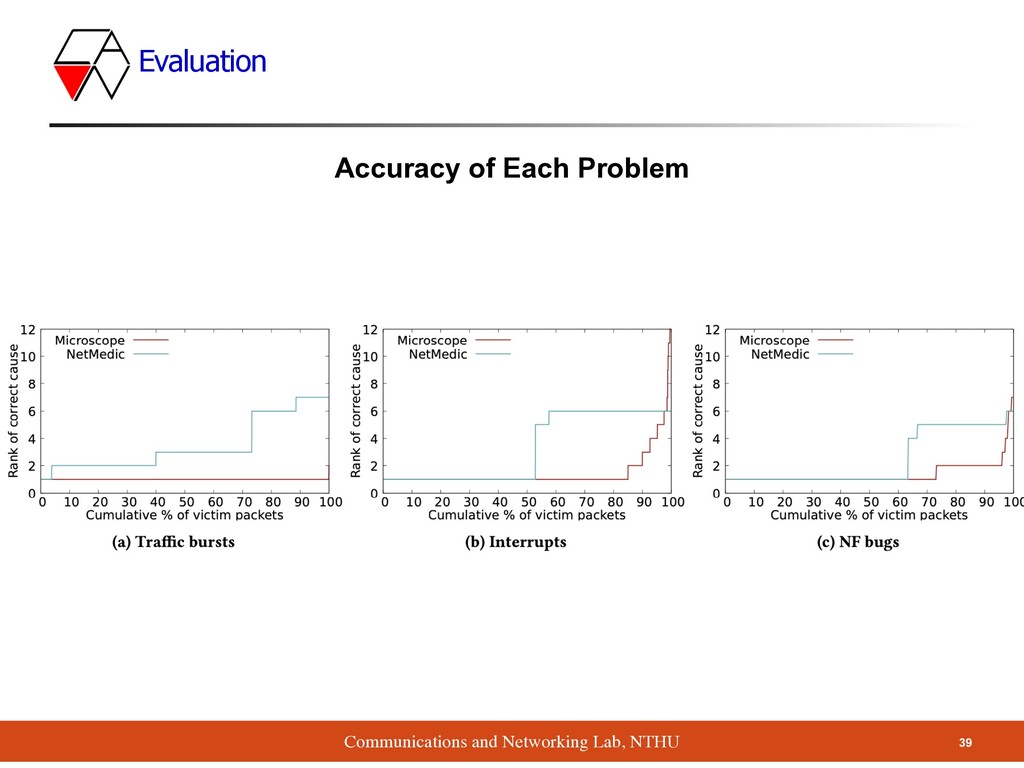
root cause of performance problem among NFs ▪ Method ▪ Take surveys on many companies ▪ Propose Microscope tool to analyze queue, without any access to NF’s code ▪ Result ▪ Diagnose the problems much more accurately than NetMedic 40 Conclusion
of leveraging queue to diagnose performance problems ▪ Take surveys on many companies to acquire the needs ▪ Cons ▪ Lack of descriptions & illustrations about "traverse a DAG of NFs" ▪ Didn’t indicate which part of the CAIDA traffic they use (5 second) 41 Pros & Cons