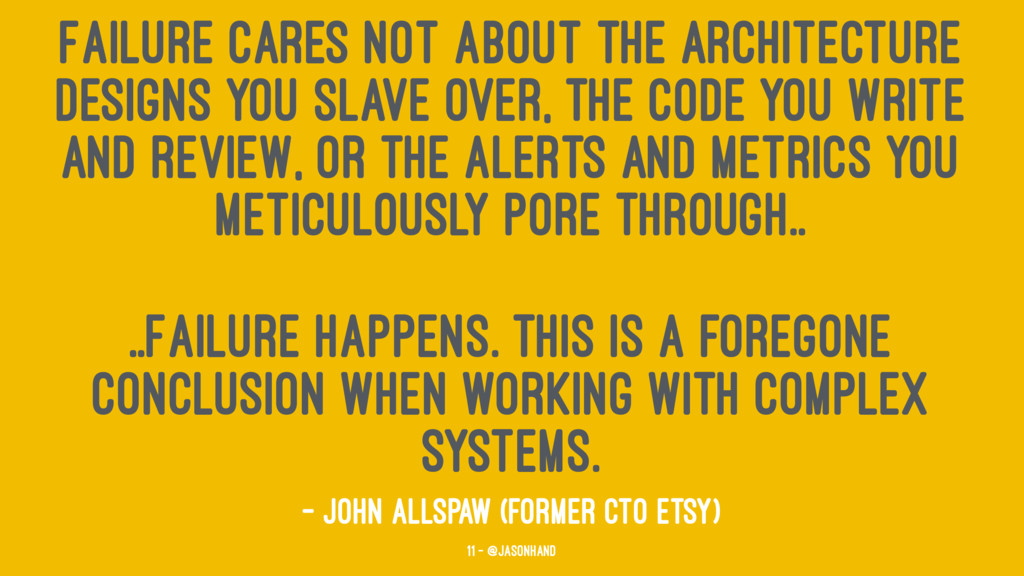
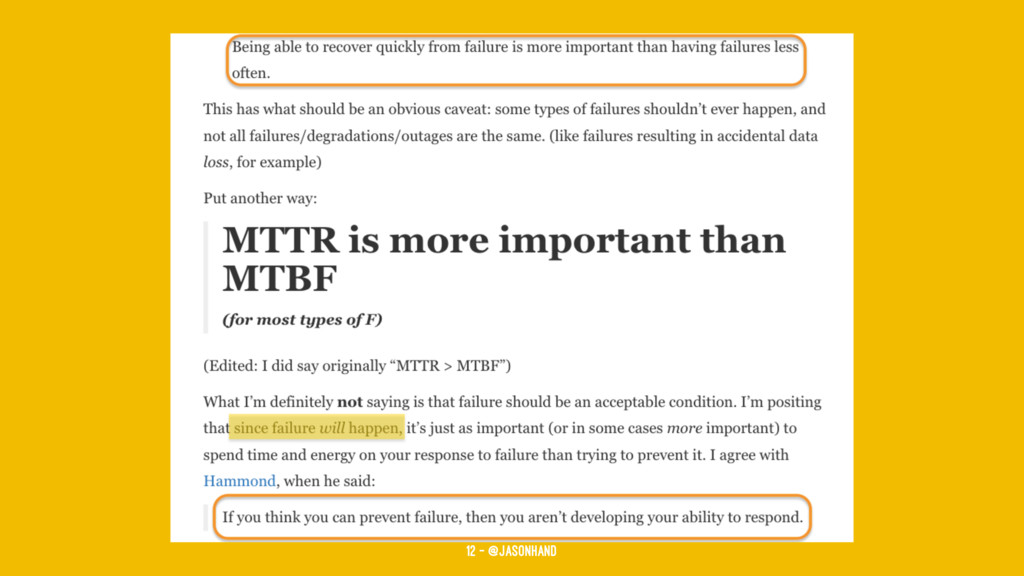
the code you write and review, or the alerts and metrics you meticulously pore through.. ..Failure happens. This is a foregone conclusion when working with complex systems. — John Allspaw (Former CTO Etsy) 11 — @jasonhand
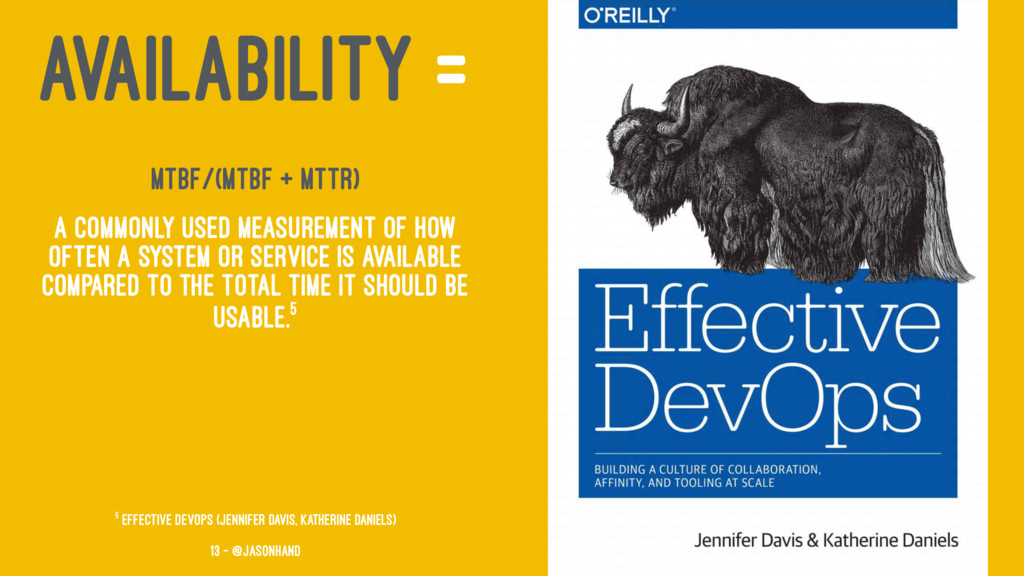
how often a system or service is available compared to the total time it should be usable.5 5 Effective DevOps (Jennifer Davis, Katherine Daniels) 13 — @jasonhand
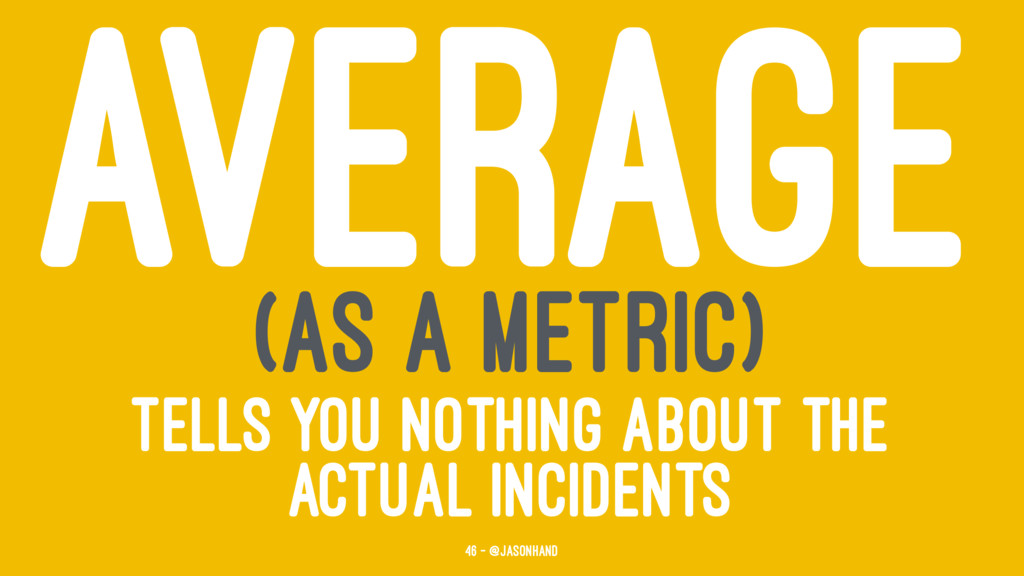
on the complexity and scale of systems. Furthermore, averages assume there is a normal event or that your data is a normal distribution.13 — Richart Thaler Average is a horrible metric for optimizing performance 13 (MisBehaving - The Making of Behavorial Economics) 49 — @jasonhand
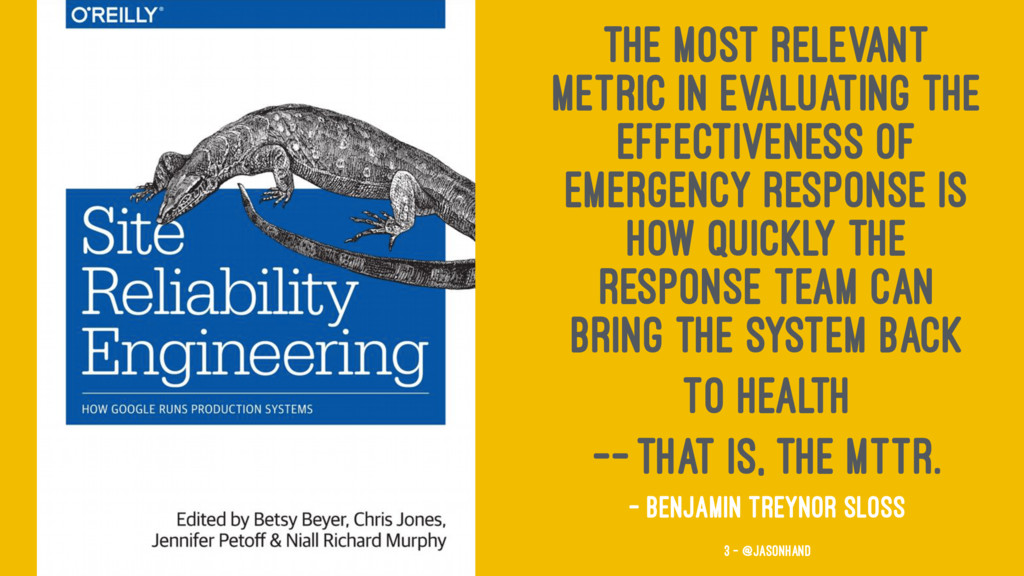
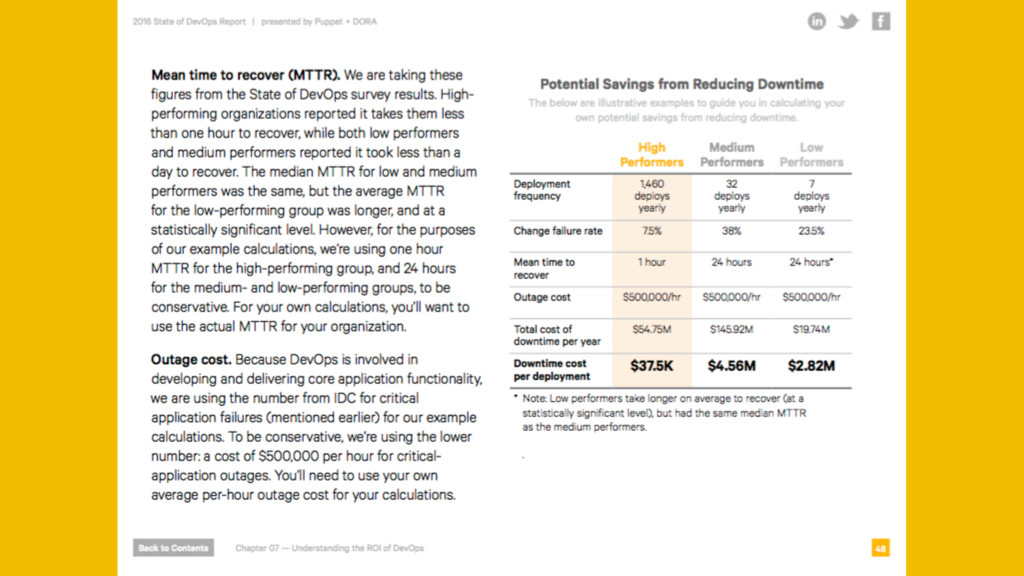
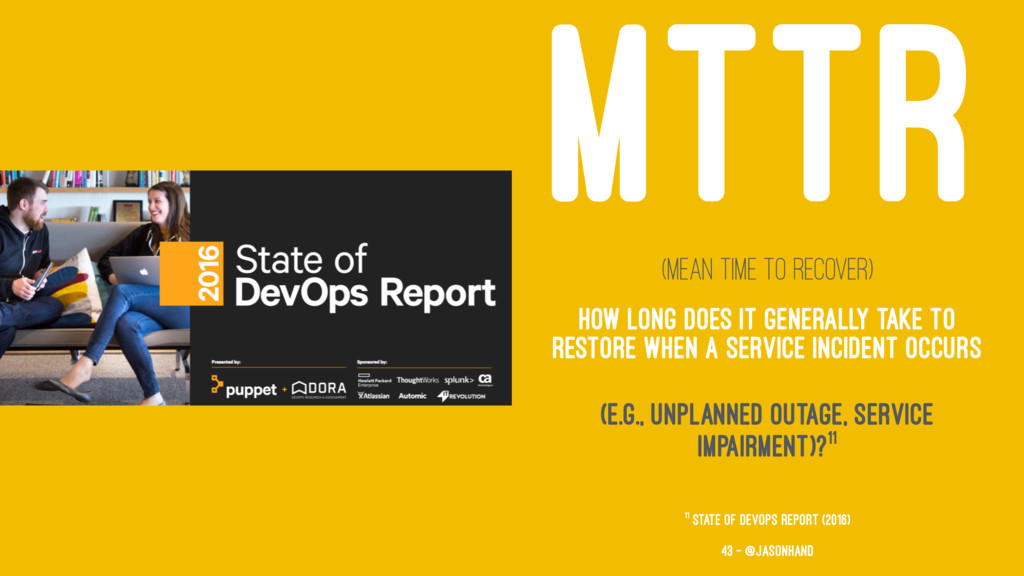
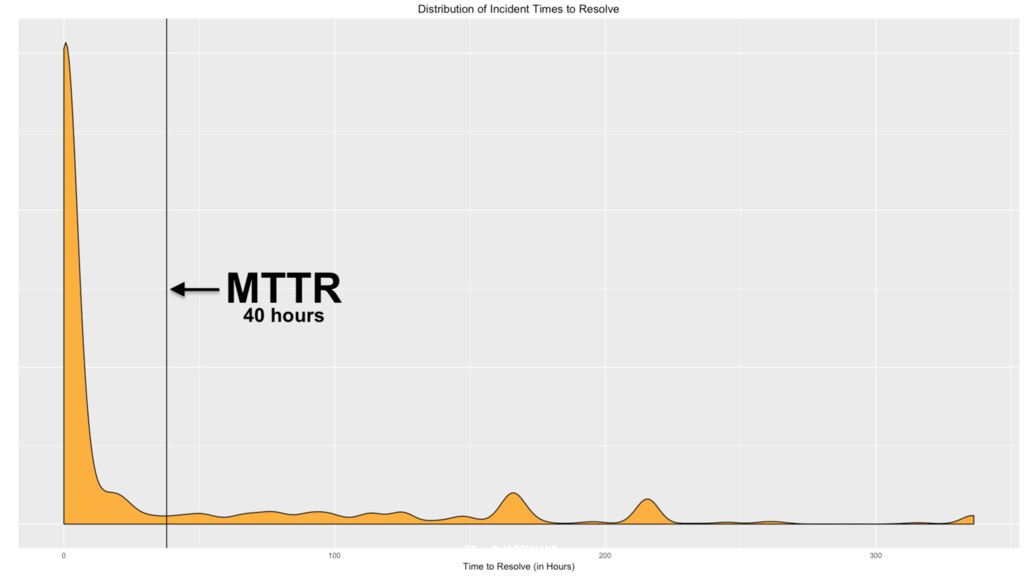
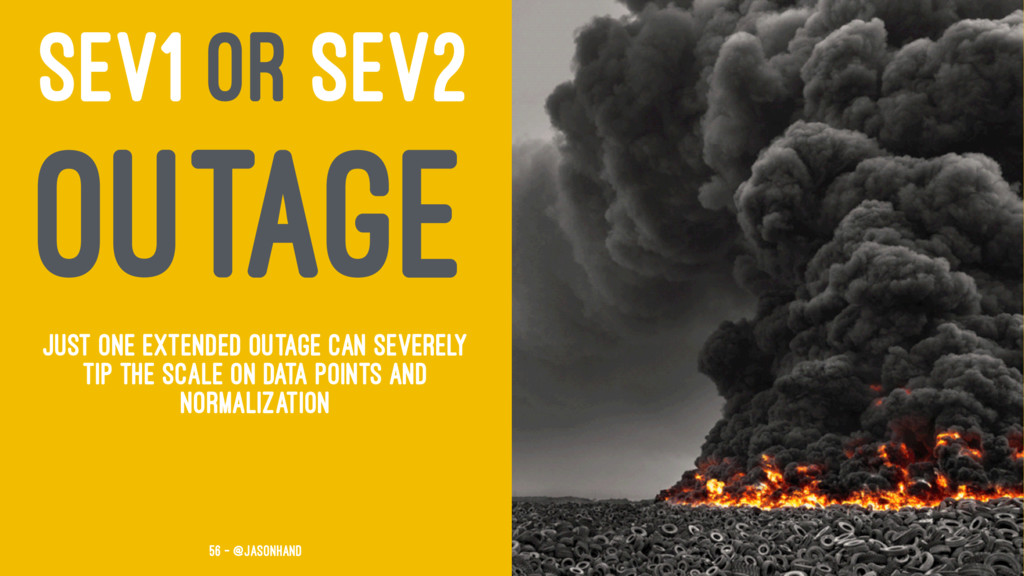
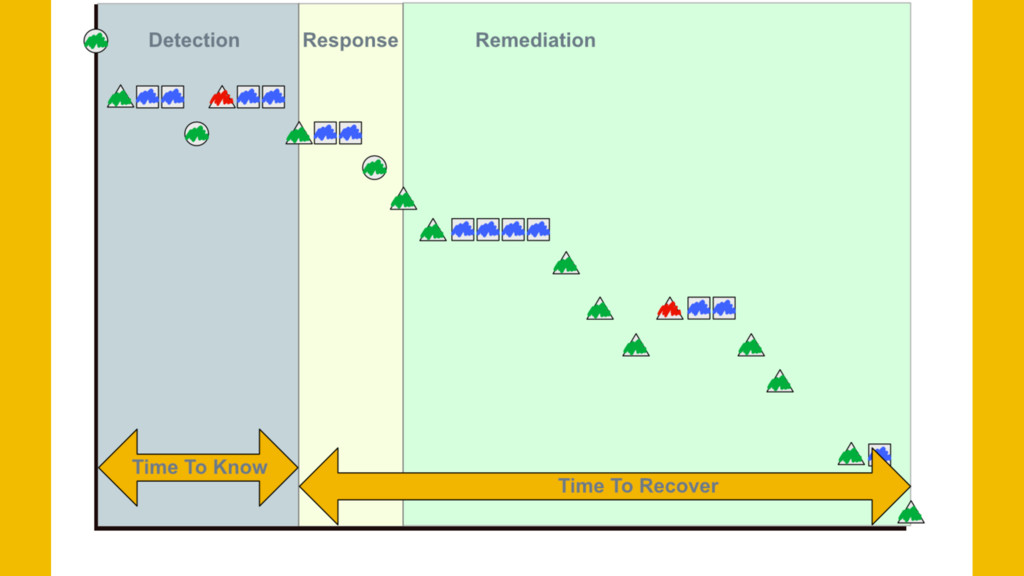
defacto metric for those tapped with the responsibility of up-time. It’s the cornerstone measurement of how well teams respond to service disruptions and a key performance metric that nearly all in IT should aim to consistently improve. Swift recovery provides far more benefits than attempts to engineer failure from complex systems. As important as MTTR has become, the mean time to repair is no more than an average of how long it took to manage individual incidents (from acknowledgement to resolve) over the course of time. The number of data points during that time can vary greatly depending on the complexity and scale of systems. Furthermore, averages assume there is a normal event or that your data is a normal distribution. Anyone who has been on-call can attest that some incidents require longer to resolve than others and that variance is something you shouldn’t ignore. Within any time-series dataset there are in fact high and low values hidden within the data. These outliers may indicate that while we think the time it takes to recover from failure is good, bad, or otherwise, many high values in our average distort or hide lower values and vice versa. We may believe that our efforts to reduce the time it takes to recover from failure is in fact working when the truth is it’s not. In this talk, we’ll discuss the metric of Mean Time To Repair as well as additional methods of understanding data related to building and maintaining reliable systems at scale. MTTR must be made a priority for any IT team that habitually follows old-view approaches to incident response however; a deeper understanding of the data provides much higher fidelity regarding the true health of your systems and the teams that support them. 81 — @jasonhand