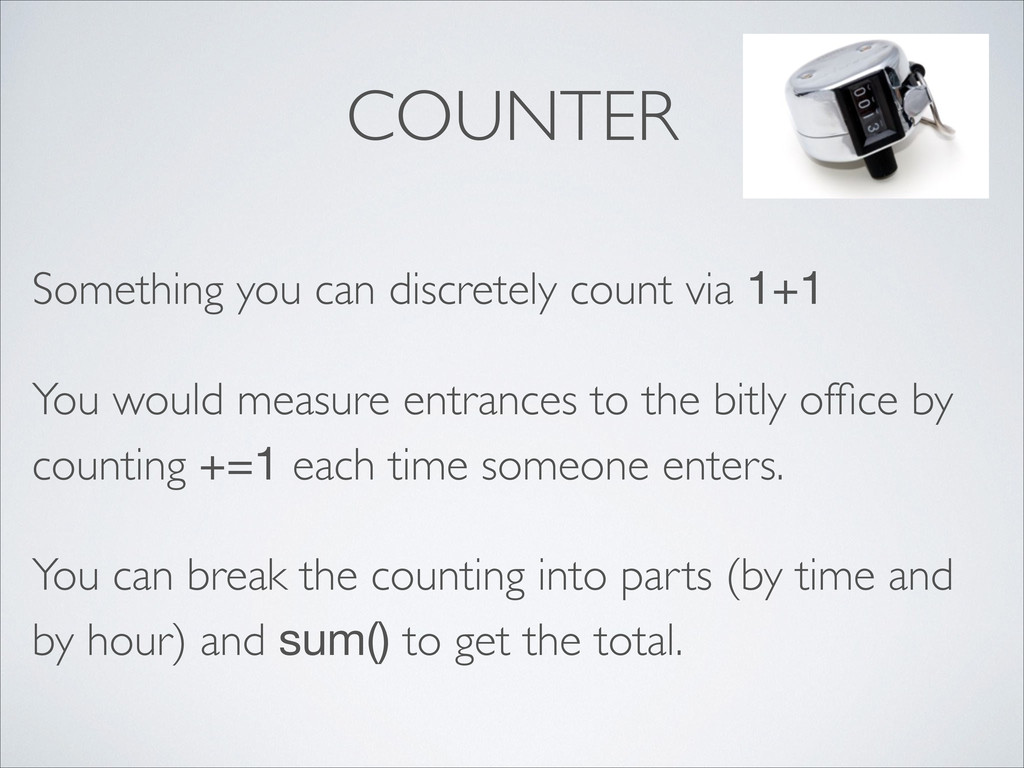
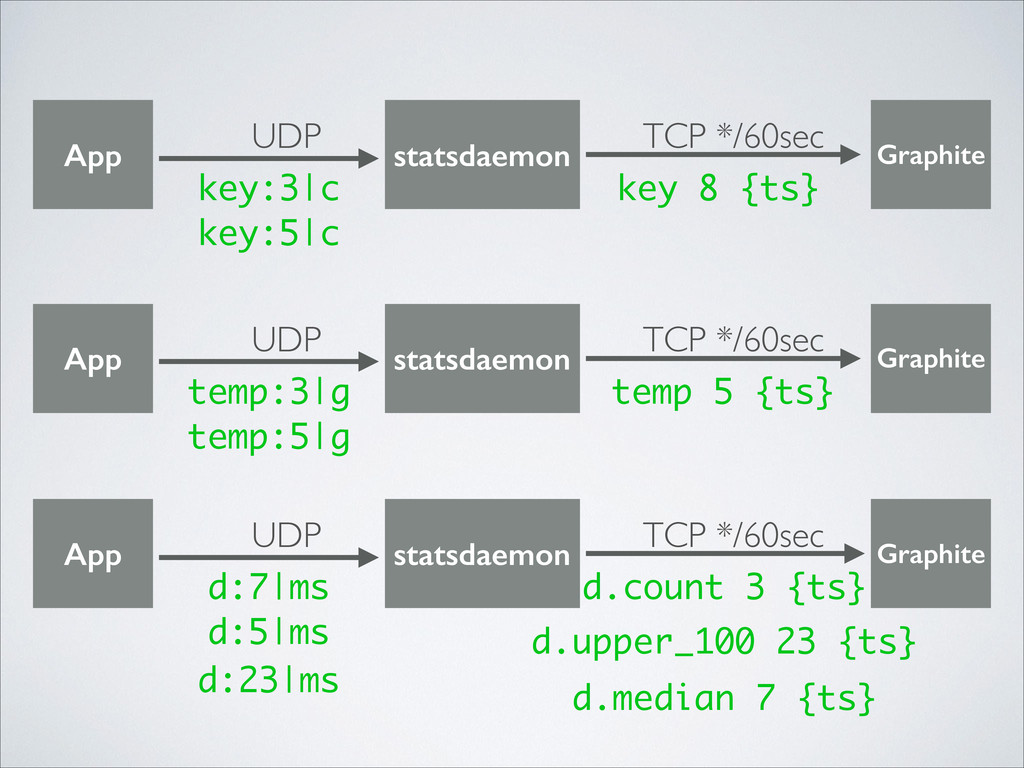
measure entrances to the bitly office by counting +=1 each time someone enters. You can break the counting into parts (by time and by hour) and sum() to get the total.
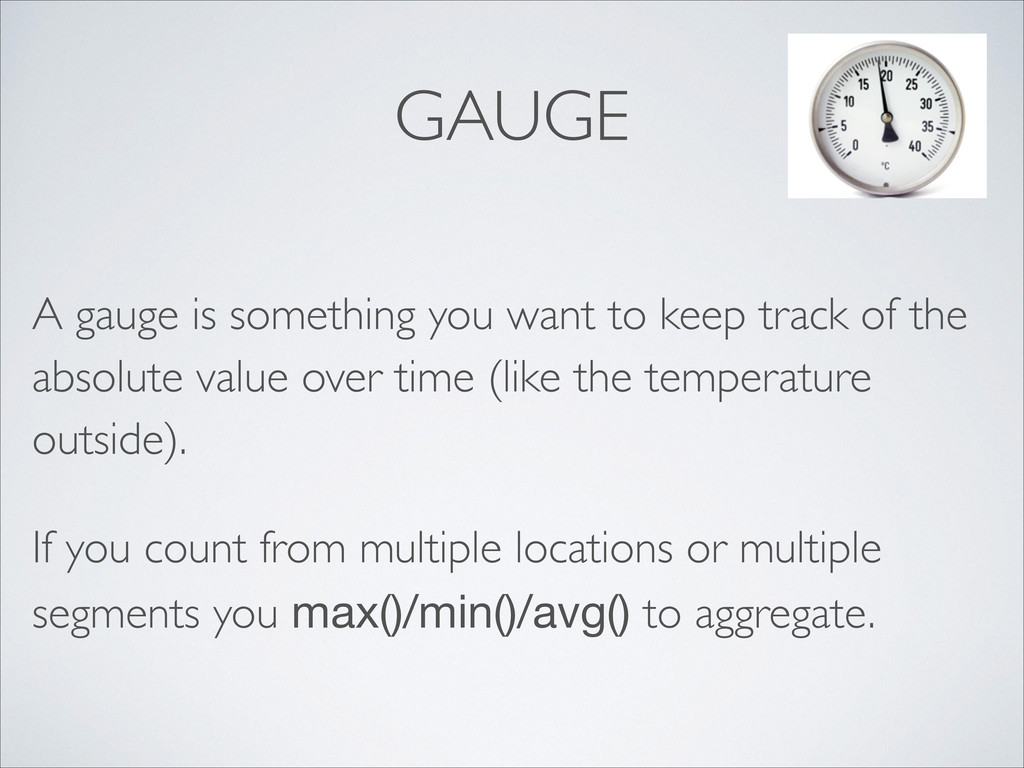
of the absolute value over time (like the temperature outside). If you count from multiple locations or multiple segments you max()/min()/avg() to aggregate.
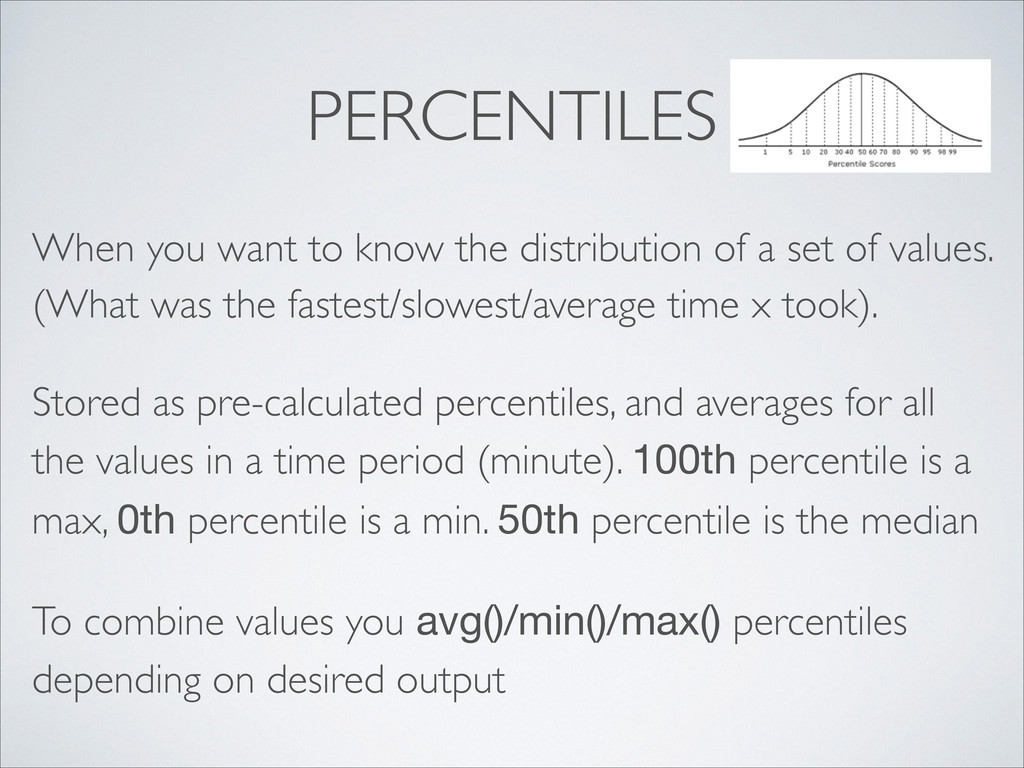
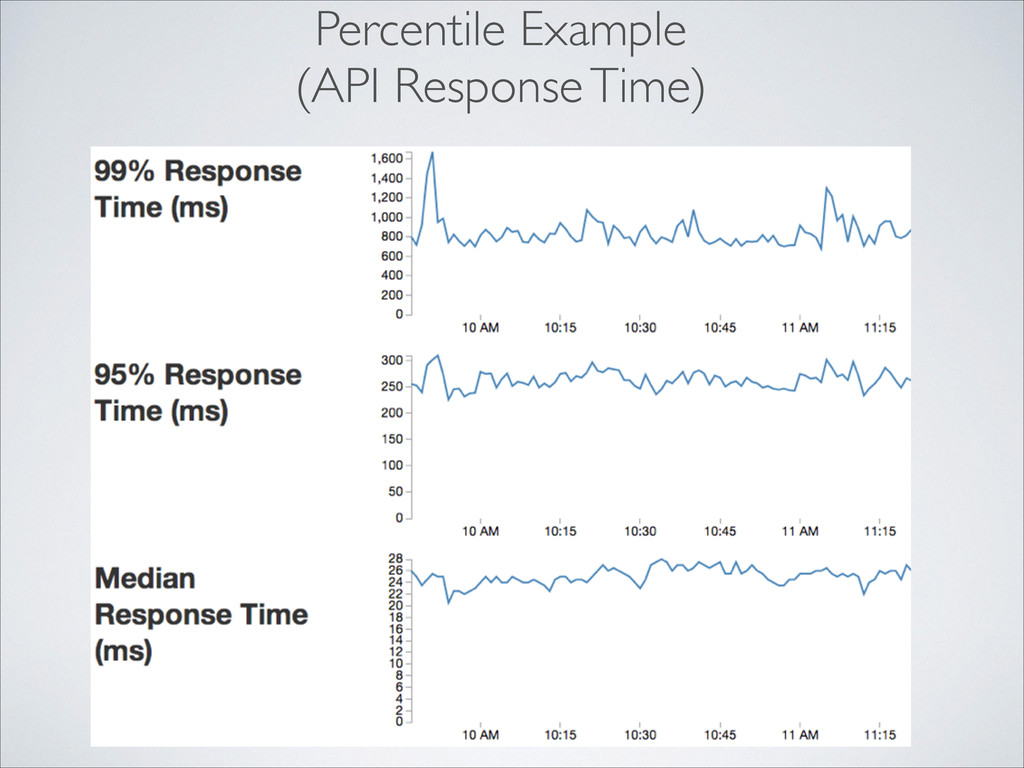
set of values. (What was the fastest/slowest/average time x took). Stored as pre-calculated percentiles, and averages for all the values in a time period (minute). 100th percentile is a max, 0th percentile is a min. 50th percentile is the median To combine values you avg()/min()/max() percentiles depending on desired output
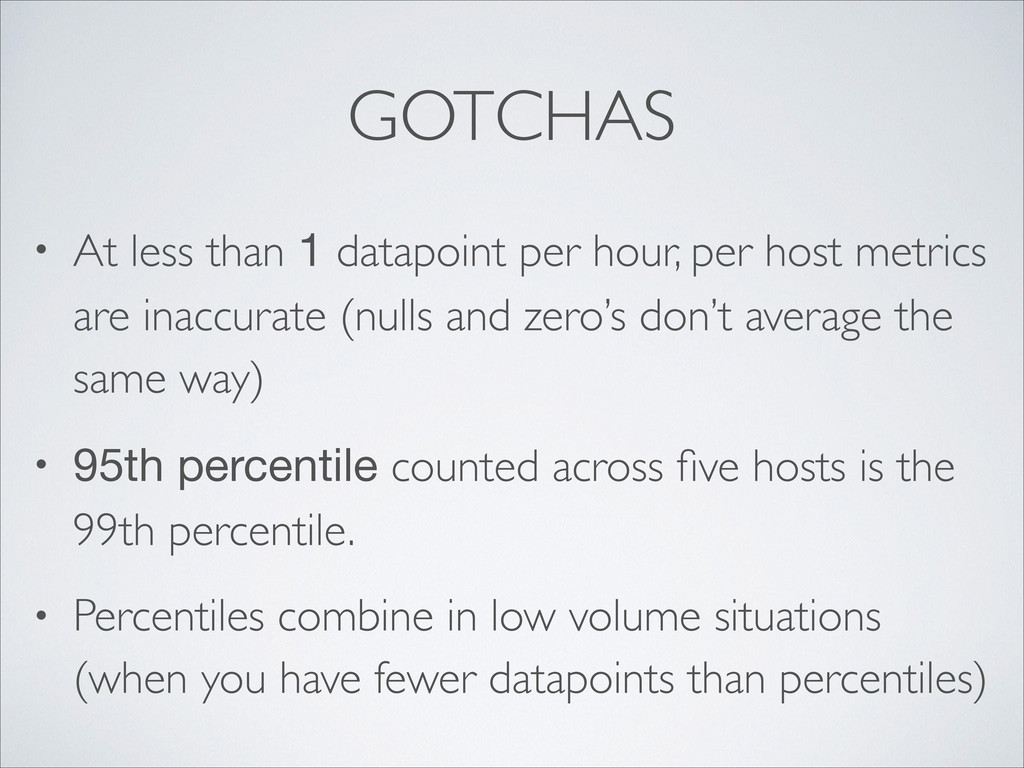
host metrics are inaccurate (nulls and zero’s don’t average the same way) • 95th percentile counted across five hosts is the 99th percentile. • Percentiles combine in low volume situations (when you have fewer datapoints than percentiles)