Upgrade to Pro — share decks privately, control downloads, hide ads and more …

bulgaria-2018-increasingly.pdf

James B. Elsner
June 20, 2018
51

 bulgaria-2018-increasingly.pdf

James B. Elsner

June 20, 2018
Tweet

Transcript

  1. Increasingly Powerful Tornadoes And the Rising Potential for Mass Casualties

    James B. Elsner & Tyler Fricker Florida State University June 24, 2018
  2. More Big Tornado Days N = 4 N = 8

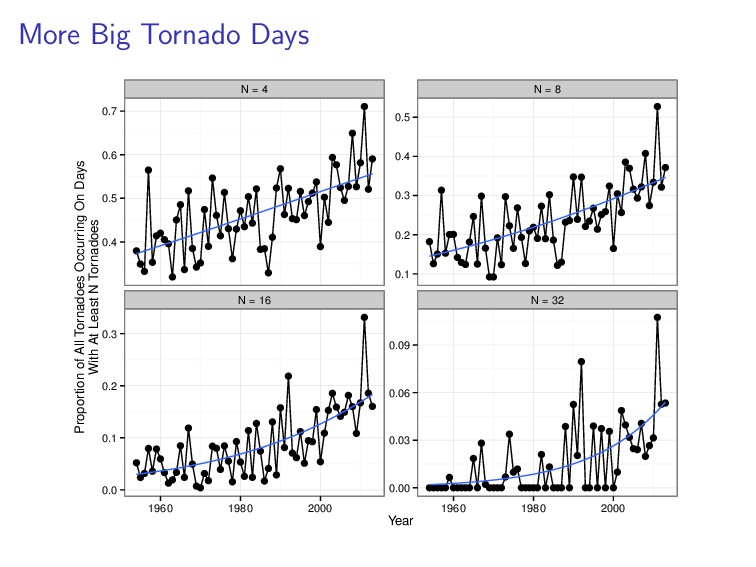
    N = 16 N = 32 0.4 0.5 0.6 0.7 0.1 0.2 0.3 0.4 0.5 0.0 0.1 0.2 0.3 0.00 0.03 0.06 0.09 1960 1980 2000 1960 1980 2000 Year Proportion of All Tornadoes Occurring On Days With At Least N Tornadoes
  3. Bigger Outbreaks ⇒ More Powerful Tornadoes Tornado % Tor. %

    Tor. Day Total Rated Rated Size No. No. Intense Violent (No. Tor.) Cases Tor. (EF3+) (EF4+) 1 1088 1088 0.37 0.00 2-3 1068 2581 0.39 0.00 4-7 874 4521 0.82 0.09 8-15 644 6921 1.99 0.38 16-31 295 6466 3.34 0.57 32-63 103 4355 5.49 1.08 >63 25 2018 8.18 2.23
  4. Increasing Tornado Power 0.1 1 10 100 1000 1995 2000

    2005 2010 2015 Year Energy Dissipation [GW]
  5. Tornado Power (Energy Dissipation) (P) P = Ap ρ J

    j=0 wj v3 j , P: power [kg m2 s−3 = J/s = Watt (W)]. We will use Gigawatts [GW] (109 W).
  6. Tornado Power By Damage Rating Energy dissipation (power). Values are

    in gigawatts (GW) Number of Median Total Mean Power EF Tornadoes Power Power Arithmetic Geometric 0 17182 1 73329 4 1 1 7735 12 364162 47 11 2 2224 91 609230 274 78 3 650 616 827474 1273 495 4 145 1631 511177 3525 1427 5 14 6458 130239 9302 5622
  7. Path Length & Width By Year 1995 2000 2005 2010

    2015 1995 2000 2005 2010 2015 .1 1 10 100 1 10 100 Path Length (km) Path Width (m)
  8. Effects 0 1 2 3 0 2 4 6 8

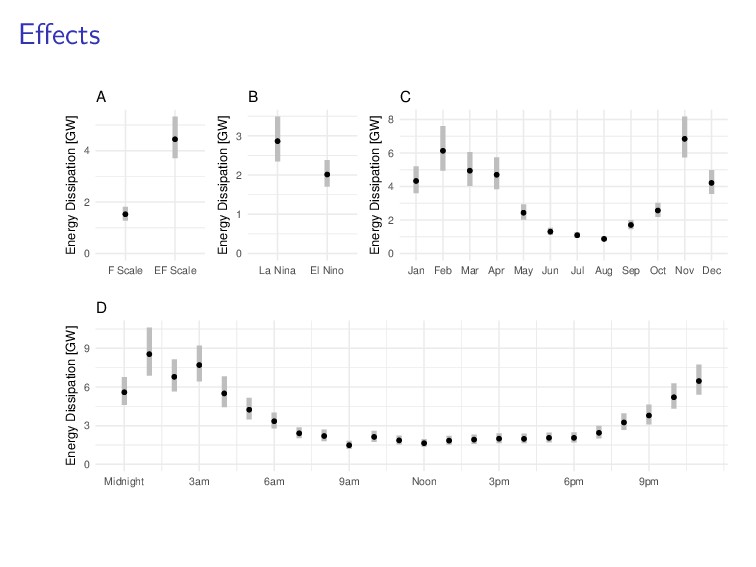
    Energy Dissipation [GW] Energy Dissipation [GW] 0 2 4 0 3 6 9 F Scale EF Scale La Nina El Nino Jan Feb Mar Apr May Jun Jul Aug Sep Oct Nov Dec Midnight 3am 6am 9am Noon 3pm 6pm 9pm Energy Dissipation [GW] Energy Dissipation [GW] A B C D
  9. Model ln(P|P > 444000) = α + βYear Year+ βENSO

    ENSO+ βEF? EF?+ s(Month)+ s(Hour)
  10. How Good Is The Model? Posterior predictive checks. 0 1000

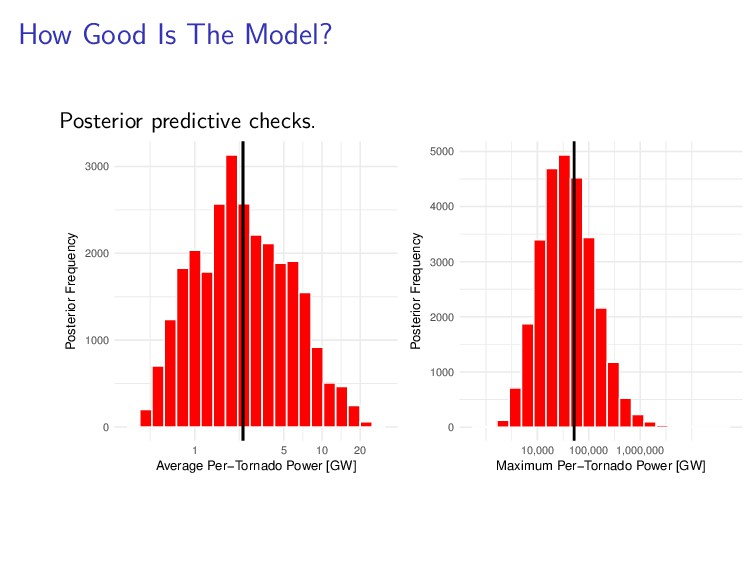
    2000 3000 1 5 10 20 Average Per−Tornado Power [GW] Posterior Frequency 0 1000 2000 3000 4000 5000 10,000 100,000 1,000,000 Maximum Per−Tornado Power [GW] Posterior Frequency
  11. Fixed Effects Estimate Error l-95% CI u-95% CI α 21.298

    0.023 21.253 21.344 βENSO −0.068 0.016 −0.101 −0.036 βEF? 0.341 0.063 0.217 0.462 βYear 0.054 0.005 0.045 0.063 ENSO EF Rating Trend 0.75 1.00 1.25 1.50 1.75 Multiplicative Change
  12. Random Effect 0 50 100 150 Jan Feb Mar Apr

    May Jun Jul Aug Sep Oct Nov Dec Conditional Power [GW]
  13. Conditional Trend 0.0 0.5 1.0 1.5 2.0 1995 2000 2005

    2010 2015 Conditional Power [GW]
  14. Modeled Trend by Month January February March April May June

    July August September October November December 1995 2005 2015 1995 2005 2015 1995 2005 2015 1995 2005 2015 1995 2005 2015 1995 2005 2015 1995 2005 2015 1995 2005 2015 1995 2005 2015 1995 2005 2015 1995 2005 2015 1995 2005 2015 0.1 1 10 100 1000 Energy Dissipation [GW]
  15. Environmental Factors Convective available potential energy (CAPE) and wind shear

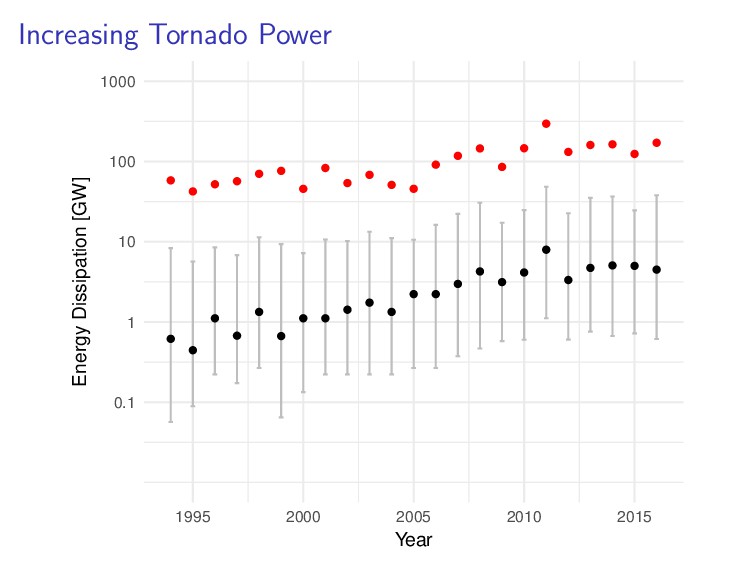
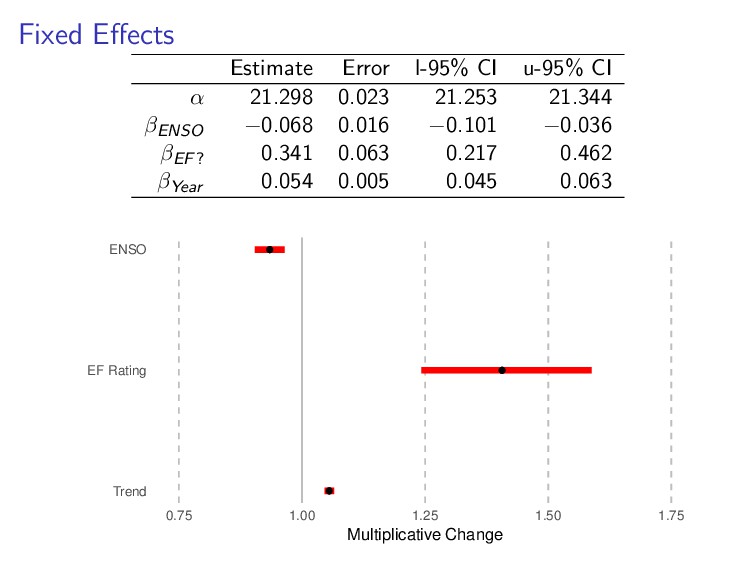
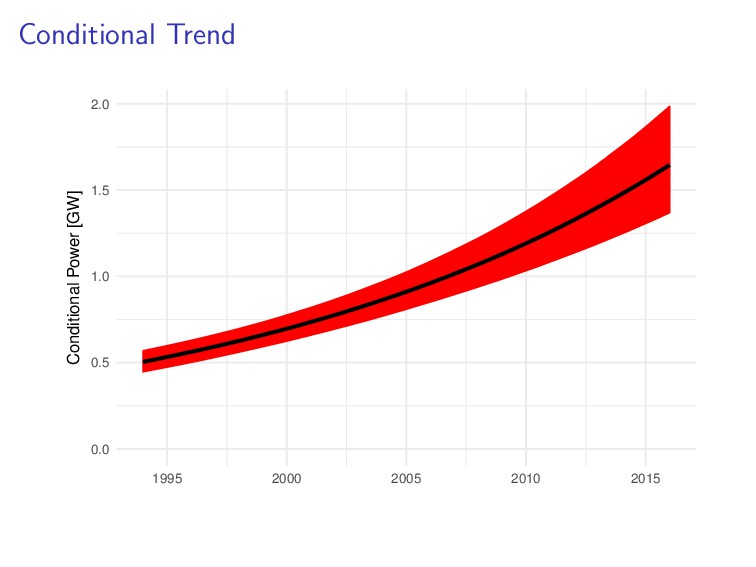
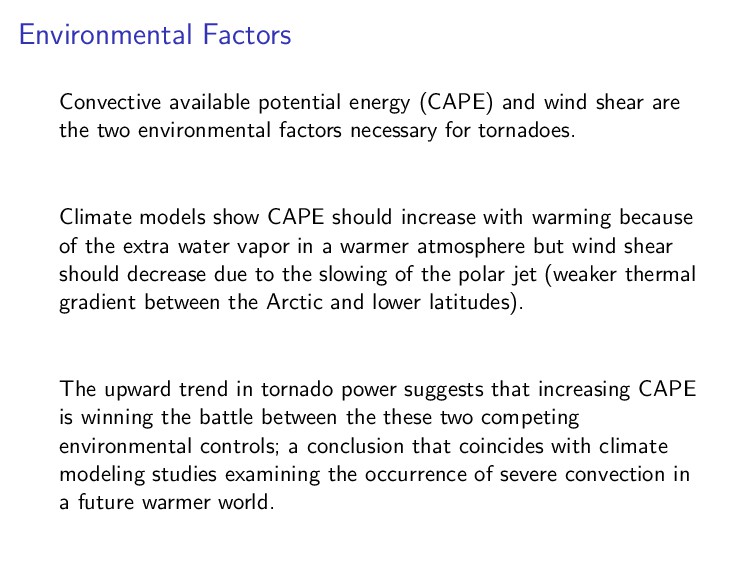
    are the two environmental factors necessary for tornadoes. Climate models show CAPE should increase with warming because of the extra water vapor in a warmer atmosphere but wind shear should decrease due to the slowing of the polar jet (weaker thermal gradient between the Arctic and lower latitudes). The upward trend in tornado power suggests that increasing CAPE is winning the battle between the these two competing environmental controls; a conclusion that coincides with climate modeling studies examining the occurrence of severe convection in a future warmer world.
  16. 0 500 1000 1500 2000 2500 1995 1999 2003 2007

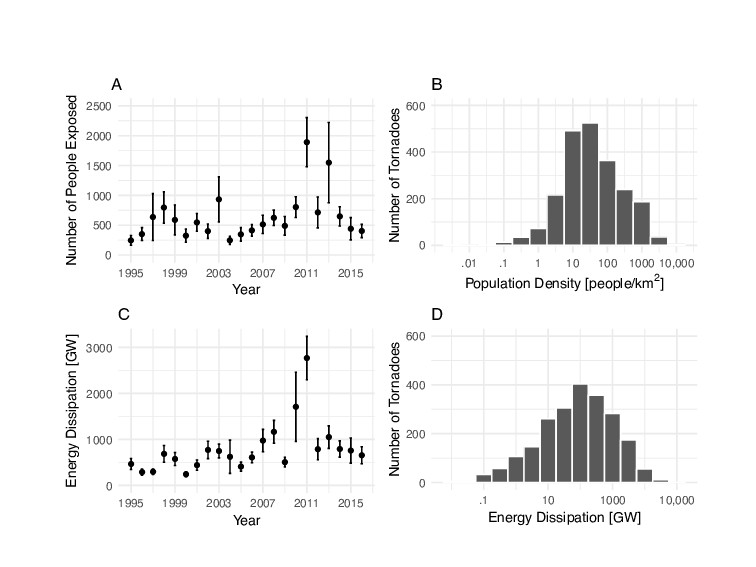
    2011 2015 Year Number of People Exposed A 0 200 400 600 .01 .1 1 10 100 1000 10,000 Population Density [people/km2] Number of Tornadoes B 0 1000 2000 3000 1995 1999 2003 2007 2011 2015 Year Energy Dissipation [GW] C 0 200 400 600 .1 10 1000 10,000 Energy Dissipation [GW] Number of Tornadoes D
  17. May 22, 2011 Casualty-Producing Tornadoes Joplin, MO B B B

    B B B A A A A A A 10 100 1000 10 100 1000 Population Density [people/km2] Energy Dissipation [GW] 1 10 100 1000 Tornado Casualties
  18. 2011 Casualty-Producing Tornadoes Joplin, MO .1 1 10 100 1000

    10,000 100,000 1 10 100 1000 Population Density [people/km2] Energy Dissipation [GW] 1 10 100 1000 Tornado Casualties
  19. All Casualty-Producing Tornadoes Joplin, MO .01 .1 1 10 100

    1000 10,000 100,000 .01 .1 1 10 100 1000 10,000 Population Density [people/km2] Energy Dissipation [GW] 1 10 100 1000 Tornado Casualties
  20. Casualty Model 1 2 5 10 20 50 .001 .1

    10 1,000 .001 .1 10 1,000 Population Density [people per sq. km] Energy Dissipation [GW]
  21. Casualty Rates 1 2 5 10 20 50 100 1

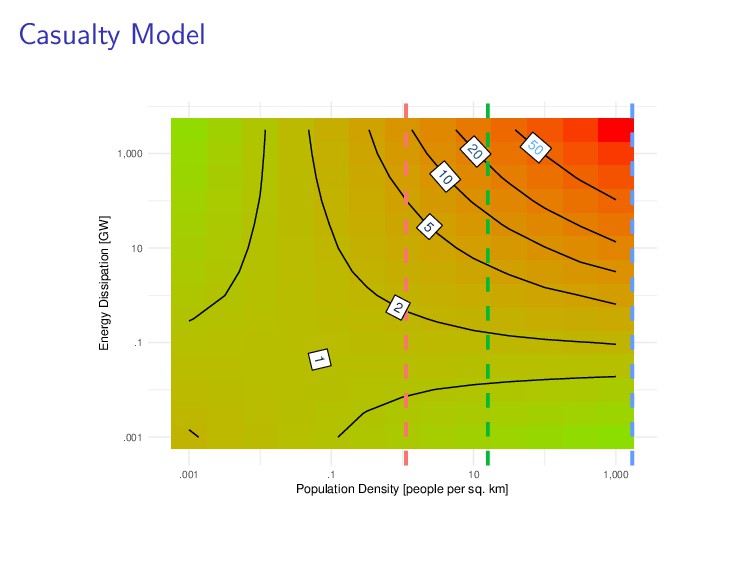
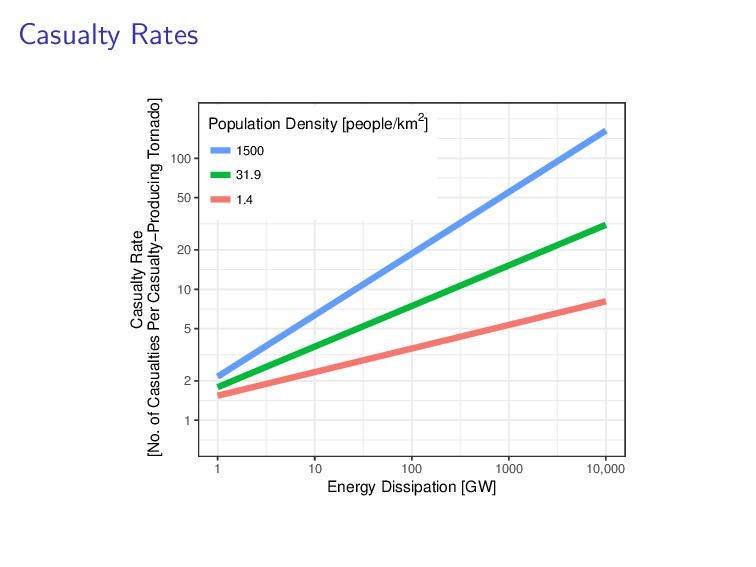
    10 100 1000 10,000 Energy Dissipation [GW] Casualty Rate [No. of Casualties Per Casualty−Producing Tornado] Population Density [people/km2] 1500 31.9 1.4
  22. Summary Tornado power has increased over the past few decades

    likely due to greater convective energy from hotter oceans. This means an increased potential for more casualties especially as more people are placed in harm’s way. The percentage increase in casualties with increasing tornado power increases with population density.