(@JBElsner) Department of Geography, Florida State University Tallahassee, FL March 10, 2016 SC&C Workshop, Columbia University, New York, NY Help: Thomas Jagger, Tyler Fricker, Holly M. Widen Money: RPI2.0 (Mark Guishard, John Wardman)
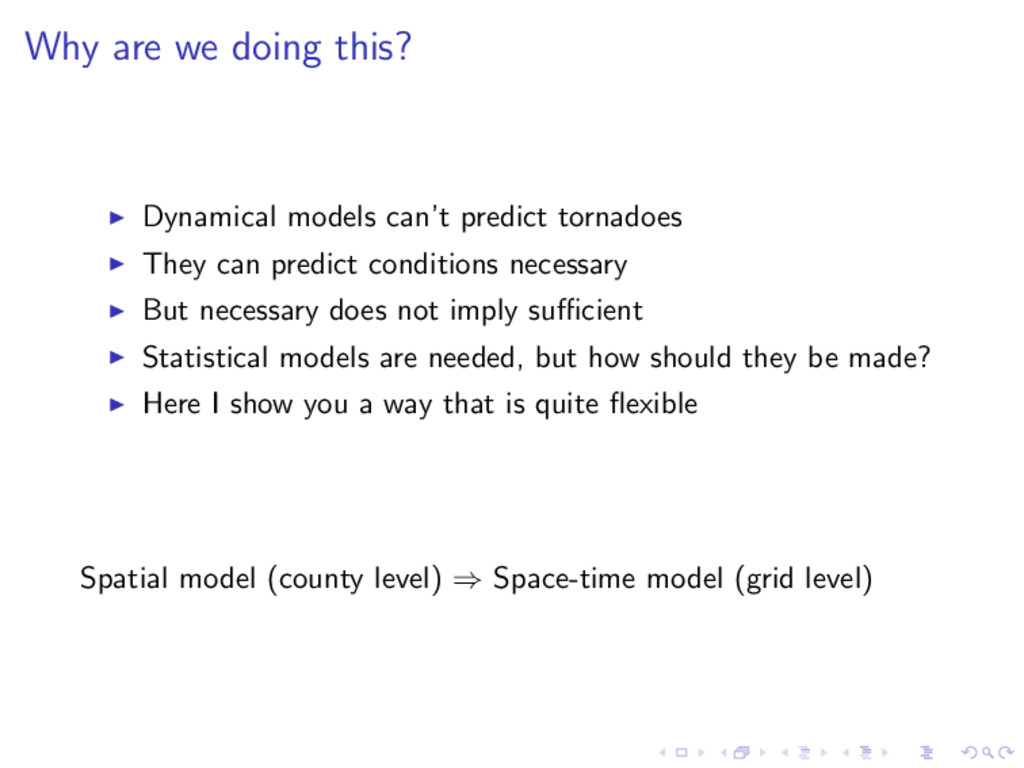
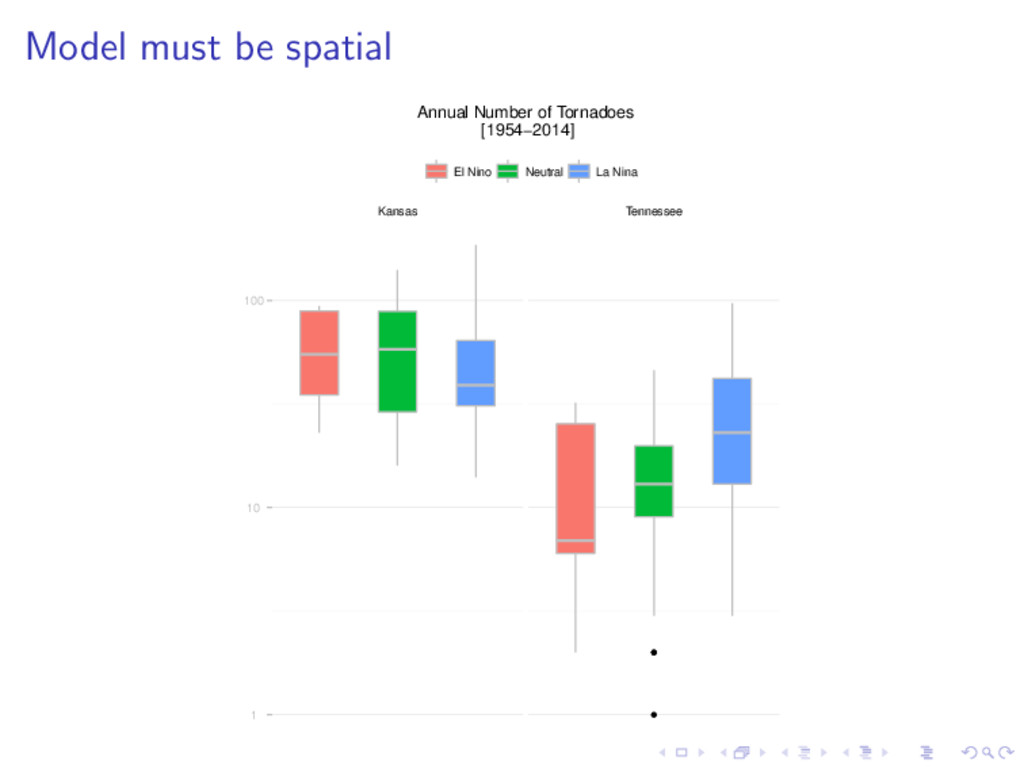
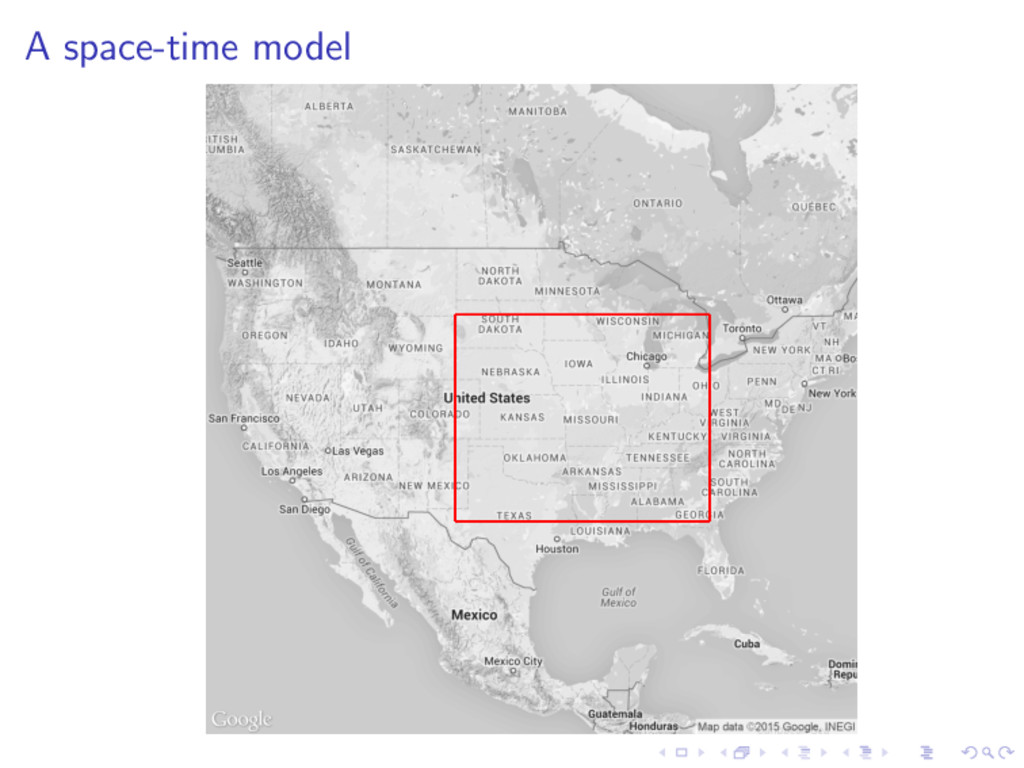
They can predict conditions necessary But necessary does not imply sufficient Statistical models are needed, but how should they be made? Here I show you a way that is quite flexible Spatial model (county level) ⇒ Space-time model (grid level)
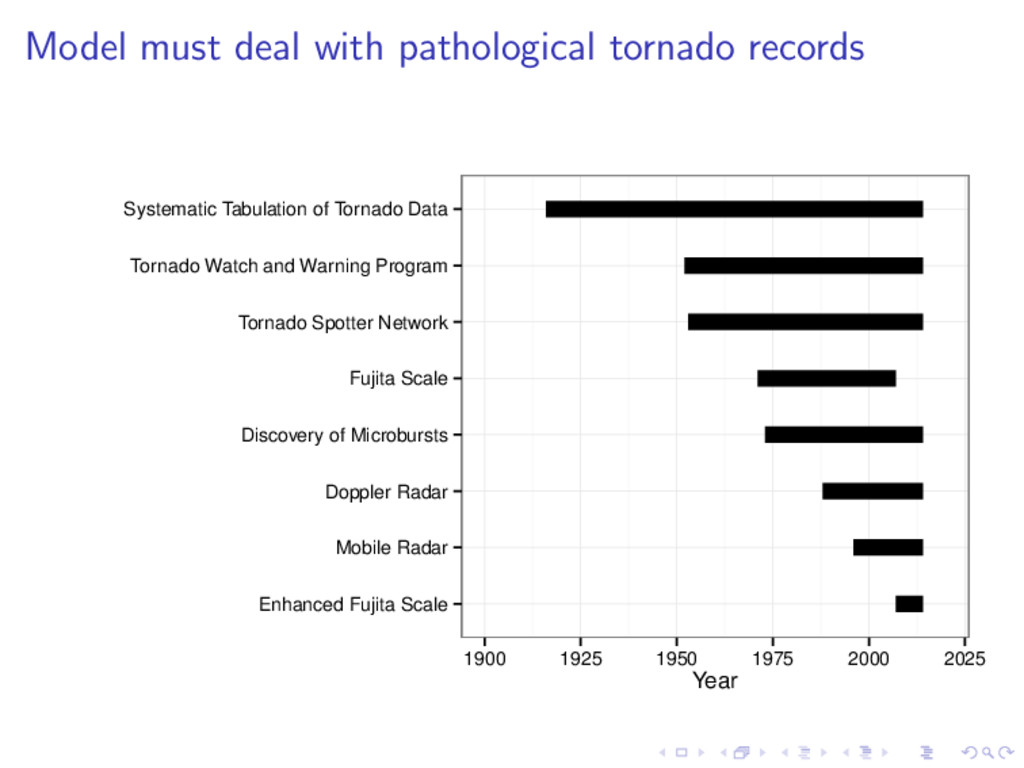
Mobile Radar Doppler Radar Discovery of Microbursts Fujita Scale Tornado Spotter Network Tornado Watch and Warning Program Systematic Tabulation of Tornado Data 1900 1925 1950 1975 2000 2025 Year
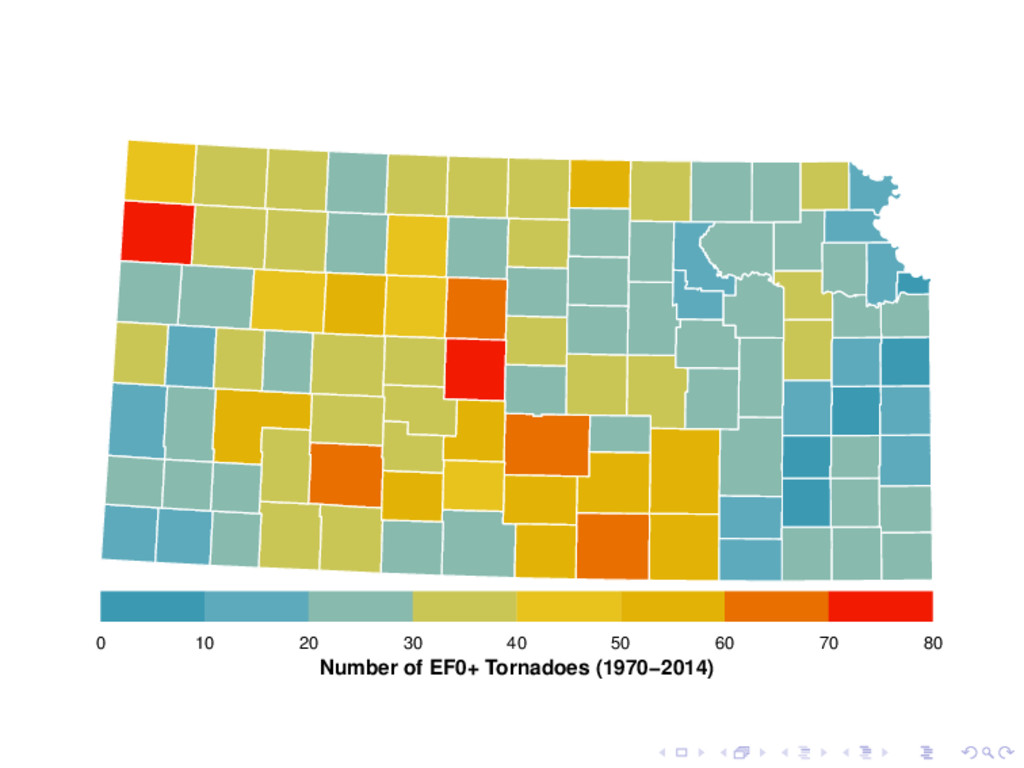
Marshall Smith Rice Thomas Scott Kiowa Wichita Clay Cheyenne Meade Osborne Franklin Linn Harvey Sumner Wilson Cloud Kearny Sedgwick Osage Lincoln Rush Russell Gove Jewell Mitchell Republic Trego Stevens Jackson Stanton Chautauqua Stafford McPherson Chase Coffey Ottawa Saline Butler Wallace Montgomery Grant Washington Shawnee Sheridan Johnson Haskell Greenwood Barton Neosho Rooks Douglas Elk Labette Pawnee Graham Ellsworth Marion Anderson Logan Hodgeman Finney Hamilton Comanche Edwards Riley Morton Barber Miami Sherman Reno Crawford Woodson Doniphan Wabaunsee Pratt Brown Phillips Leavenworth Ellis Kingman Decatur Lane Norton Cherokee Atchison Allen Geary Cowley Ness Morris Rawlins Greeley Ford Pottawatomie Dickinson Harper Jefferson Wyandotte Bourbon Seward Nemaha 1 3 10 40 158 631
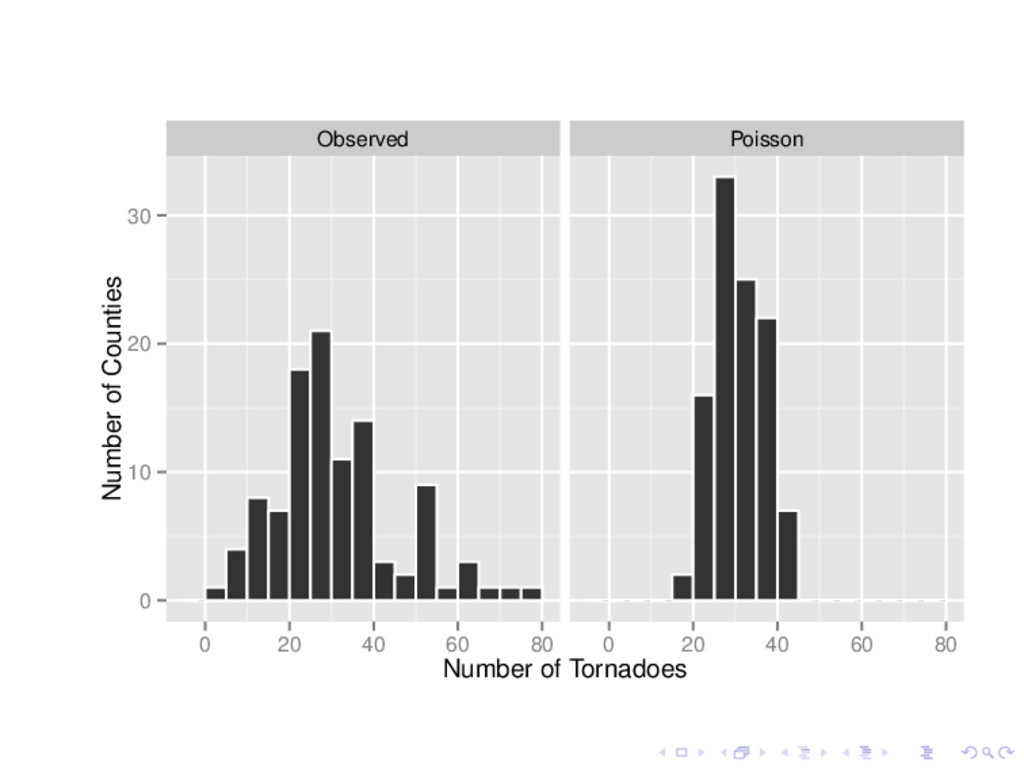
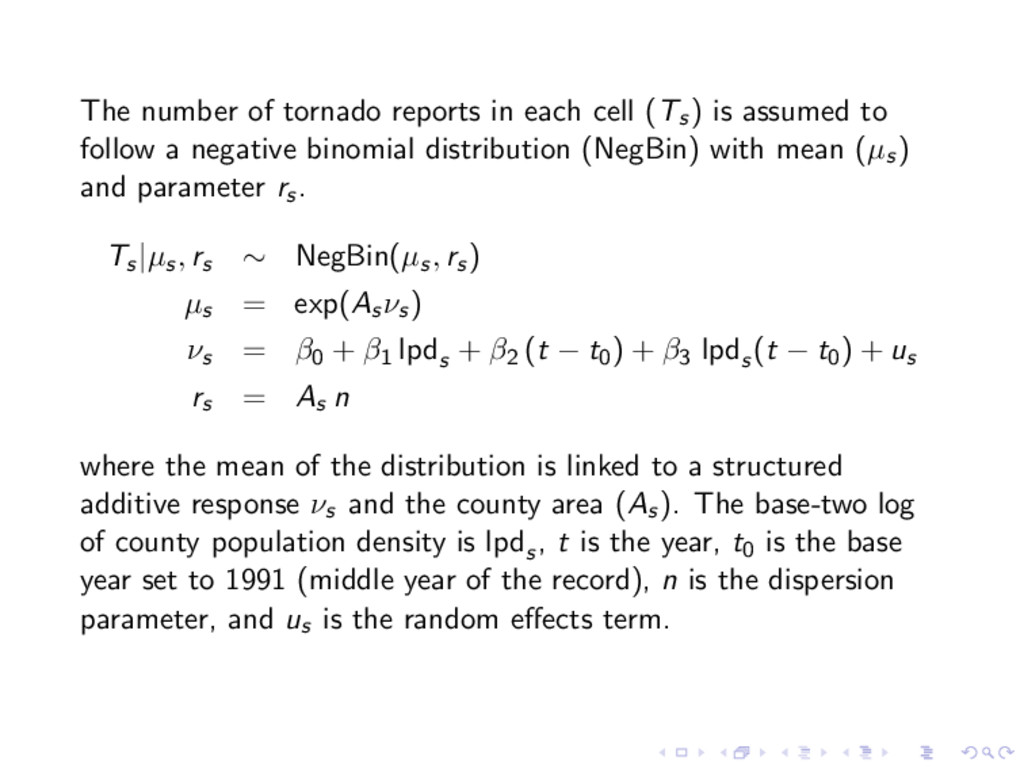
assumed to follow a negative binomial distribution (NegBin) with mean (µs) and parameter rs. Ts|µs, rs ∼ NegBin(µs, rs) µs = exp(Asνs) νs = β0 + β1 lpds + β2 (t − t0) + β3 lpds (t − t0) + us rs = As n where the mean of the distribution is linked to a structured additive response νs and the county area (As). The base-two log of county population density is lpds , t is the year, t0 is the base year set to 1991 (middle year of the record), n is the dispersion parameter, and us is the random effects term.
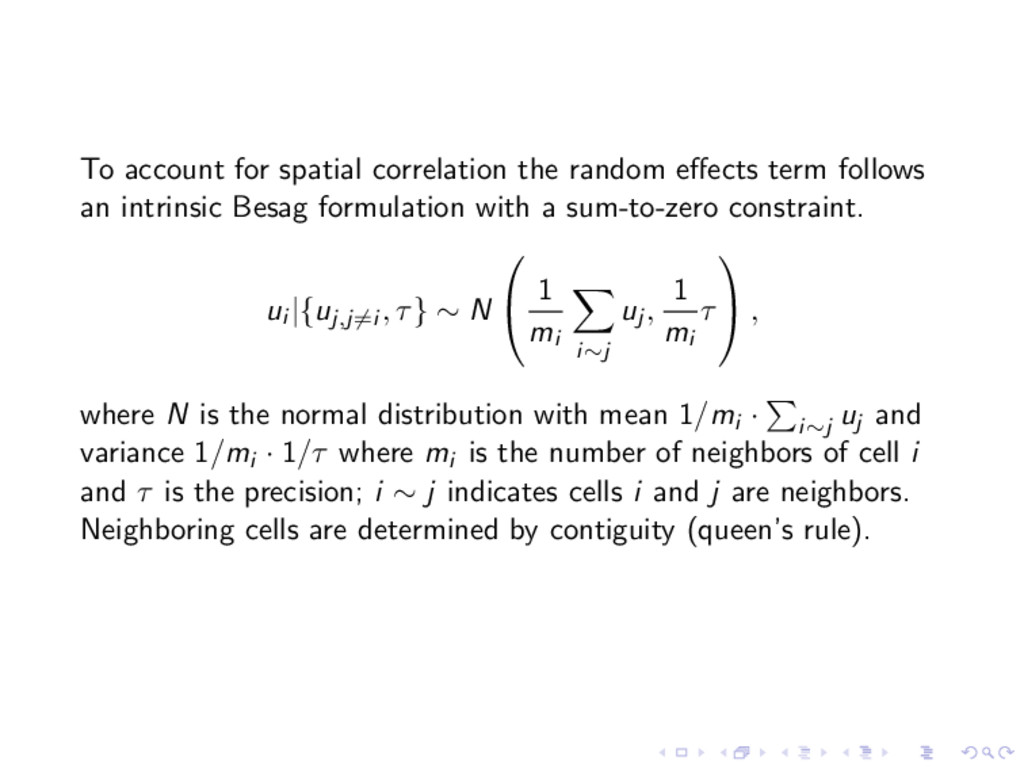
an intrinsic Besag formulation with a sum-to-zero constraint. ui |{uj,j=i , τ} ∼ N 1 mi i∼j uj , 1 mi τ , where N is the normal distribution with mean 1/mi · i∼j uj and variance 1/mi · 1/τ where mi is the number of neighbors of cell i and τ is the precision; i ∼ j indicates cells i and j are neighbors. Neighboring cells are determined by contiguity (queen’s rule).
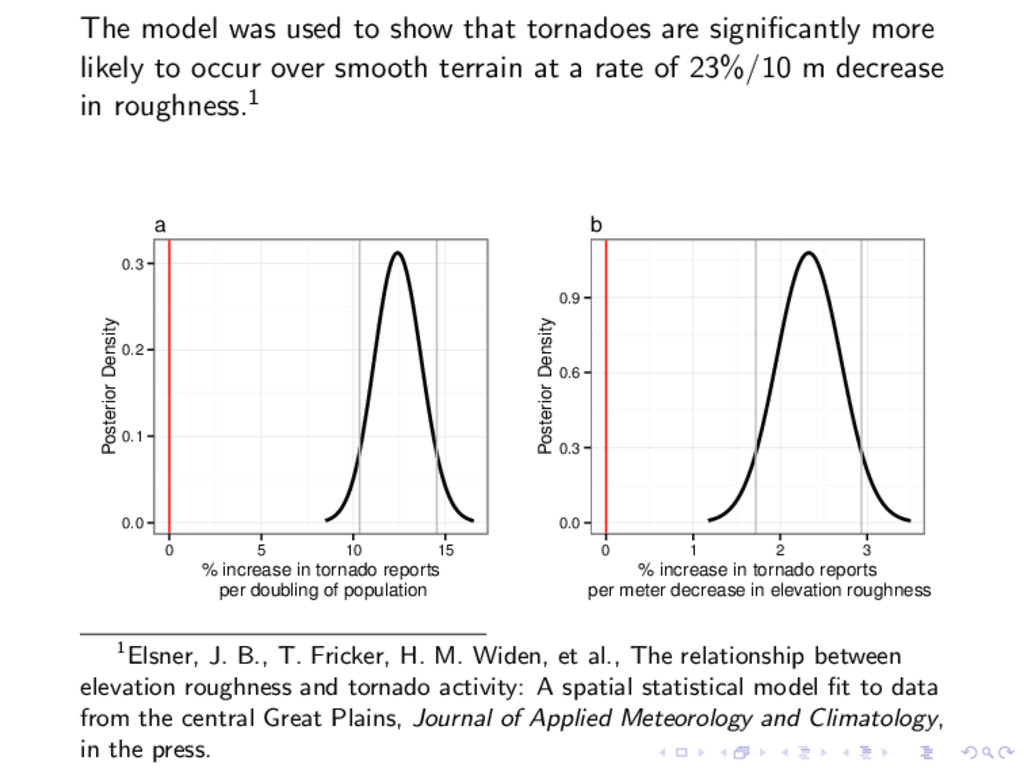
more likely to occur over smooth terrain at a rate of 23%/10 m decrease in roughness.1 0.0 0.1 0.2 0.3 0 5 10 15 % increase in tornado reports per doubling of population Posterior Density a 0.0 0.3 0.6 0.9 0 1 2 3 % increase in tornado reports per meter decrease in elevation roughness Posterior Density b 1Elsner, J. B., T. Fricker, H. M. Widen, et al., The relationship between elevation roughness and tornado activity: A spatial statistical model fit to data from the central Great Plains, Journal of Applied Meteorology and Climatology, in the press.
![2012 Population Density [persons per square km] Clark Lyon Gray](https://files.speakerdeck.com/presentations/692286cb7a8f4b1f9016a6f42becd24f/slide_7.jpg)
![Tornado (EF0+) Occurrence Rate [% Difference from Statewide Avg] −50](https://files.speakerdeck.com/presentations/692286cb7a8f4b1f9016a6f42becd24f/slide_12.jpg)
![Effect on Tornadoes [% Change in Rate/S.D. Increase in NAO]](https://files.speakerdeck.com/presentations/692286cb7a8f4b1f9016a6f42becd24f/slide_20.jpg)