is highest in urbanized areas of the Mid South James B. Elsner (@JBElsner) Department of Geography, Florida State University, USA September 18, 2017 Pula, CROATIA Help: Tyler Fricker
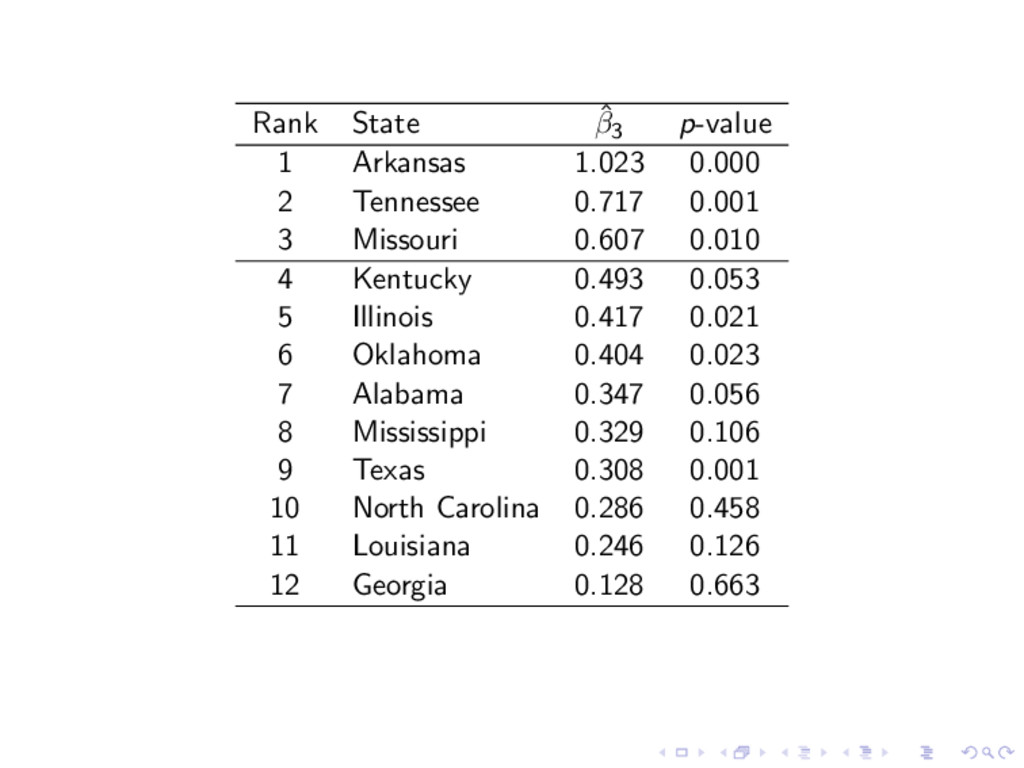
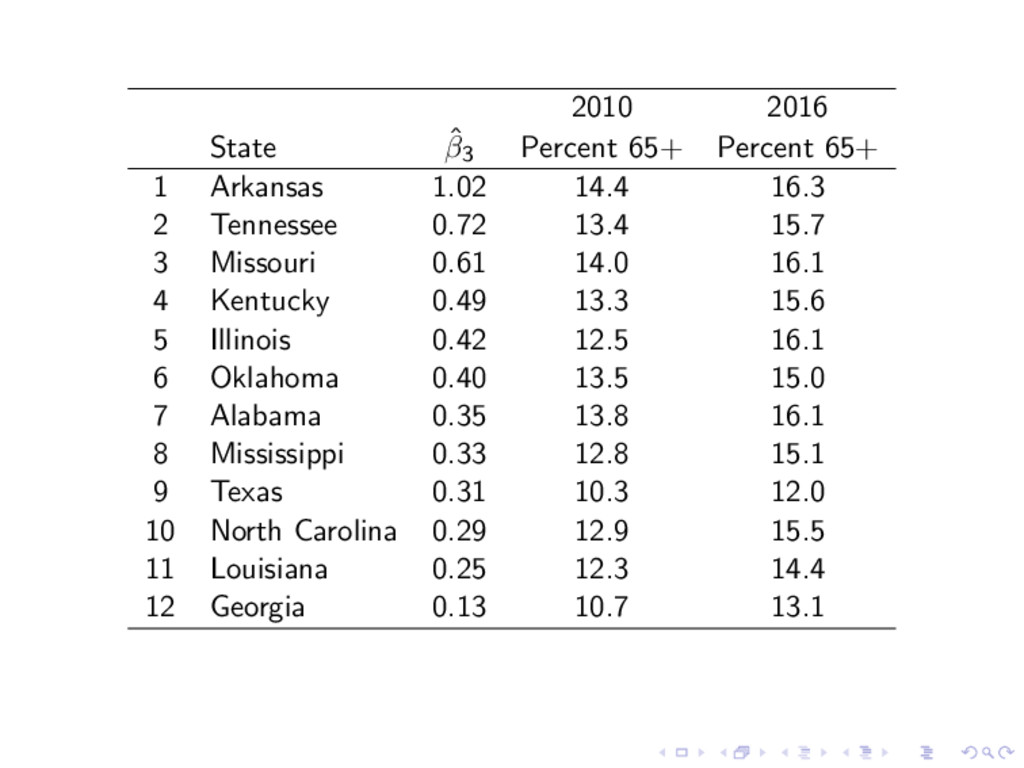
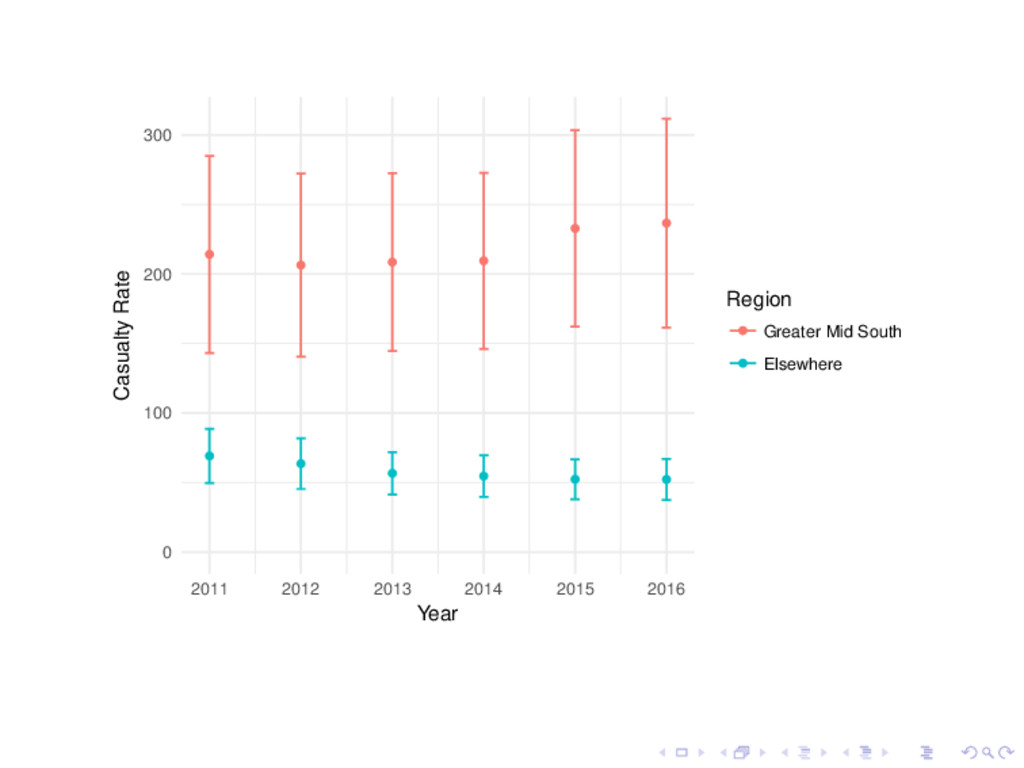
are substantively and significantly more vulnerable to casualties from tornadoes than elsewhere in the United States. Greater vulnerability corresponds with a higher percentage of elderly people. Code/data used: https://rpubs.com/jelsner/TornadoCasualtyRisk SocArXiv: https://osf.io/preprints/socarxiv/ta6uh/
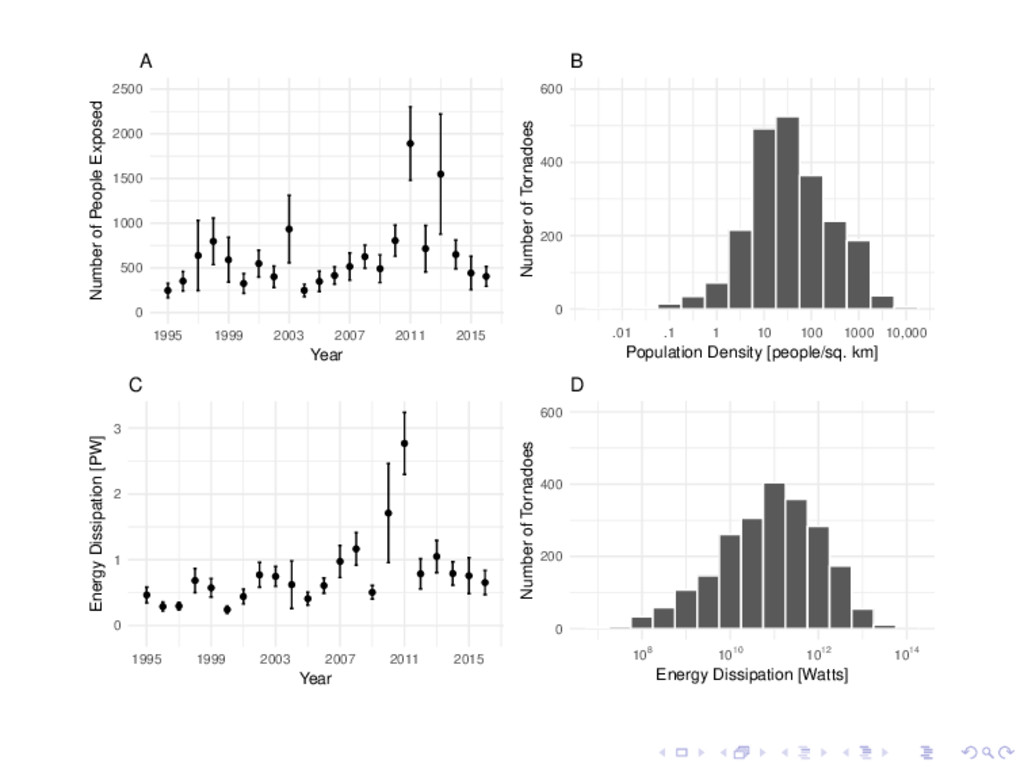
2011 2015 Year Number of People Exposed A 0 200 400 600 .01 .1 1 10 100 1000 10,000 Population Density [people/sq. km] Number of Tornadoes B 0 1 2 3 1995 1999 2003 2007 2011 2015 Year Energy Dissipation [PW] C 0 200 400 600 108 1010 1012 1014 Energy Dissipation [Watts] Number of Tornadoes D
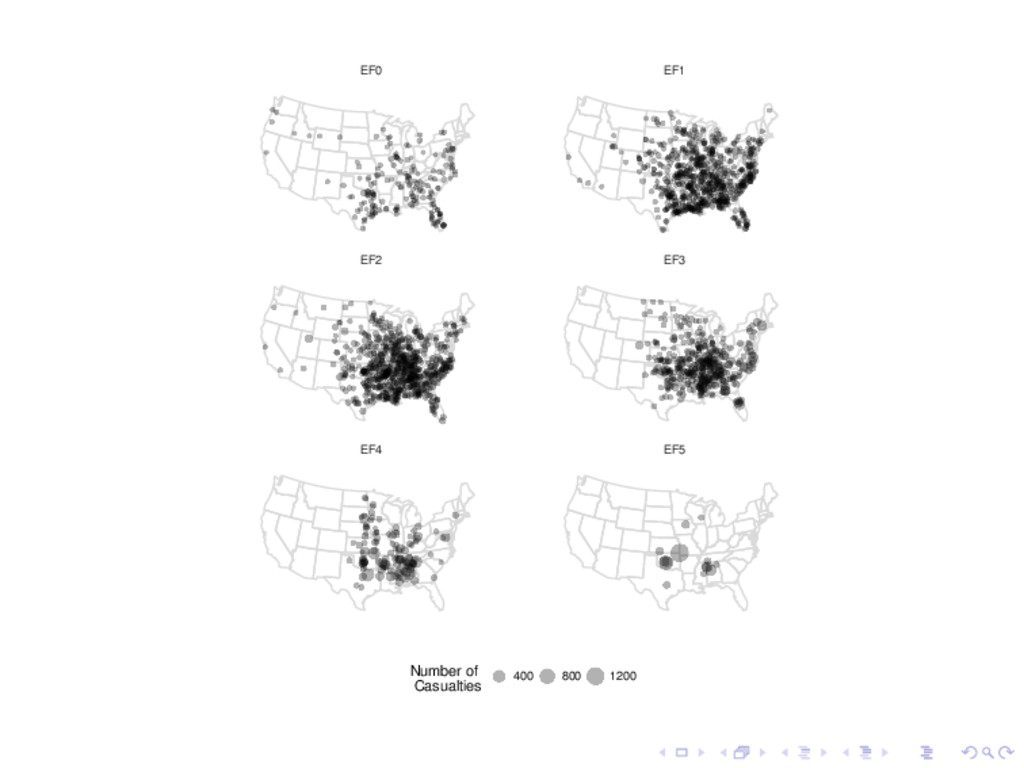
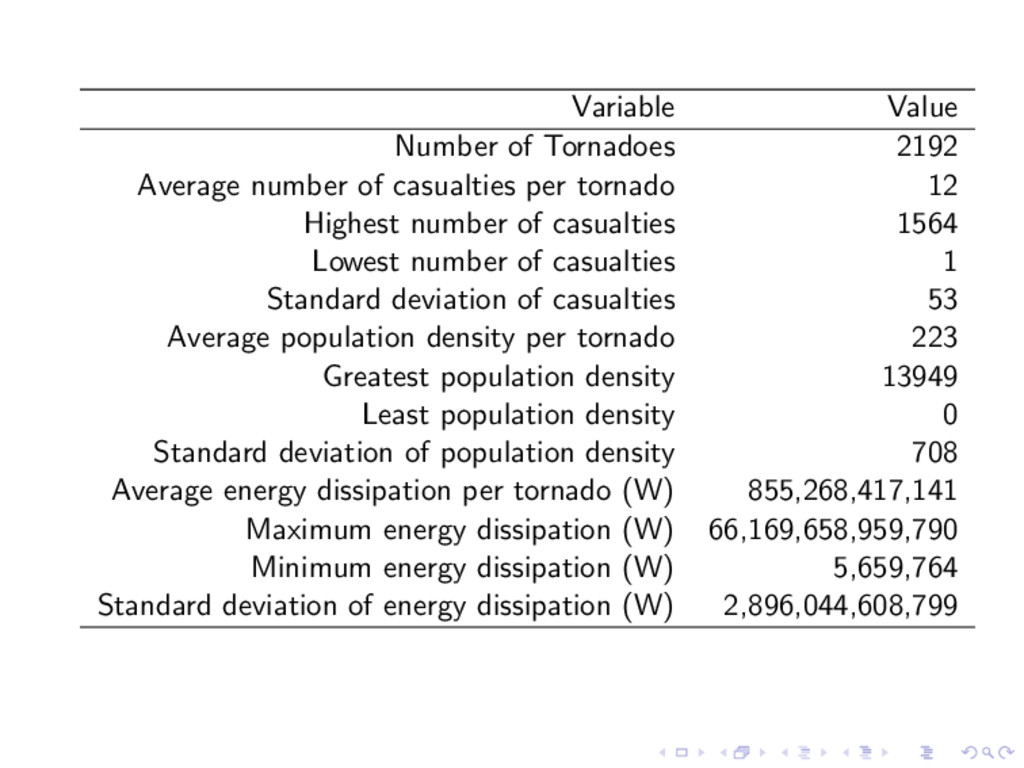
per tornado 12 Highest number of casualties 1564 Lowest number of casualties 1 Standard deviation of casualties 53 Average population density per tornado 223 Greatest population density 13949 Least population density 0 Standard deviation of population density 708 Average energy dissipation per tornado (W) 855,268,417,141 Maximum energy dissipation (W) 66,169,658,959,790 Minimum energy dissipation (W) 5,659,764 Standard deviation of energy dissipation (W) 2,896,044,608,799
Density [people/sq. km] Increase in Casualties Per Doubling of Energy A 0 100 % 200 % 1 10 100 1000 Population Density [people/sq. km] Increase in Casualties Per Doubling of Energy B
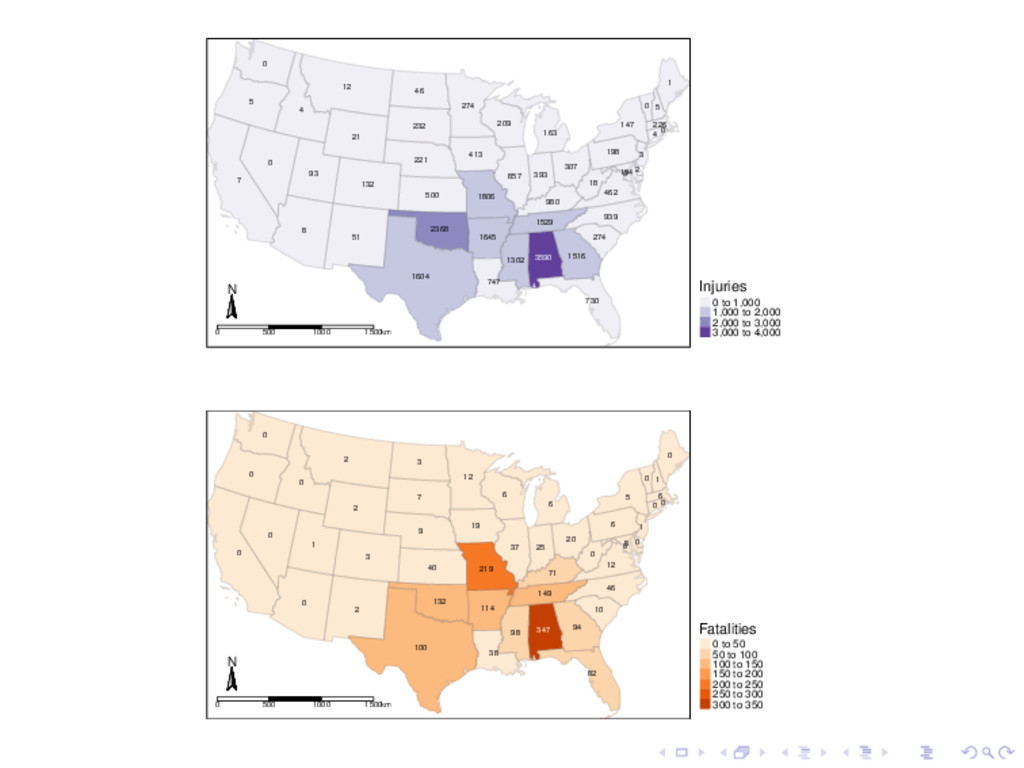
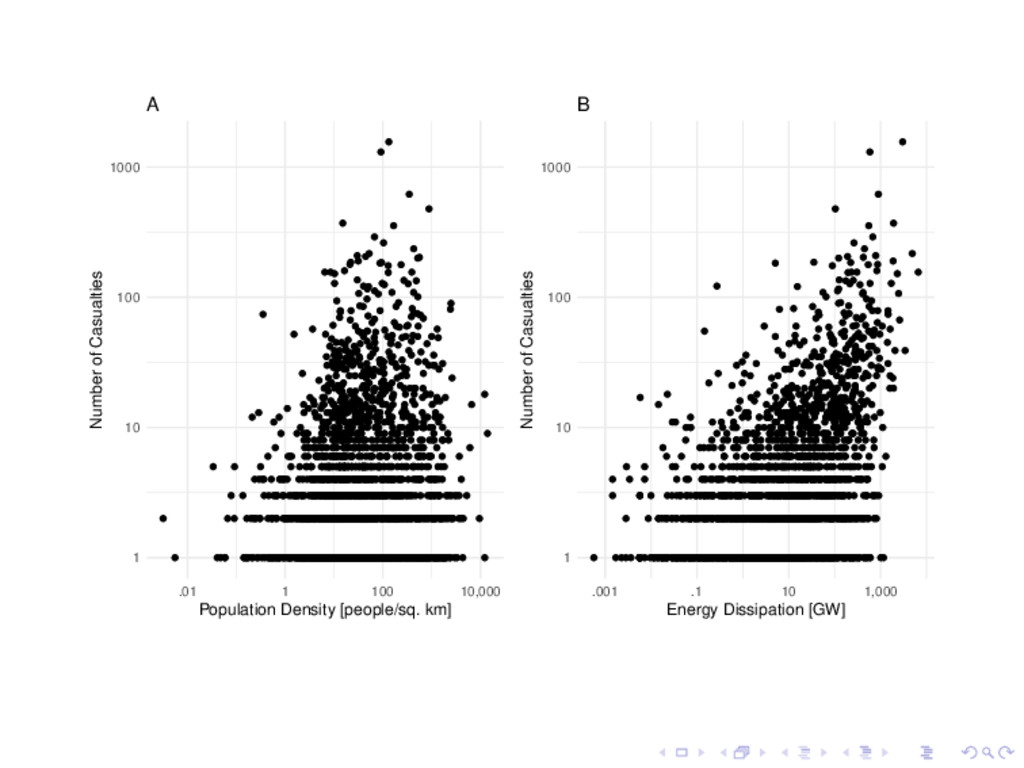
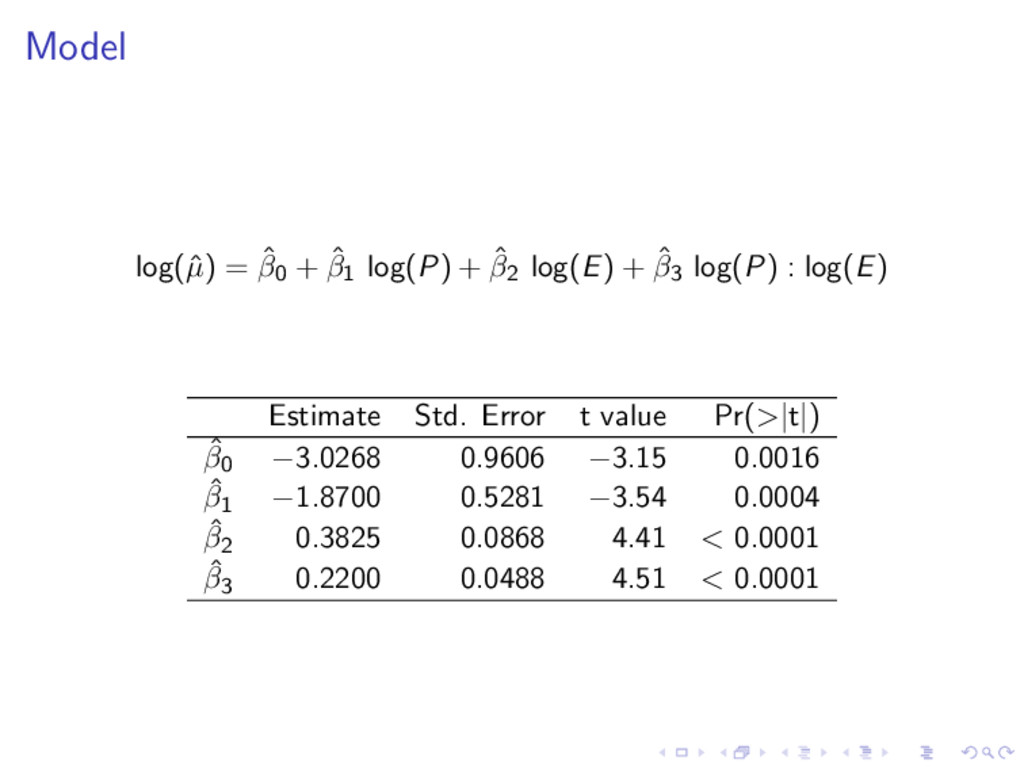
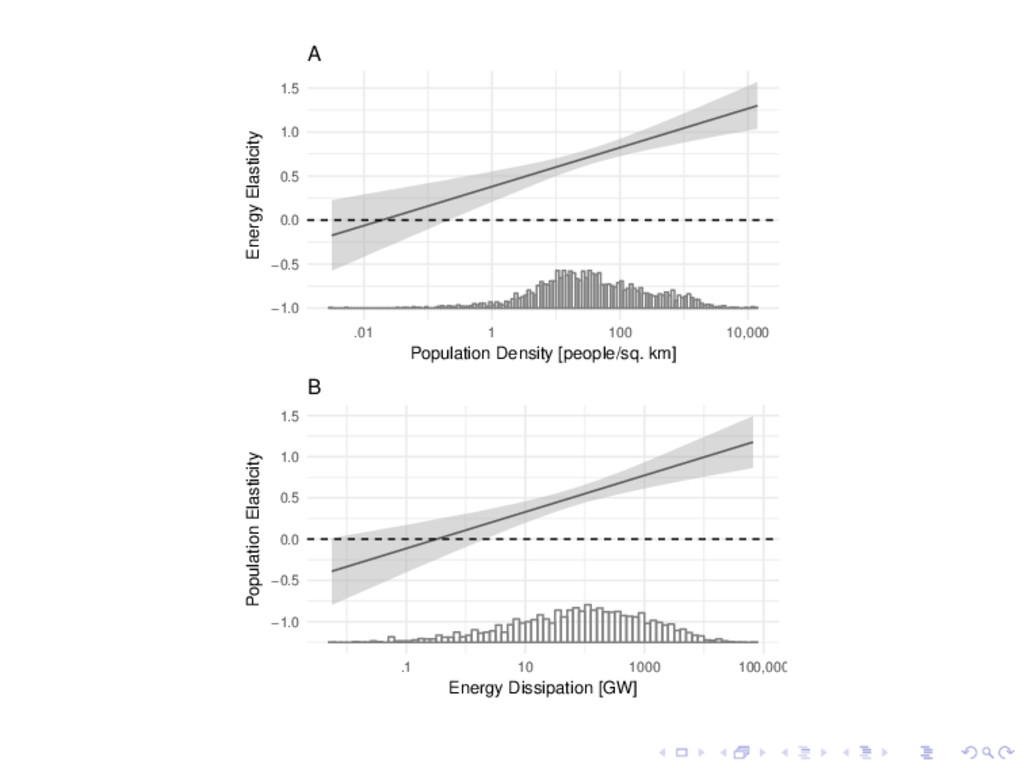
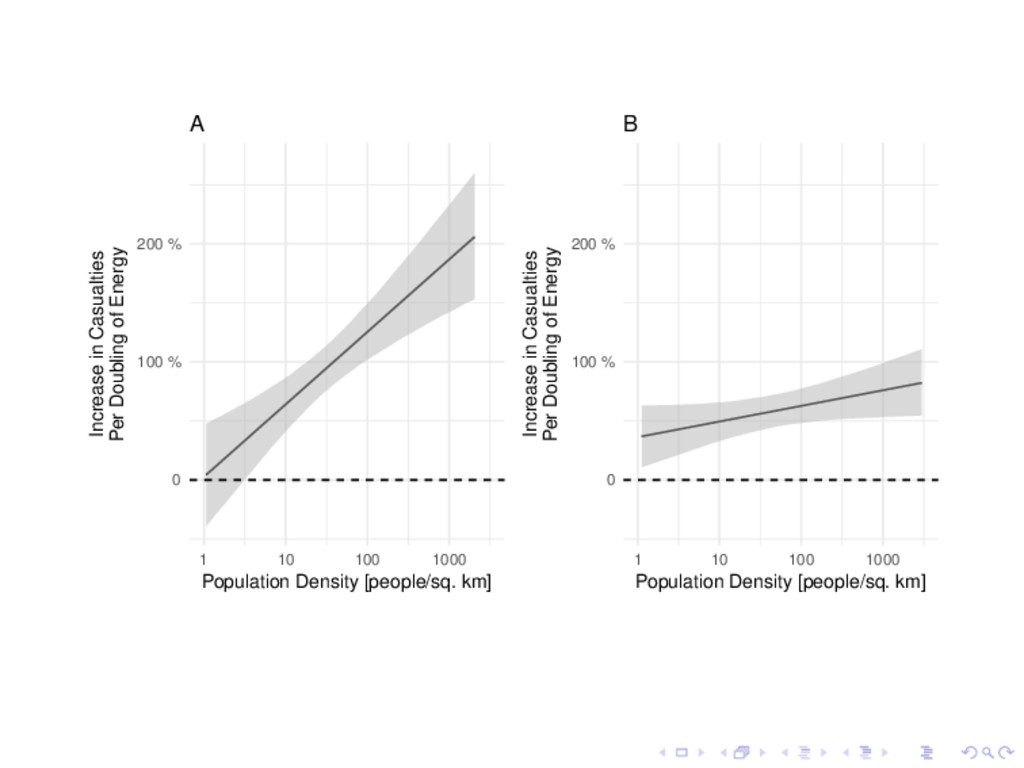
the period 1995–2016 are fit to a statistical model. Storm strength and population are the independent variables and there is an interaction term. More urbanized areas of the Mid South are substantively and significantly more vulnerable to casualties from tornadoes than elsewhere in the country. Casualty rates are higher during the weekend for tornadoes occurring over the Mid South, but not elsewhere. Night and day casualty rates are similar regardless of where they occur. At the state level, increased vulnerability to casualties in more urbanized areas corresponds with a higher percentage of elderly people. What questions do you have?
![Population Density 100 [people/sq. km] Population Density 1000 [people/sq. km]](https://files.speakerdeck.com/presentations/467469faf64d48d781b69dc472cdb35e/slide_9.jpg)
![100 [people/sq. km] 1000 [people/sq. km] 1 [people/sq. km] 10](https://files.speakerdeck.com/presentations/467469faf64d48d781b69dc472cdb35e/slide_12.jpg)
![100 [people/sq. km] 1000 [people/sq. km] 1 [people/sq. km] 10](https://files.speakerdeck.com/presentations/467469faf64d48d781b69dc472cdb35e/slide_13.jpg)