B. Elsner (@JBElsner) & Nam-Young Kang1 Department of Geography, Florida State University Tallahassee, FL June 7, 2017 6th Hurricanes & Climate Change Summit 1National Typhoon Center, Korea Meteorological Administration
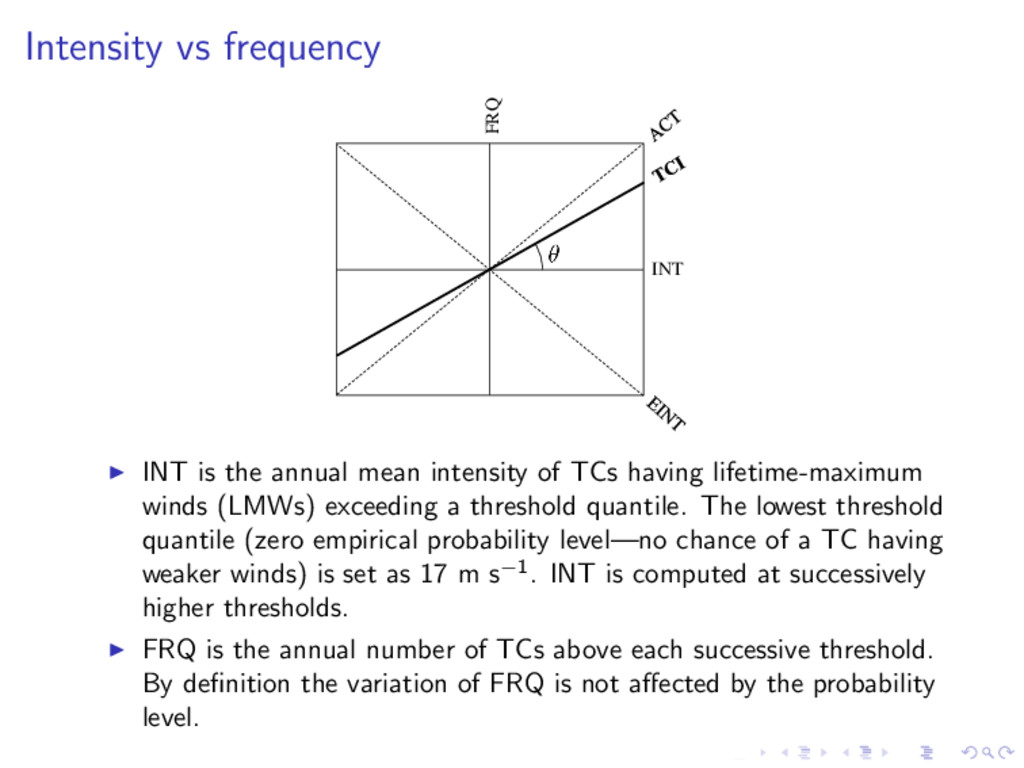
intensity of TCs having lifetime-maximum winds (LMWs) exceeding a threshold quantile. The lowest threshold quantile (zero empirical probability level—no chance of a TC having weaker winds) is set as 17 m s−1. INT is computed at successively higher thresholds. FRQ is the annual number of TCs above each successive threshold. By definition the variation of FRQ is not affected by the probability level.
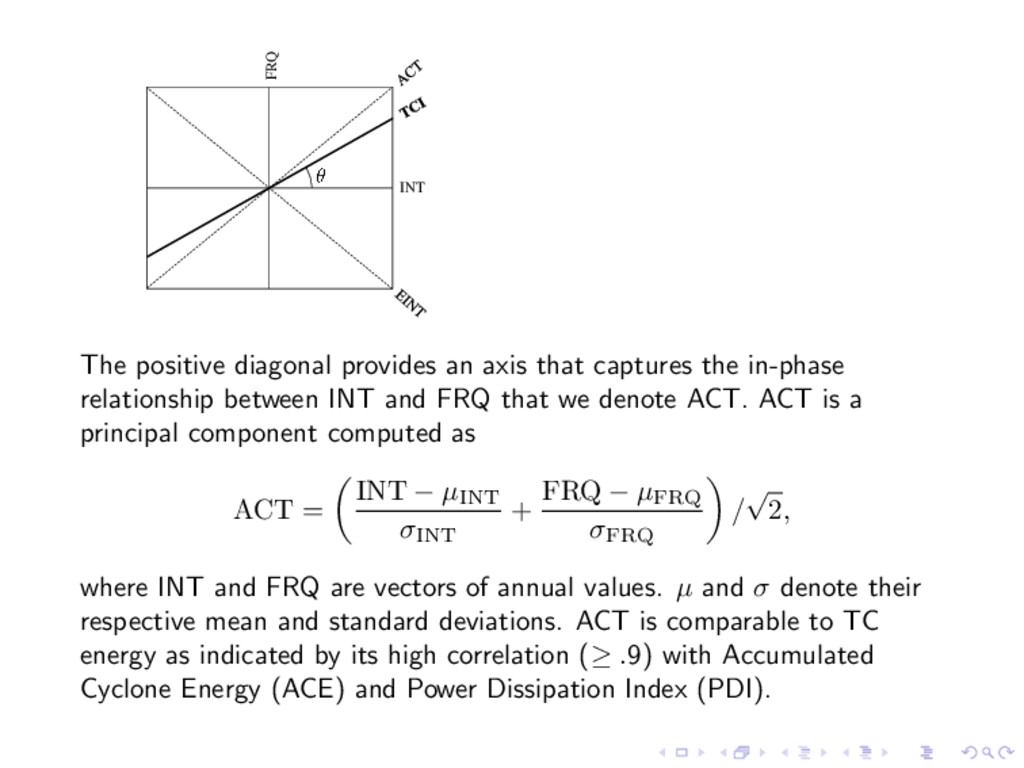
the in-phase relationship between INT and FRQ that we denote ACT. ACT is a principal component computed as ACT = INT − µINT σINT + FRQ − µFRQ σFRQ / √ 2, where INT and FRQ are vectors of annual values. µ and σ denote their respective mean and standard deviations. ACT is comparable to TC energy as indicated by its high correlation (≥ .9) with Accumulated Cyclone Energy (ACE) and Power Dissipation Index (PDI).
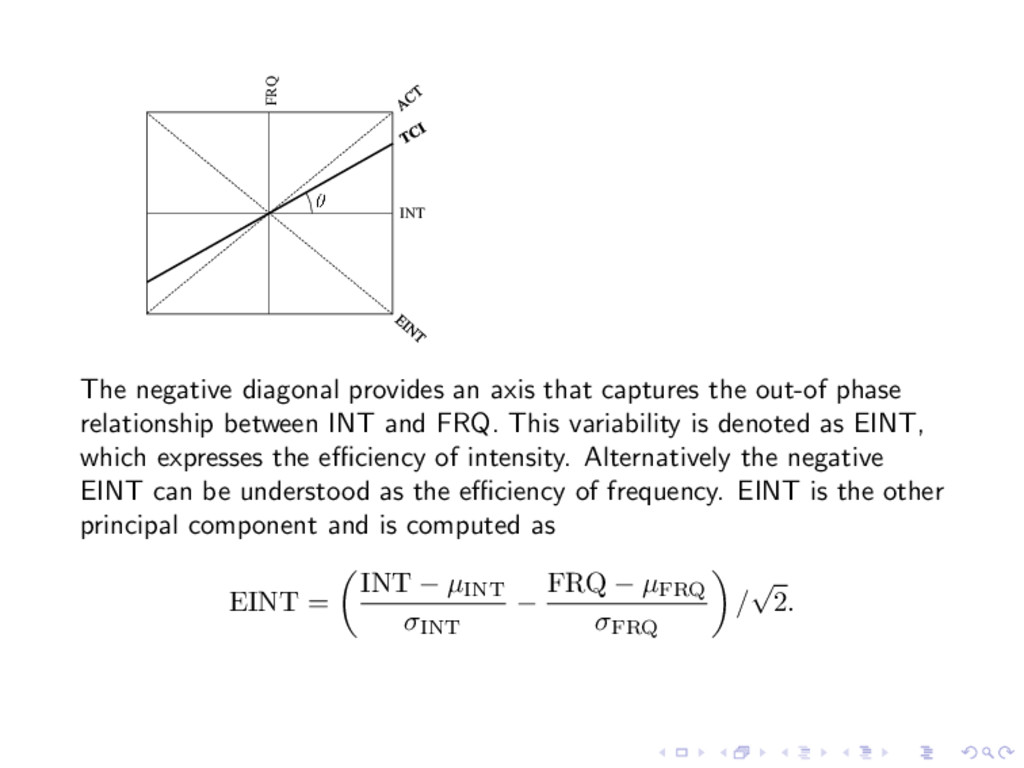
the out-of phase relationship between INT and FRQ. This variability is denoted as EINT, which expresses the efficiency of intensity. Alternatively the negative EINT can be understood as the efficiency of frequency. EINT is the other principal component and is computed as EINT = INT − µINT σINT − FRQ − µFRQ σFRQ / √ 2.
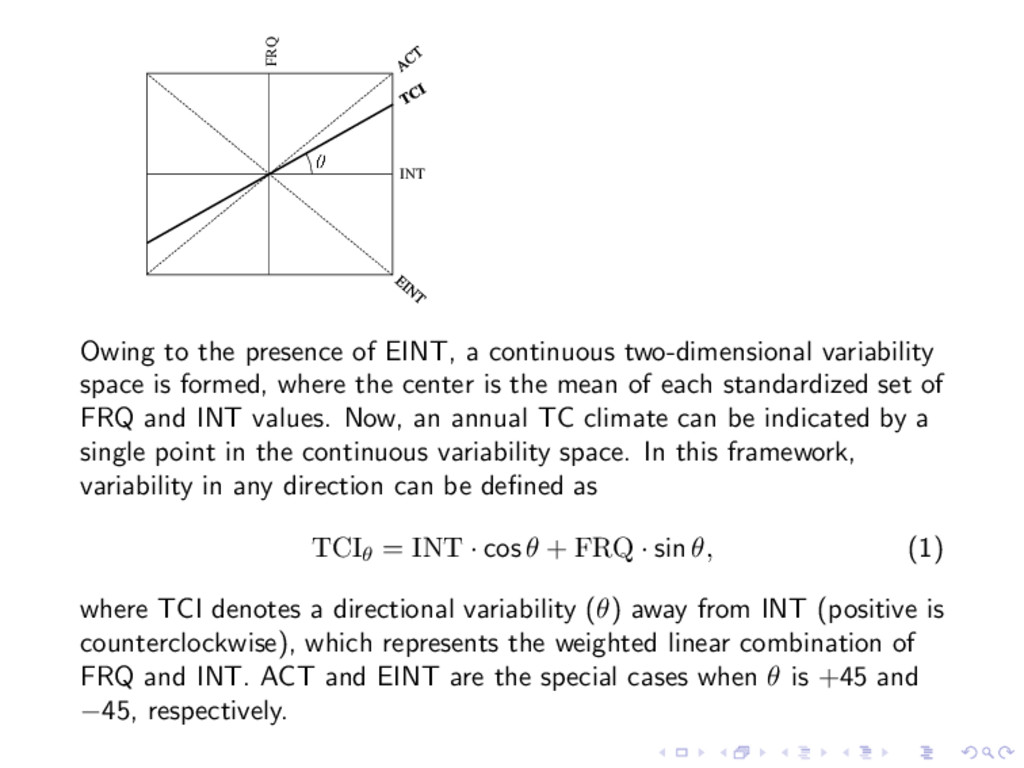
two-dimensional variability space is formed, where the center is the mean of each standardized set of FRQ and INT values. Now, an annual TC climate can be indicated by a single point in the continuous variability space. In this framework, variability in any direction can be defined as TCIθ = INT · cos θ + FRQ · sin θ, (1) where TCI denotes a directional variability (θ) away from INT (positive is counterclockwise), which represents the weighted linear combination of FRQ and INT. ACT and EINT are the special cases when θ is +45 and −45, respectively.
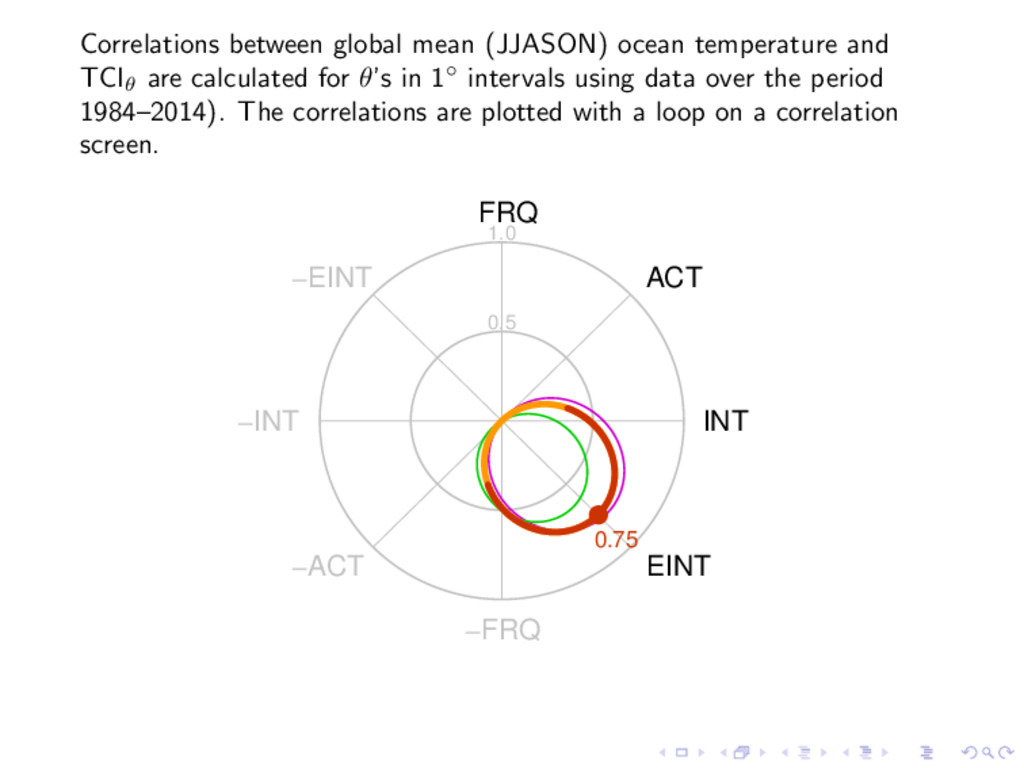
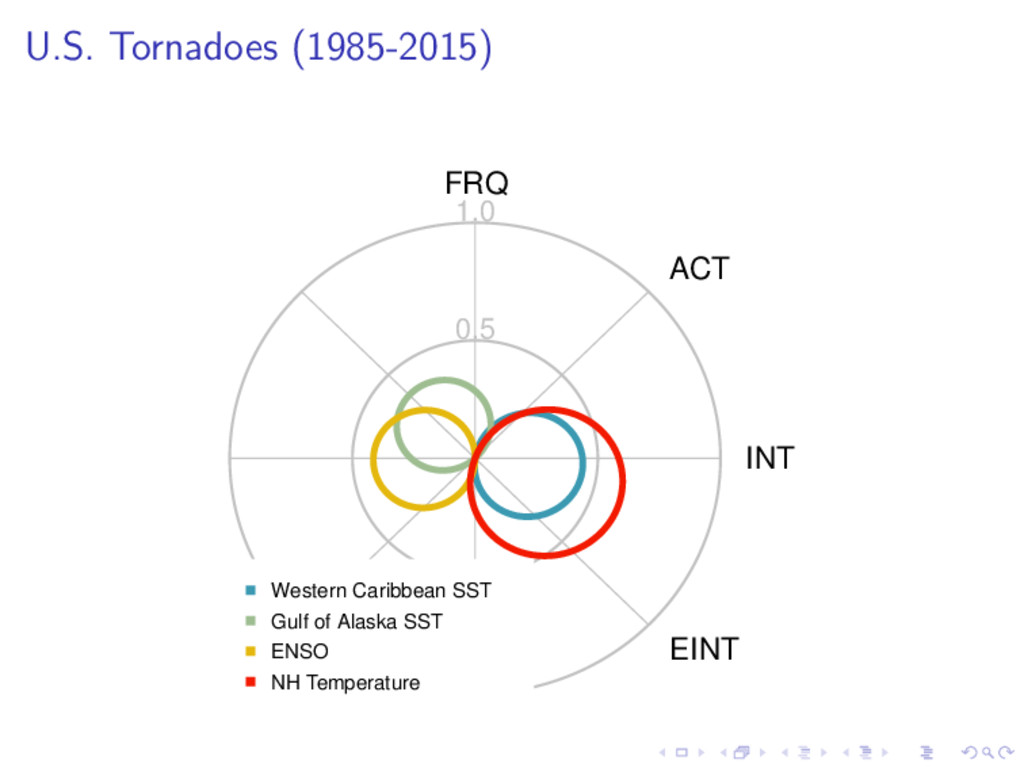
calculated for θ’s in 1◦ intervals using data over the period 1984–2014). The correlations are plotted with a loop on a correlation screen. INT ACT FRQ EINT −INT −ACT −FRQ −EINT 0.5 1.0 q 0.75
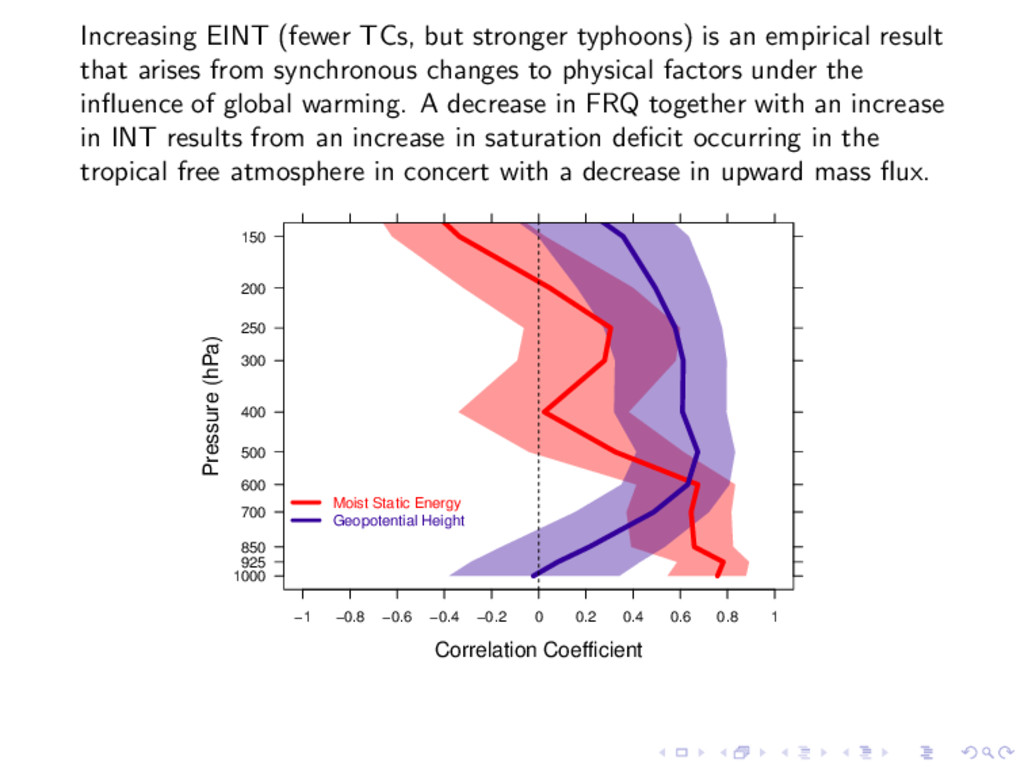
result that arises from synchronous changes to physical factors under the influence of global warming. A decrease in FRQ together with an increase in INT results from an increase in saturation deficit occurring in the tropical free atmosphere in concert with a decrease in upward mass flux. −1 −0.8 −0.6 −0.4 −0.2 0 0.2 0.4 0.6 0.8 1 1000 925 850 700 600 500 400 300 250 200 150 Correlation Coefficient Pressure (hPa) Moist Static Energy Geopotential Height
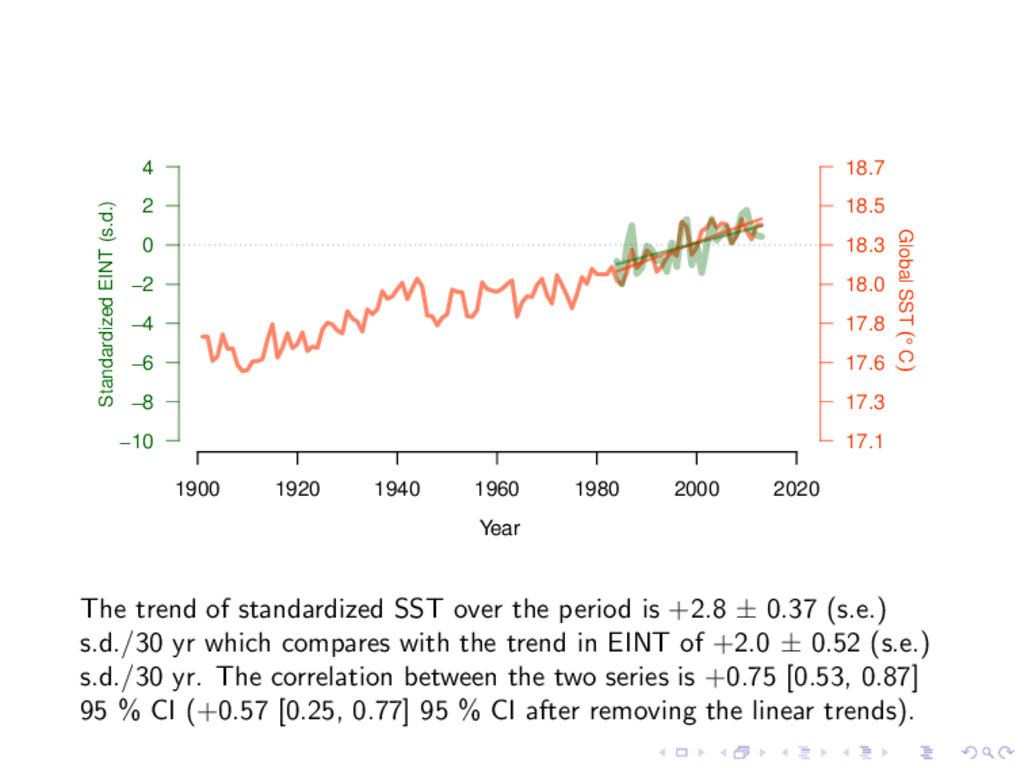
−4 −2 0 2 4 17.1 17.3 17.6 17.8 18.0 18.3 18.5 18.7 Year Standardized EINT (s.d.) Global SST (° C) The trend of standardized SST over the period is +2.8 ± 0.37 (s.e.) s.d./30 yr which compares with the trend in EINT of +2.0 ± 0.52 (s.e.) s.d./30 yr. The correlation between the two series is +0.75 [0.53, 0.87] 95 % CI (+0.57 [0.25, 0.77] 95 % CI after removing the linear trends).
climate-change studies. How often and how strong are the two canonical components of storminess. Analyzing frequency independently from intensity illuminates a broad theoretical space of storm climate variability. With typhoons in the Pacific and tornadoes in the U.S., the finger print of climate change appears to be fewer, but stronger. Questions?