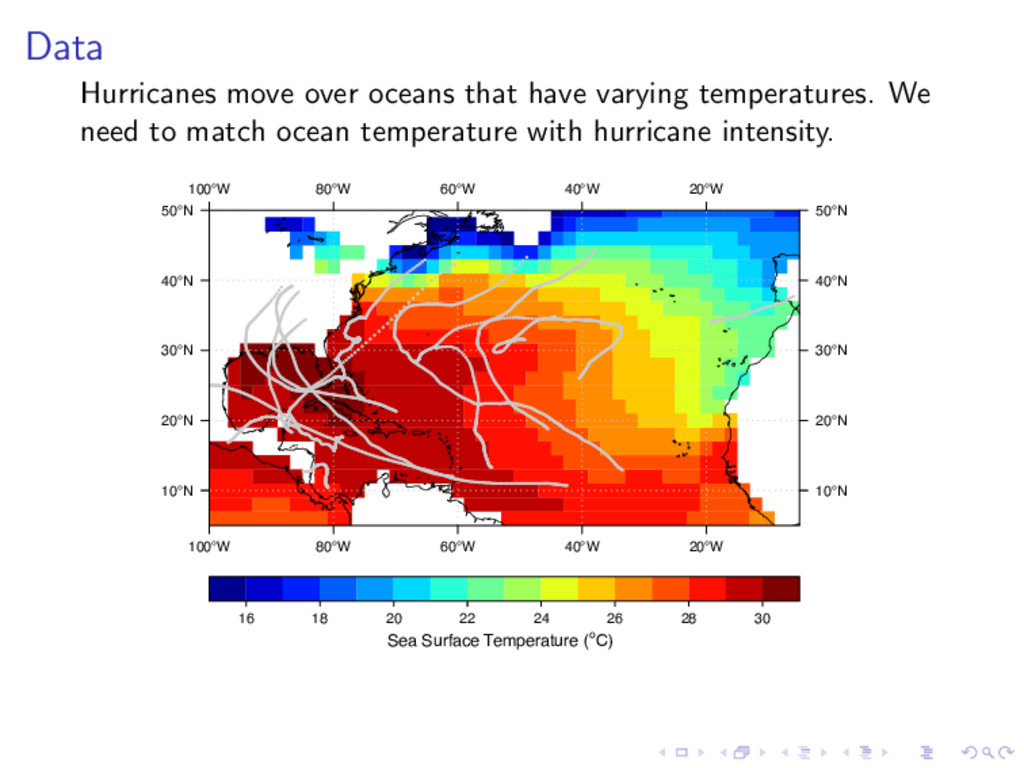
how often. But what about the future? Greater risk? No simple ways to get answers. Theory is limited. We don’t have a theory of climate. And we don’t know everything about hurricanes. Models don’t adequately represent the atmosphere or the ocean. And they don’t adequately resolve hurricanes. Data don’t go back far enough. They vary in quality. Social media won’t help unless you’re interested in mere opinions and bickering. Solution: Use available theories (thermodynamics, statistics) together with quality data.
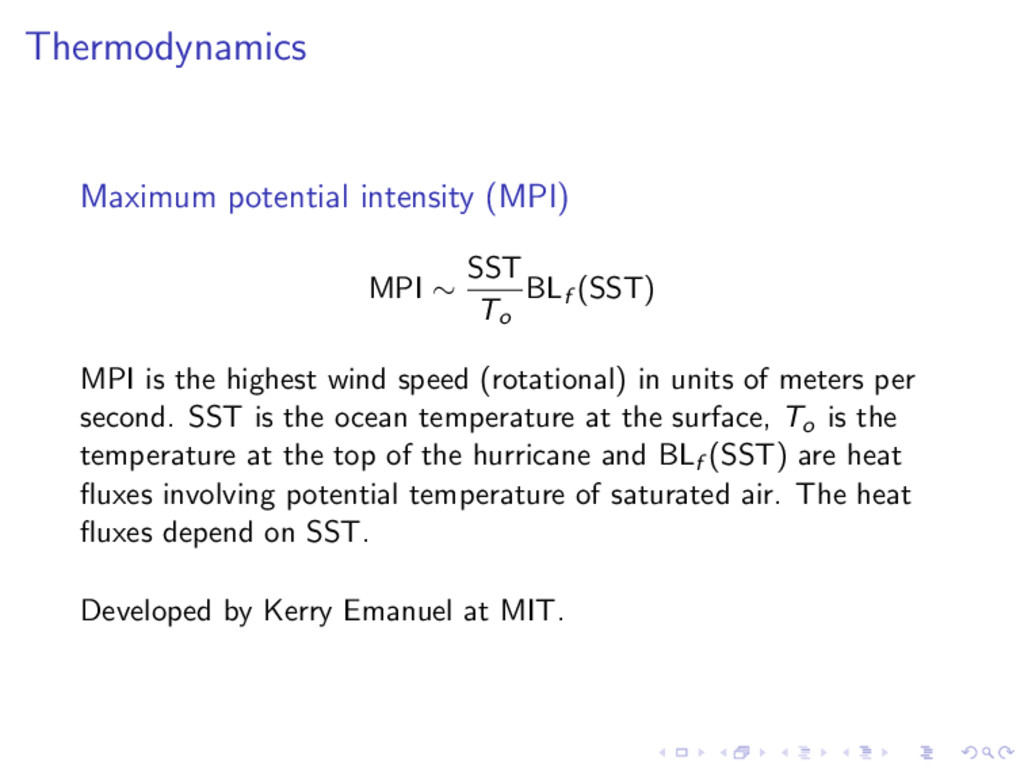
(SST) MPI is the highest wind speed (rotational) in units of meters per second. SST is the ocean temperature at the surface, To is the temperature at the top of the hurricane and BLf (SST) are heat fluxes involving potential temperature of saturated air. The heat fluxes depend on SST. Developed by Kerry Emanuel at MIT.
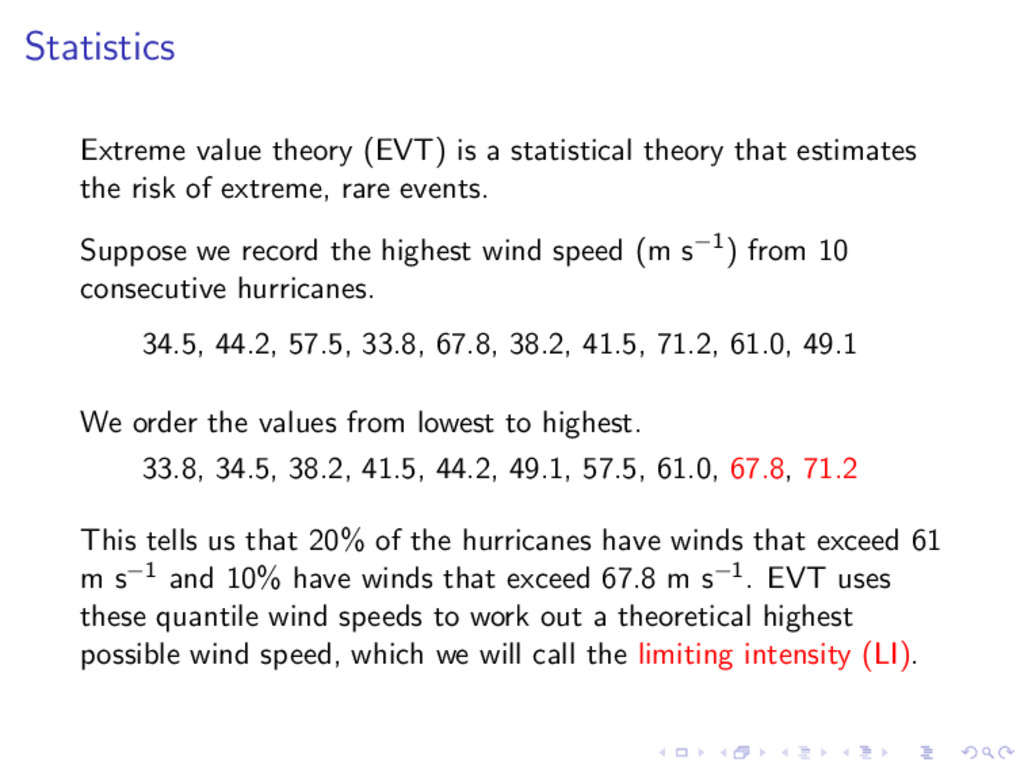
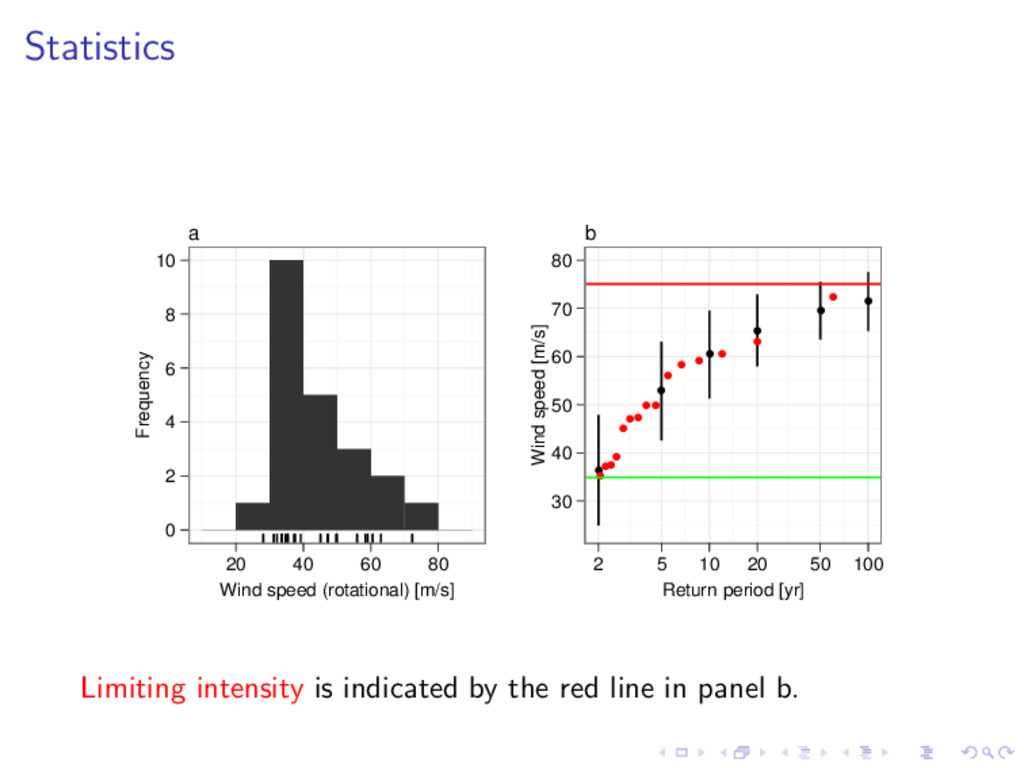
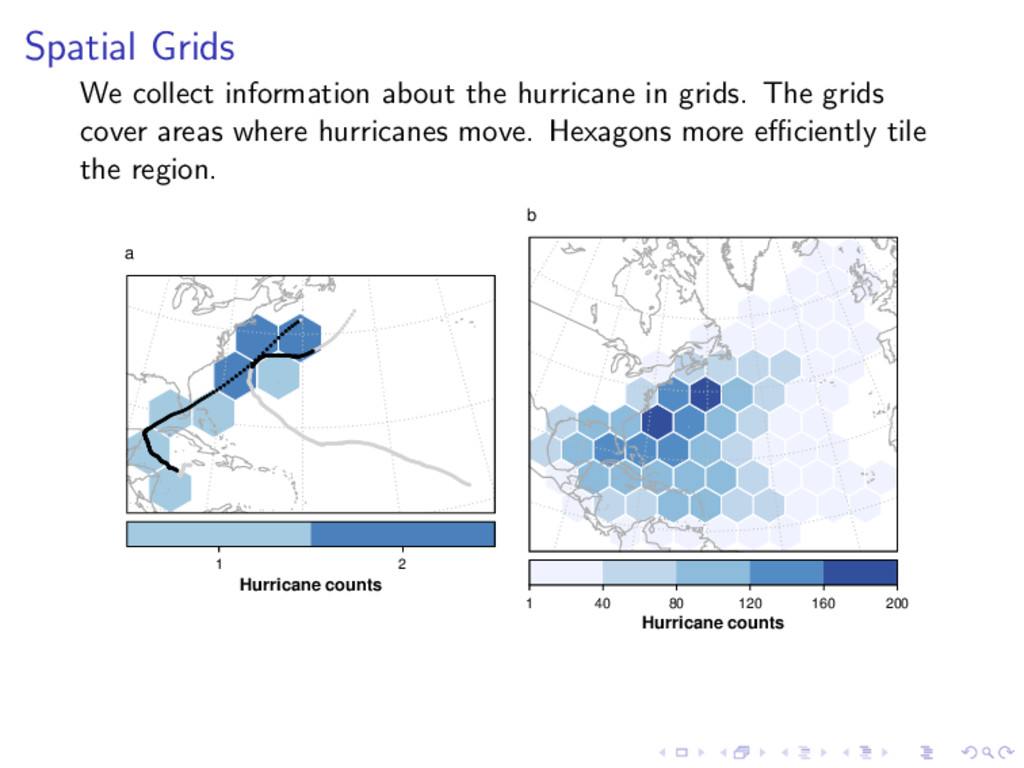
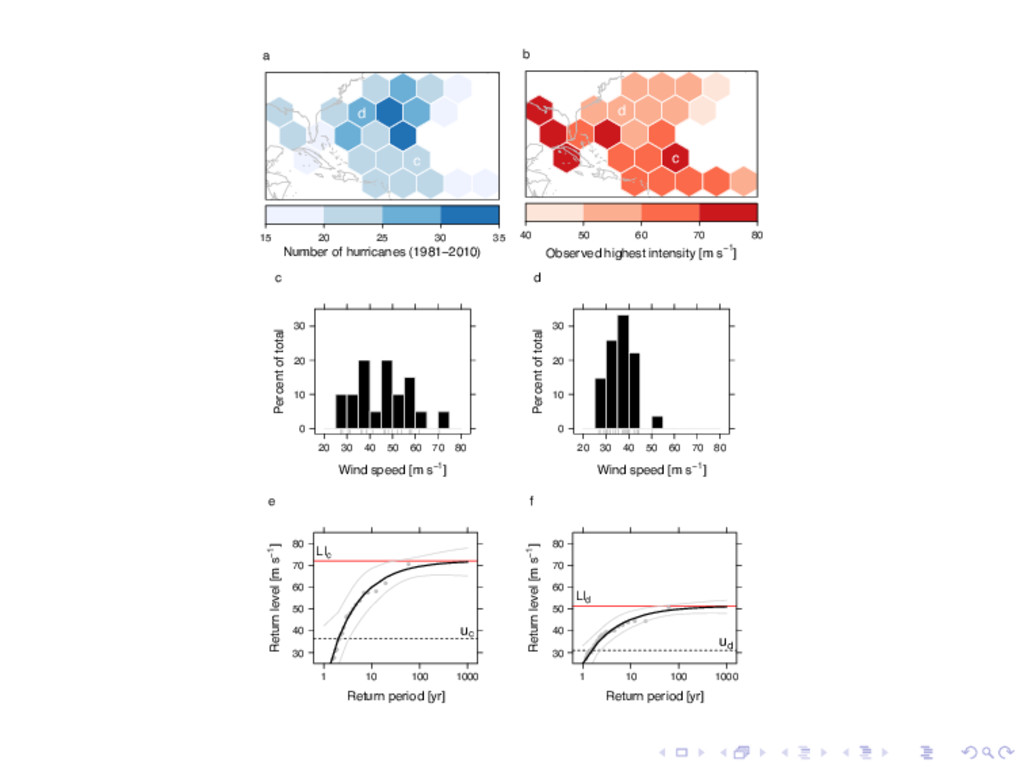
estimates the risk of extreme, rare events. Suppose we record the highest wind speed (m s−1) from 10 consecutive hurricanes. 34.5, 44.2, 57.5, 33.8, 67.8, 38.2, 41.5, 71.2, 61.0, 49.1 We order the values from lowest to highest. 33.8, 34.5, 38.2, 41.5, 44.2, 49.1, 57.5, 61.0, 67.8, 71.2 This tells us that 20% of the hurricanes have winds that exceed 61 m s−1 and 10% have winds that exceed 67.8 m s−1. EVT uses these quantile wind speeds to work out a theoretical highest possible wind speed, which we will call the limiting intensity (LI).
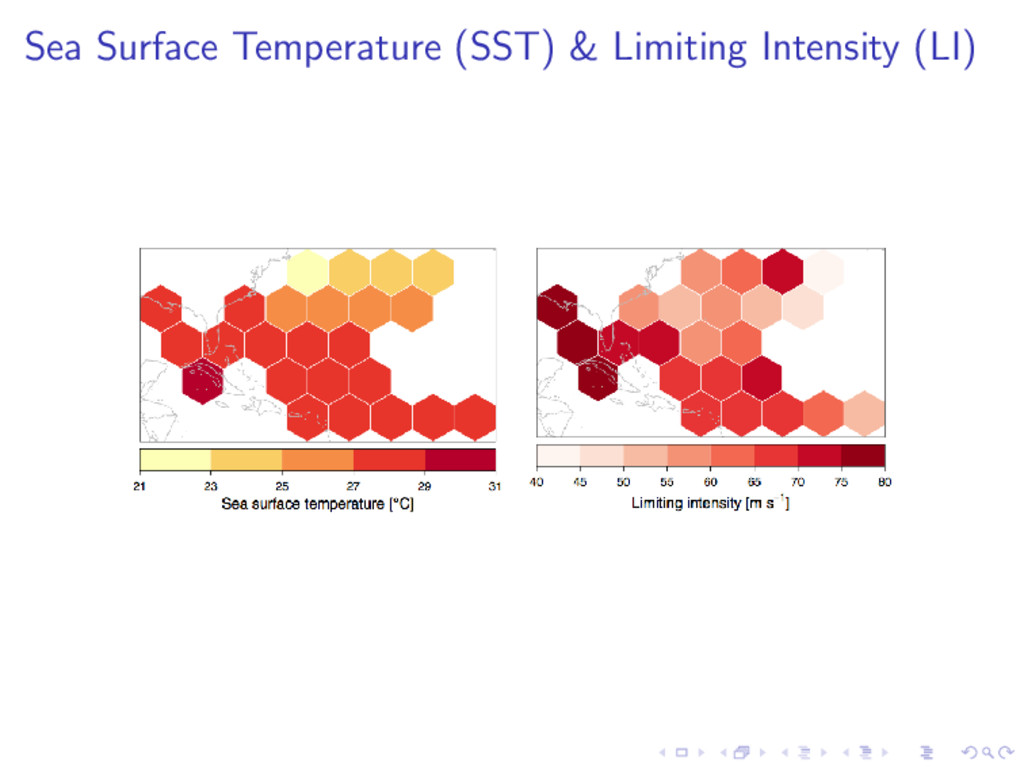
use to compare with Kerry Emanuel’s theoretical maximum potential intensity (MPI). How should we make this comparison? Absolute values of LI are not as important as how LI changes with ocean temperature (SST). How can we estimate how LI changes with SST?
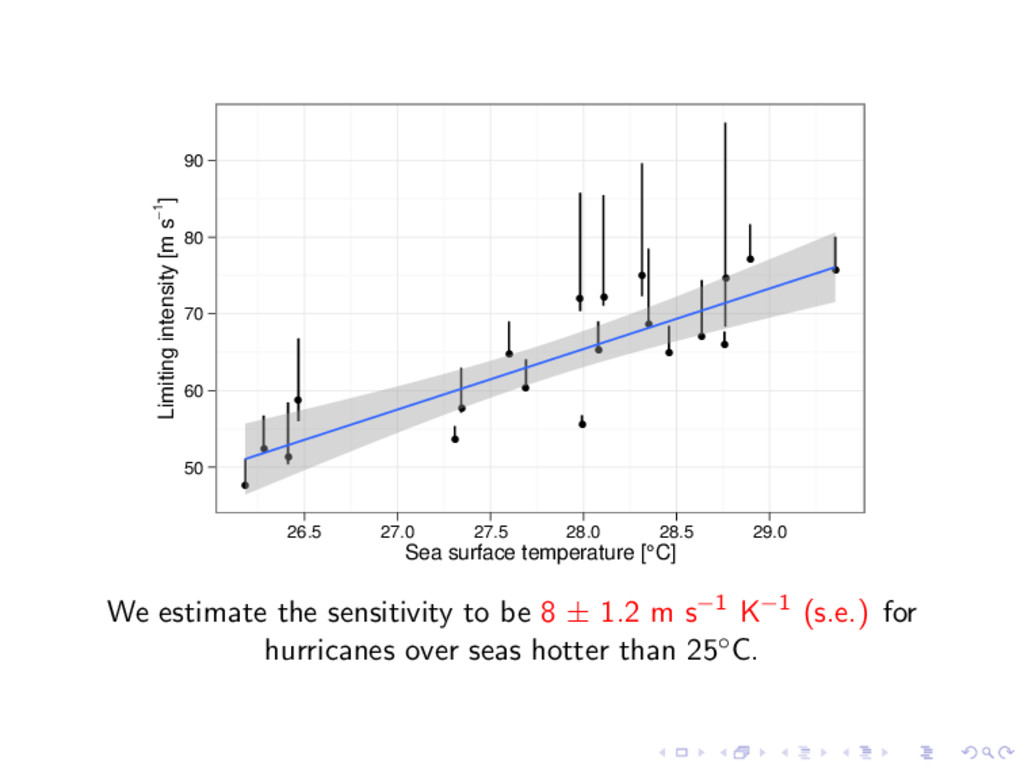
q q q q q q q q q q q q q q q 26.5 27.0 27.5 28.0 28.5 29.0 Sea surface temperature [°C] Limiting intensity [m s−1] We estimate the sensitivity to be 8 ± 1.2 m s−1 K−1 (s.e.) for hurricanes over seas hotter than 25◦C.
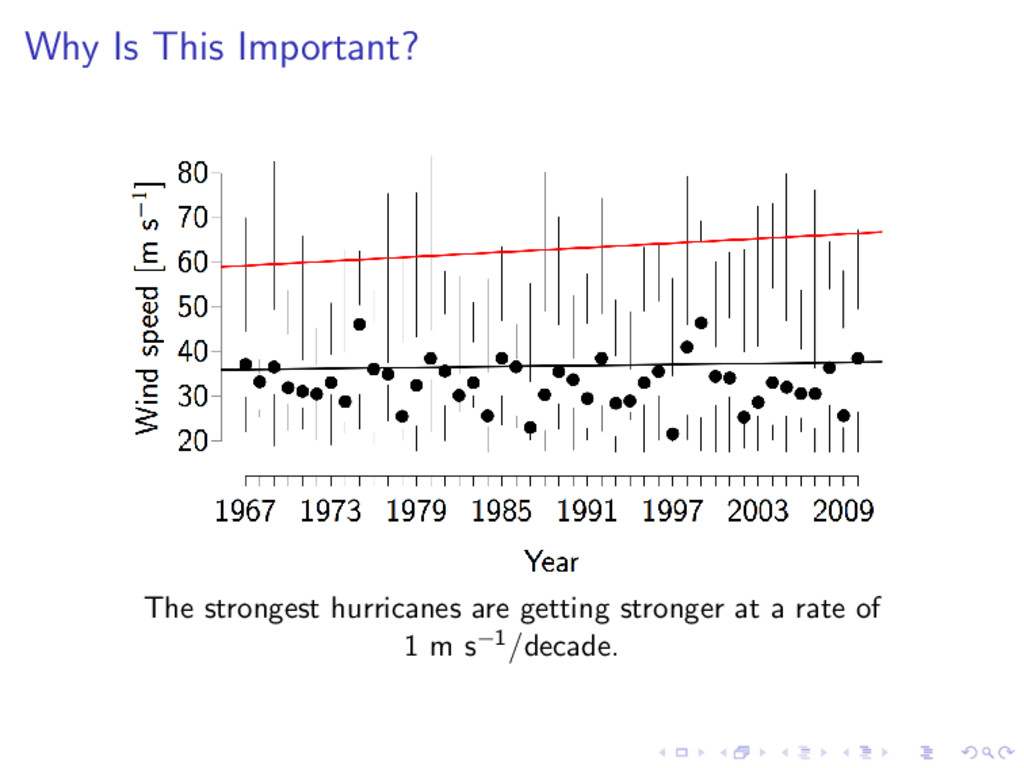
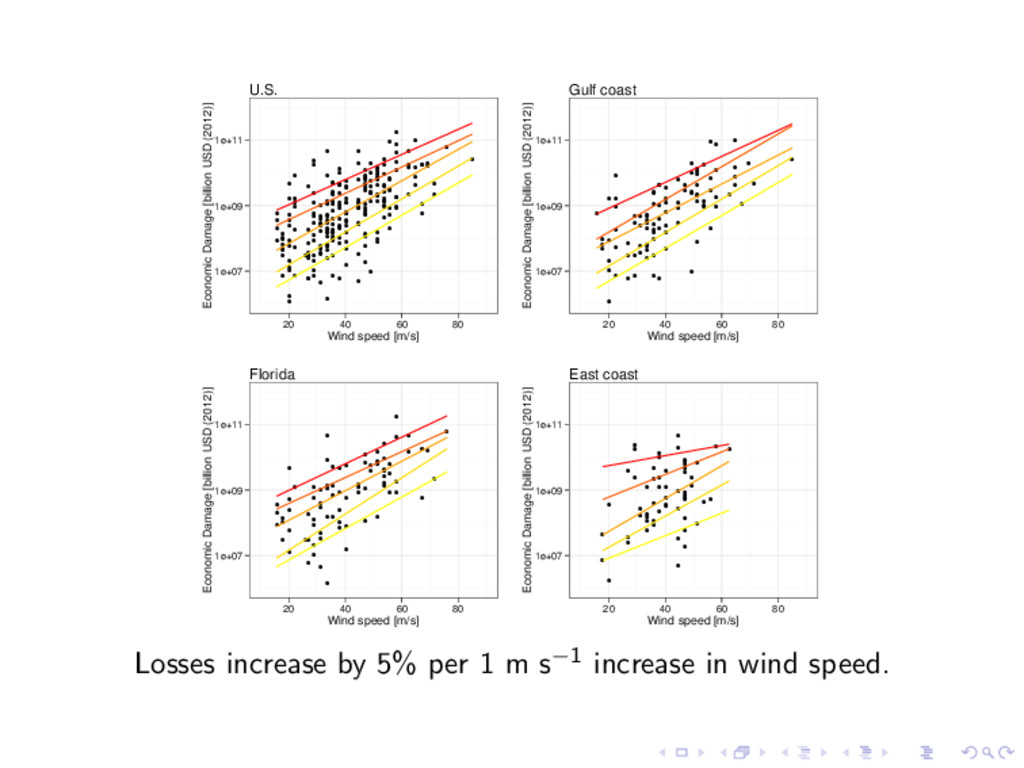
the future by combining theory with data. It is likely that the strongest hurricanes will get stronger at about 8 m s−1 per degree of ocean warming. This amounts to about 1 m s−1 per decade at the current rate, which translates to about a 5% increase in loss per decade independent of exposure. What other factors affect this sensitivity? Shear, upper-level temperature, etc.
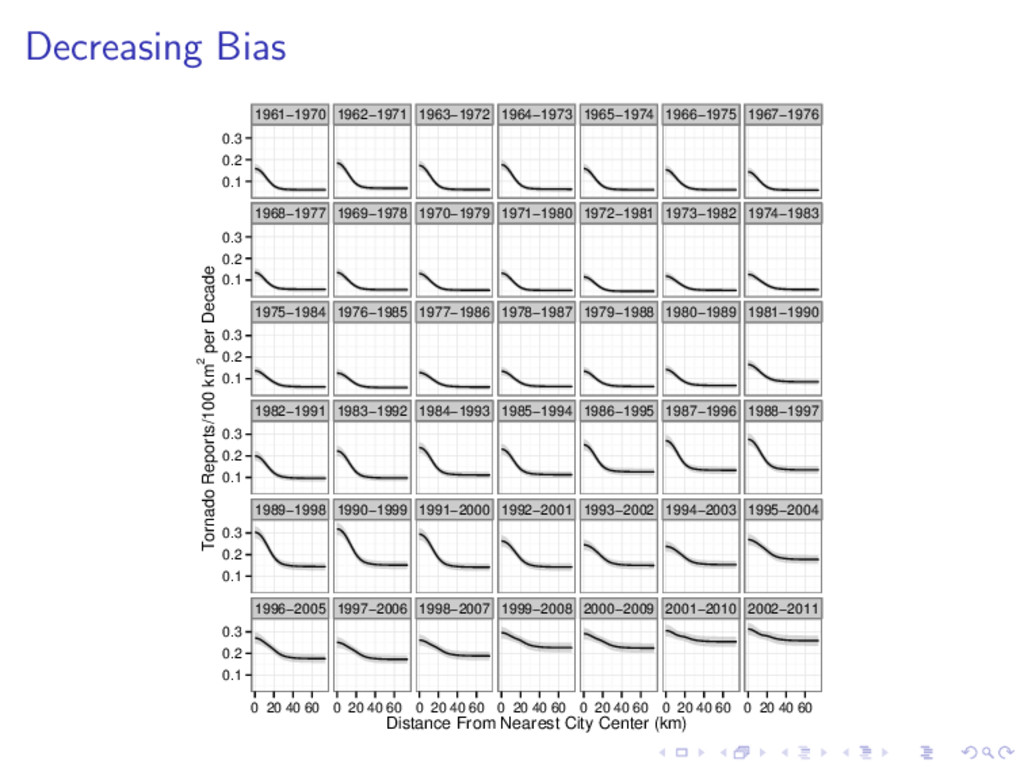
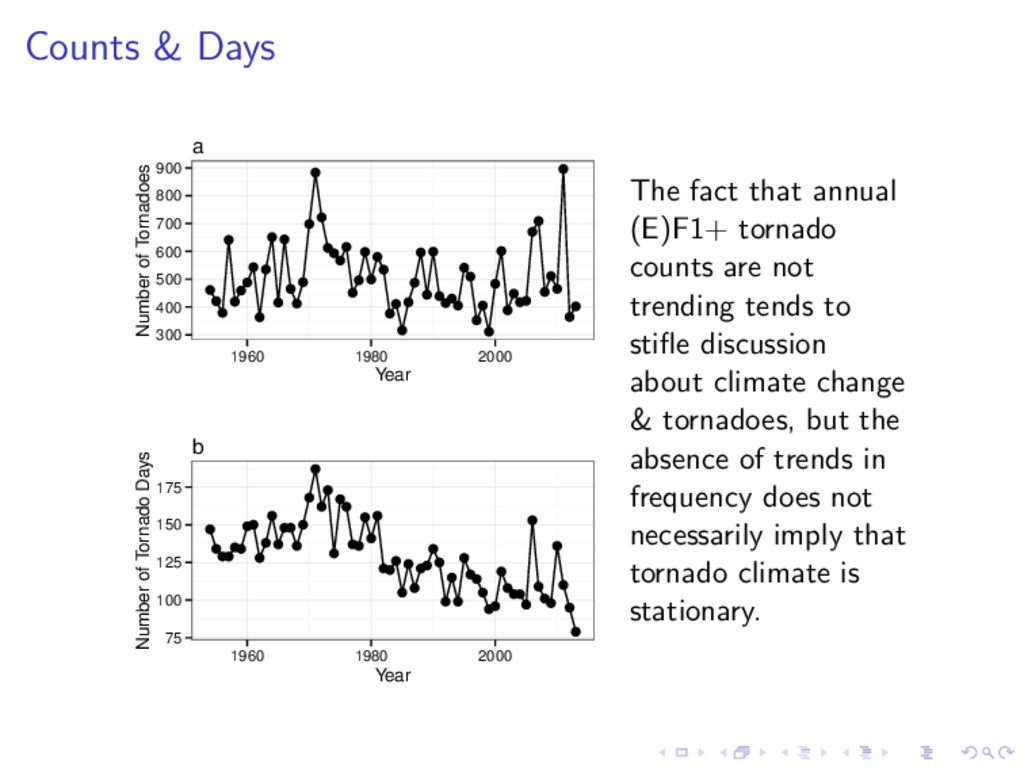
focus on annual counts limits how we might understand a changing tornado climate. The fact that annual (E)F1+ tornado counts are not trending tends to stifle discussion about climate change & tornadoes. The absence of trends in tornado occurrence does not imply that tornado climate is stationary. The number of days with tornadoes or where they occur provide additional analytics for understanding how tornadoes might be changing.
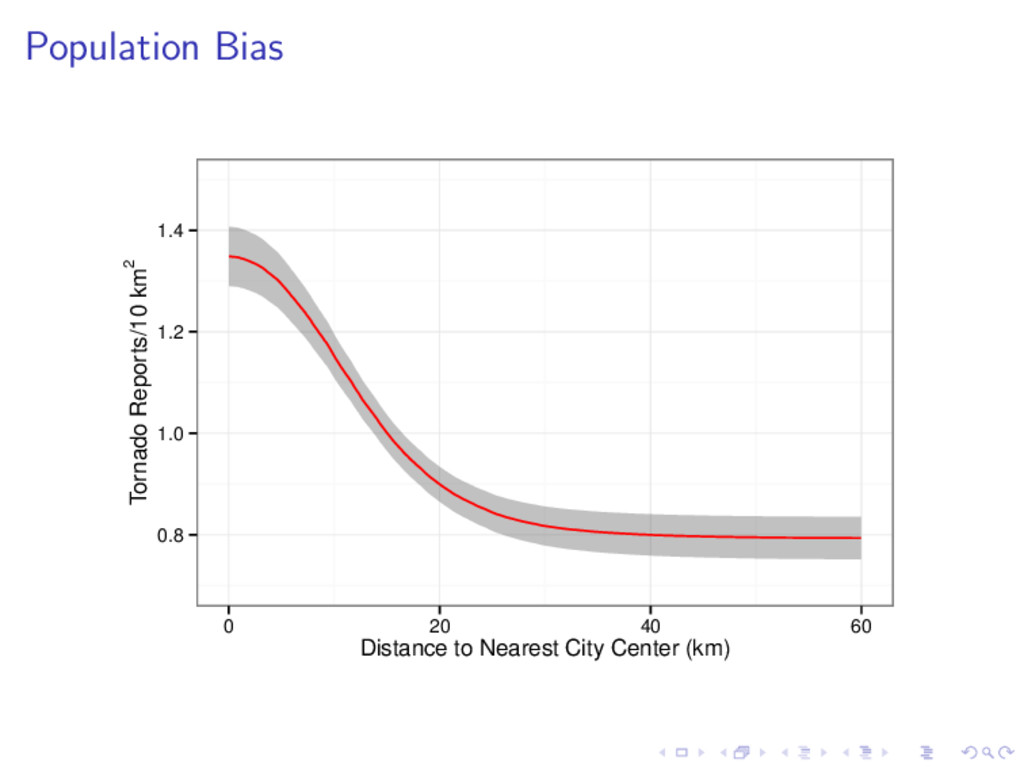
Center (SPC) maintains the best available record of tornadoes in the United States compiled from National Weather Service (NWS) Storm Data publications and reviewed by the NCDC. Improved observational practices lead to an increase in the number of reported weaker tornadoes. The damage scale used to rate tornadoes was first published in 1971 and adopted for rating tornadoes in the near aftermath in 1973. Brief tornadoes may go undocumented in places with few people or limited communication infrastructure. Population bias.
1960 1980 2000 Year Number of Tornadoes a 75 100 125 150 175 1960 1980 2000 Year Number of Tornado Days b The fact that annual (E)F1+ tornado counts are not trending tends to stifle discussion about climate change & tornadoes, but the absence of trends in frequency does not necessarily imply that tornado climate is stationary.
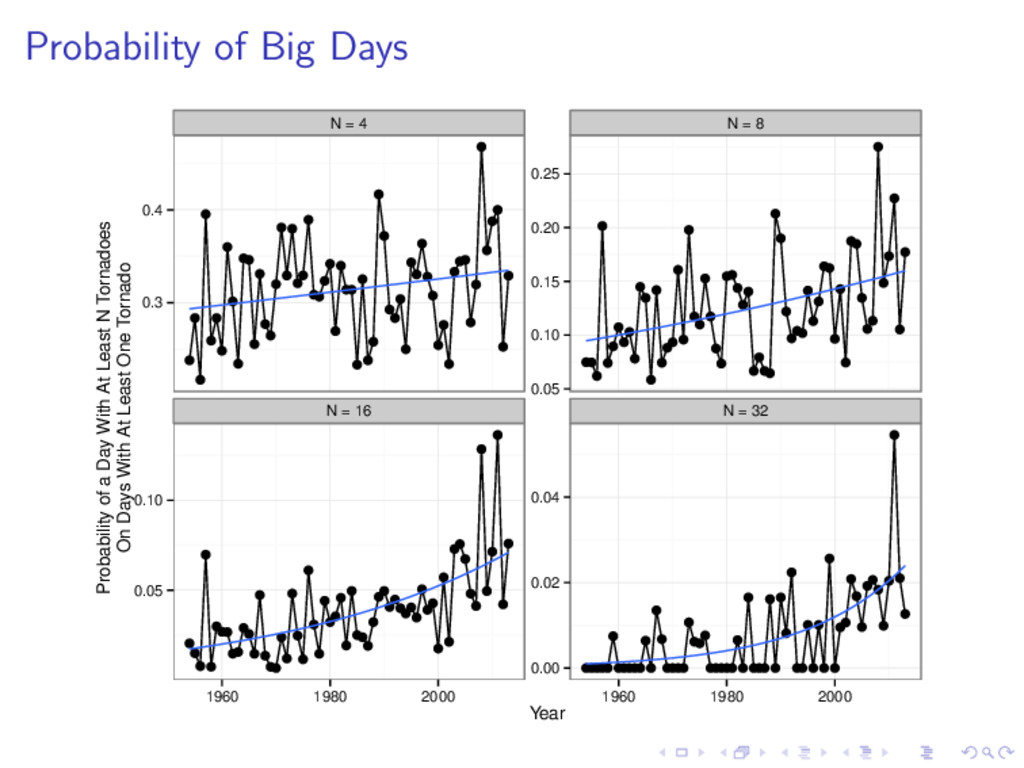
N = 16 N = 32 0.3 0.4 0.05 0.10 0.15 0.20 0.25 0.05 0.10 0.00 0.02 0.04 1960 1980 2000 1960 1980 2000 Year Probability of a Day With At Least N Tornadoes On Days With At Least One Tornado
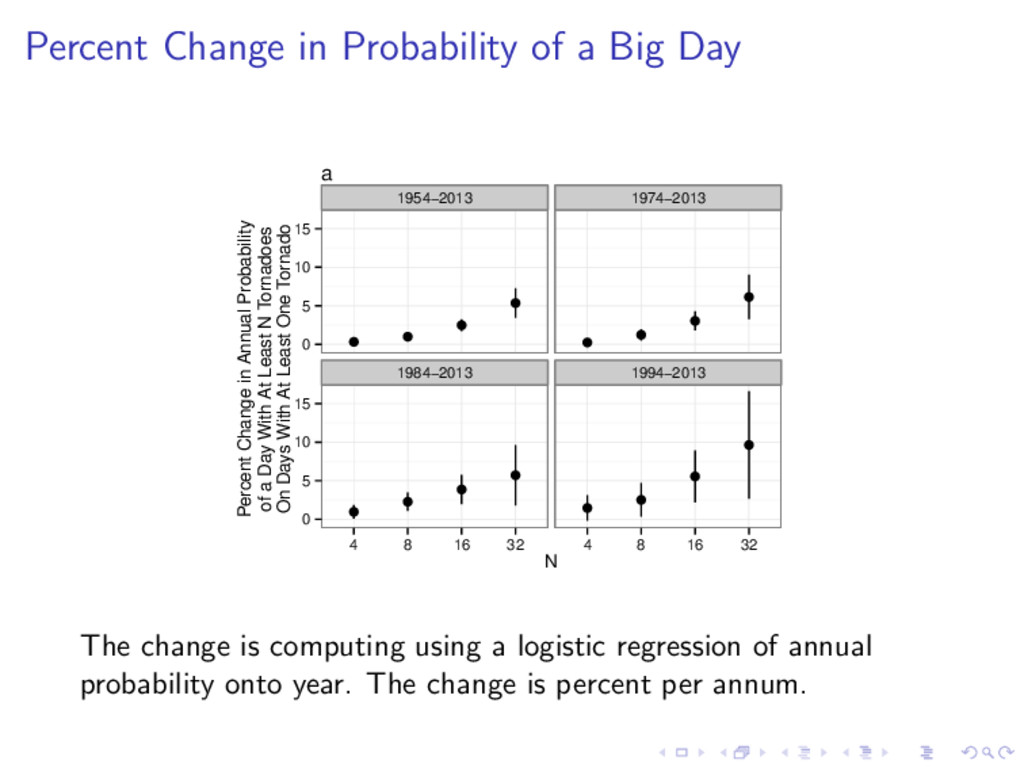
1984−2013 1994−2013 0 5 10 15 0 5 10 15 4 8 16 32 4 8 16 32 N Percent Change in Annual Probability of a Day With At Least N Tornadoes On Days With At Least One Tornado a The change is computing using a logistic regression of annual probability onto year. The change is percent per annum.
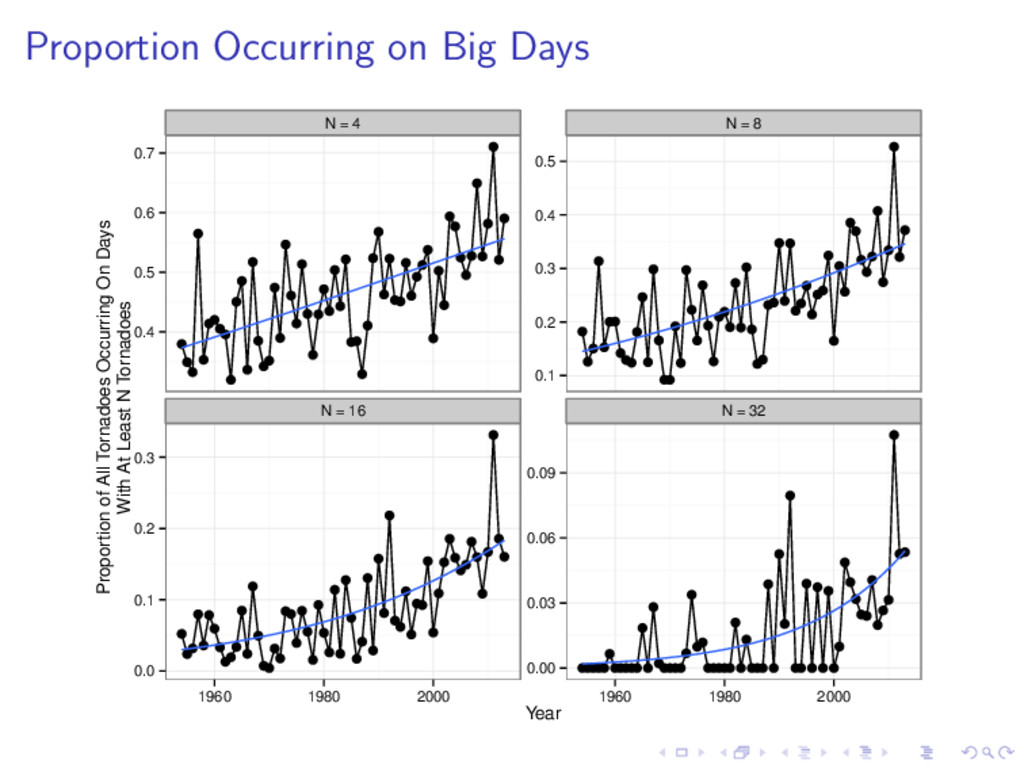
8 N = 16 N = 32 0.4 0.5 0.6 0.7 0.1 0.2 0.3 0.4 0.5 0.0 0.1 0.2 0.3 0.00 0.03 0.06 0.09 1960 1980 2000 1960 1980 2000 Year Proportion of All Tornadoes Occurring On Days With At Least N Tornadoes
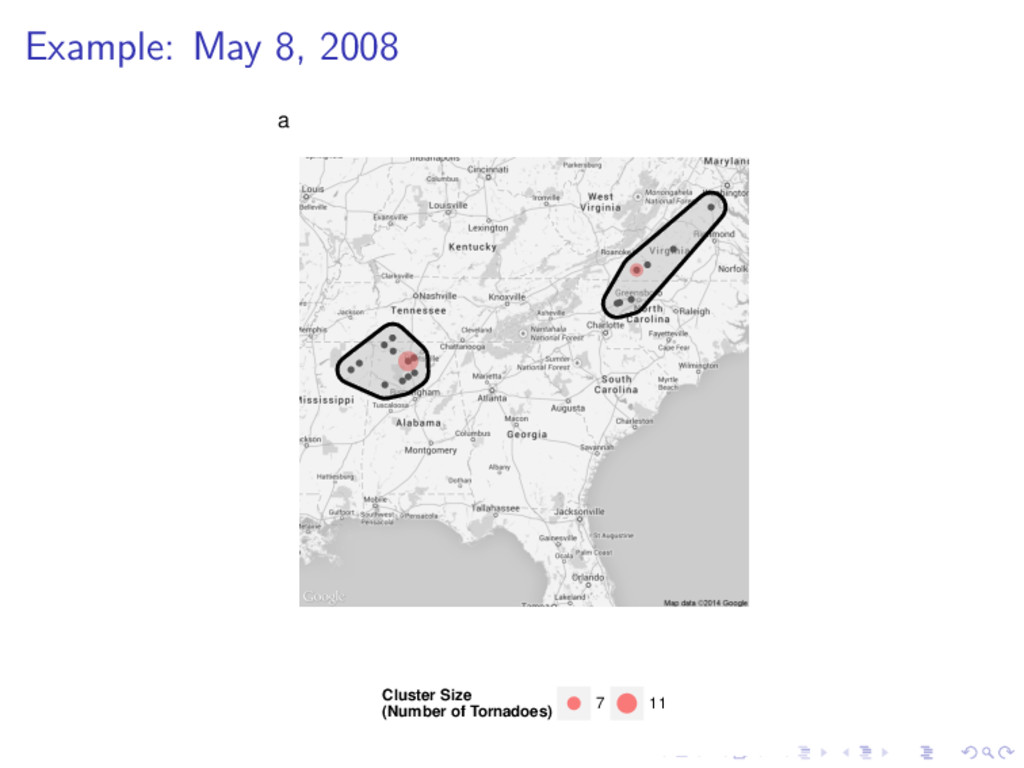
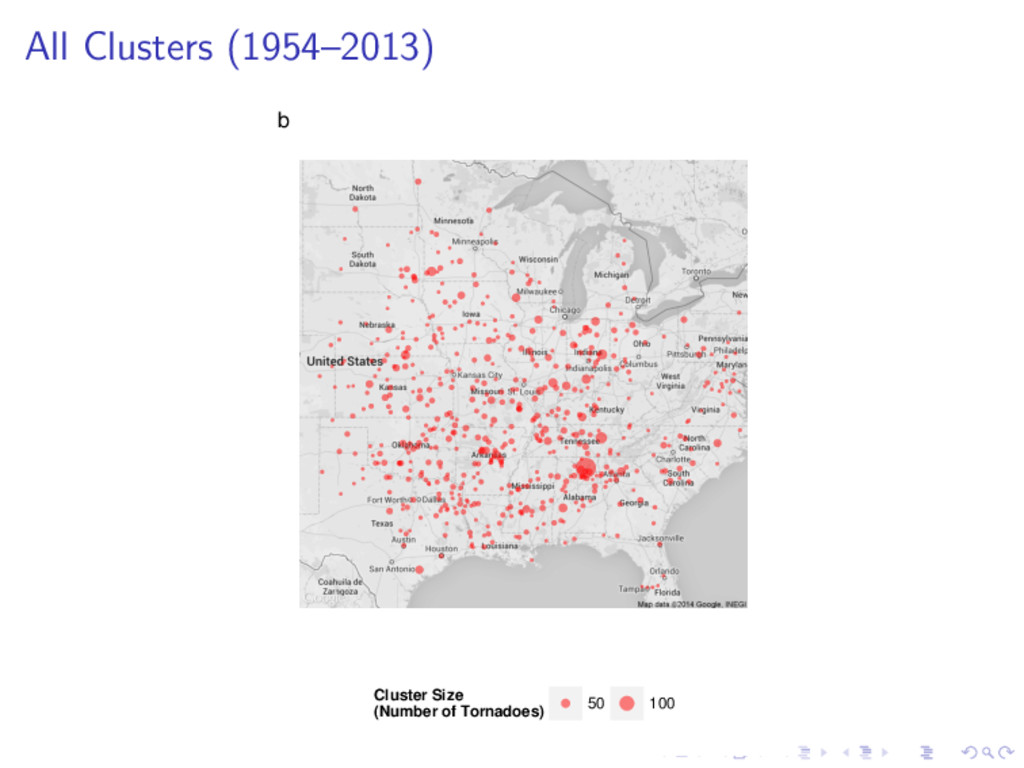
tornado days) is simply larger areas favorable for tornadoes. We call this the large-scale hypothesis because it hints at the involvement of larger scale dynamical factors like wind shear as the cause. To examine evidence for this hypothesis, here we consider changes to the spatial dimensions of tornado occurrences. But what do we mean by a tornado cluster?
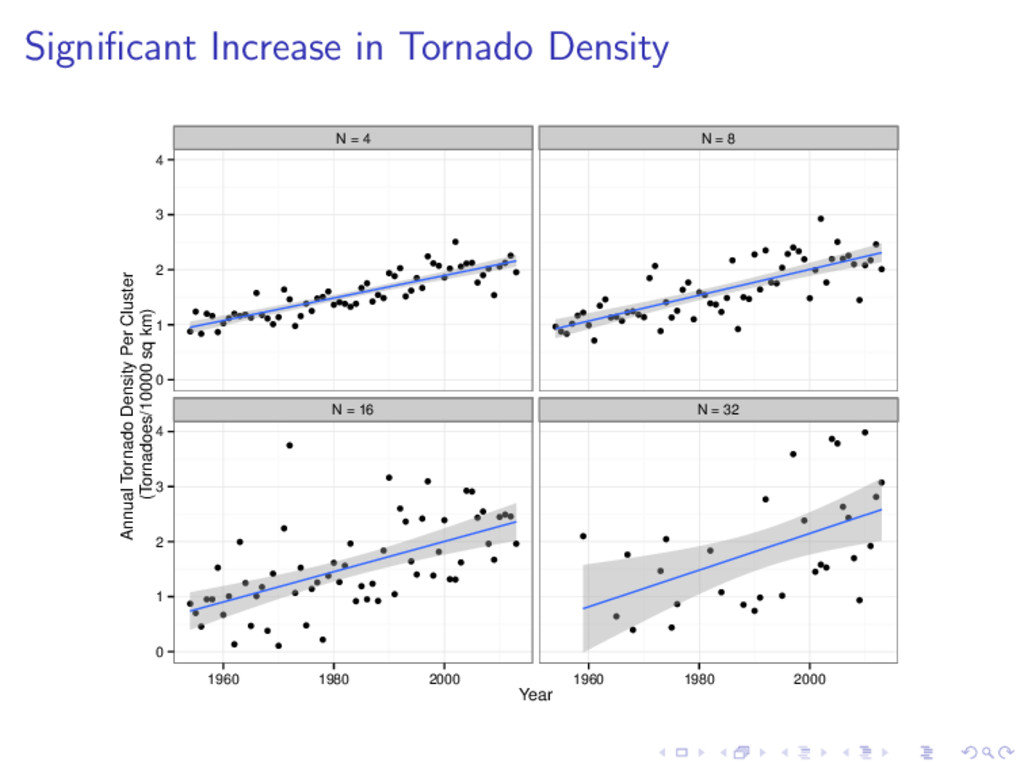
with densely packed clusters of tornadoes is increasing. The increasing density of tornado occurrences within clusters suggests that the explanation for an increasing proportion of tornadoes occurring on big days might involve local-scale thermodynamics. We hypothesize that increases in both CAPE, driven by increases in low-level moisture, and CIN, driven by warming aloft, could lead to fewer days with tornadoes and to smaller, but more active, areas of severe convection on days with tornadoes.
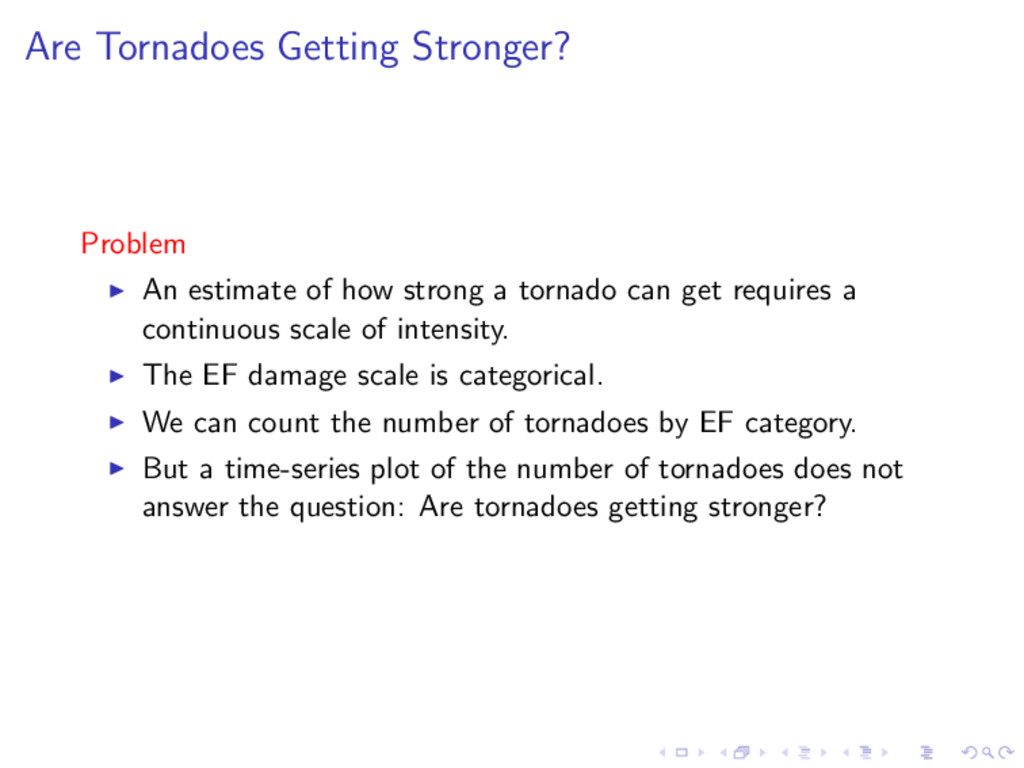
a tornado can get requires a continuous scale of intensity. The EF damage scale is categorical. We can count the number of tornadoes by EF category. But a time-series plot of the number of tornadoes does not answer the question: Are tornadoes getting stronger?
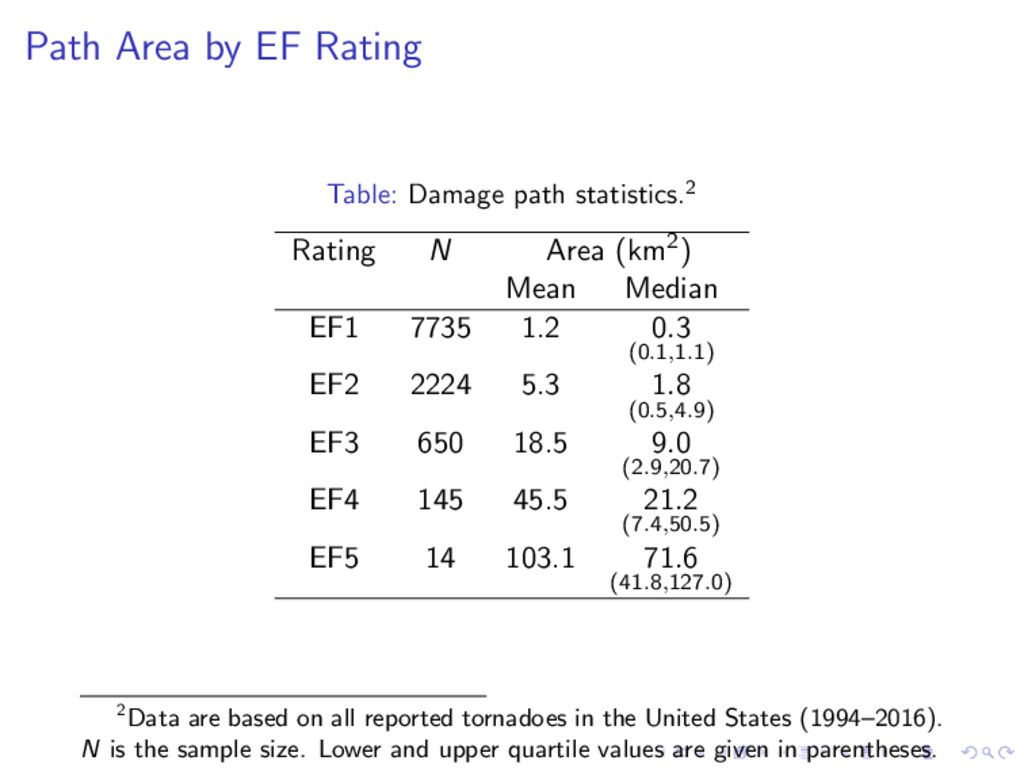
N Area (km2) Mean Median EF1 7735 1.2 0.3 (0.1,1.1) EF2 2224 5.3 1.8 (0.5,4.9) EF3 650 18.5 9.0 (2.9,20.7) EF4 145 45.5 21.2 (7.4,50.5) EF5 14 103.1 71.6 (41.8,127.0) 2Data are based on all reported tornadoes in the United States (1994–2016). N is the sample size. Lower and upper quartile values are given in parentheses.
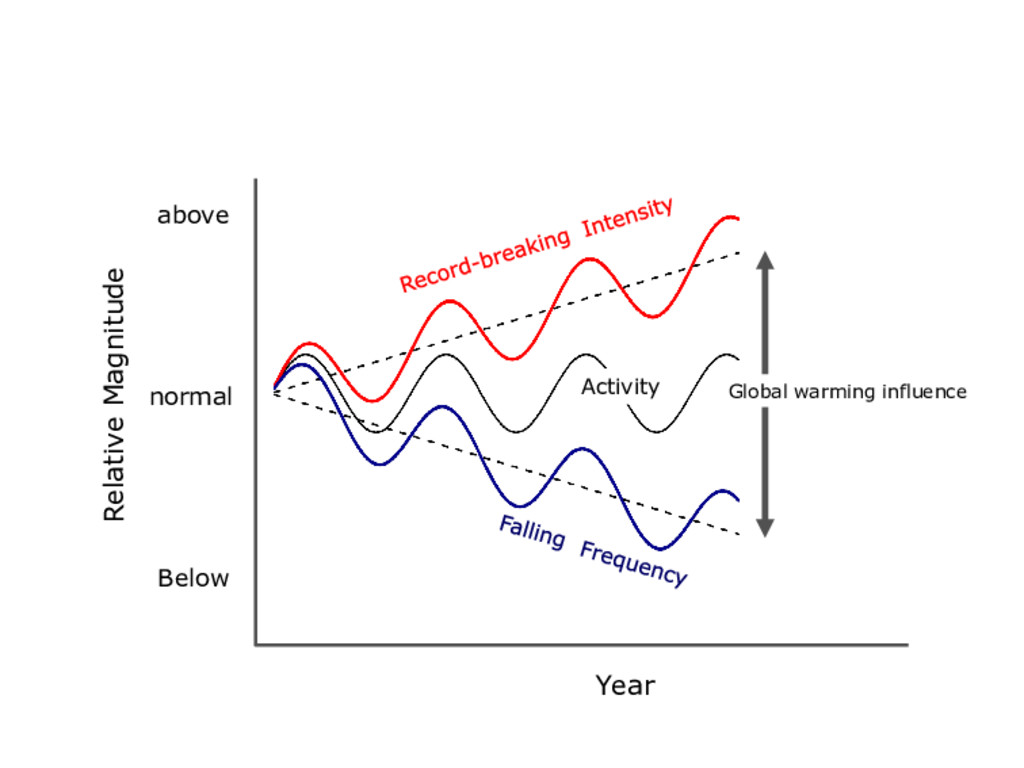
in climate-change studies. How often and how strong are the two canonical components of storminess. Analyzing frequency independently from intensity illuminates a broad theoretical space of storm climate variability. With typhoons in the Pacific and tornadoes in the U.S., the finger print of climate change appears to be fewer, but stronger.