B. Elsner (@JBElsner) Department of Geography, Florida State University Tallahassee, FL November 11, 2016 28th AMS Conference on Severe Local Storms Help: Thomas Jagger, Tyler Fricker, Victor Mesev Financial Support: RPI2.0 (Mark Guishard, John Wardman)
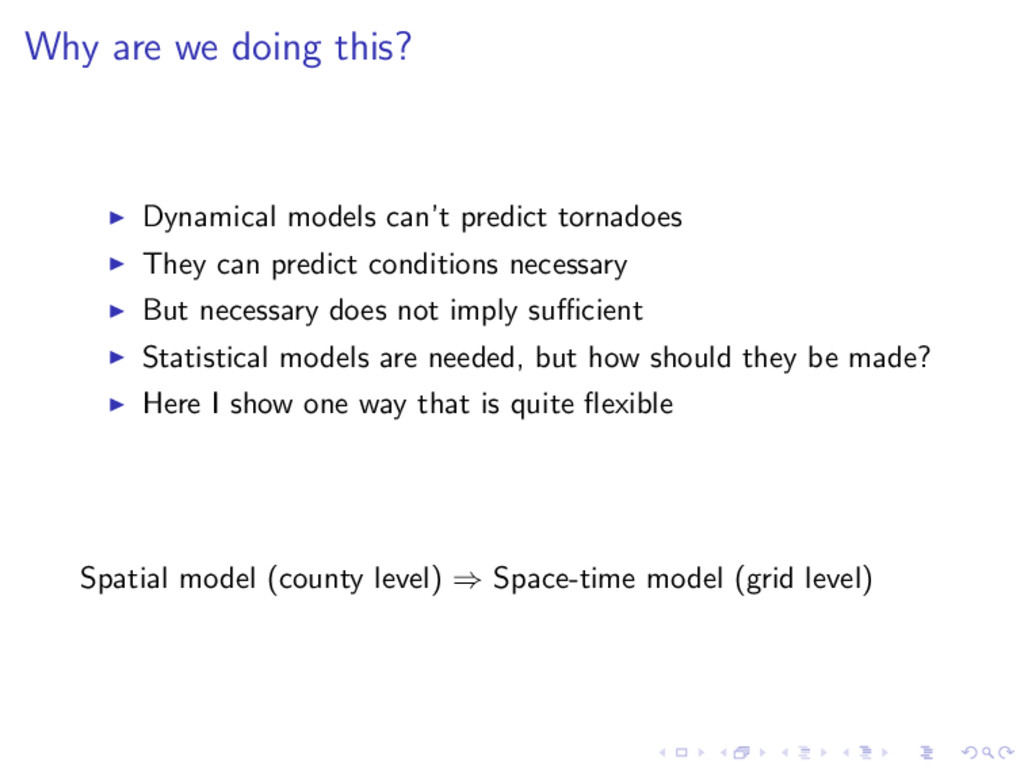
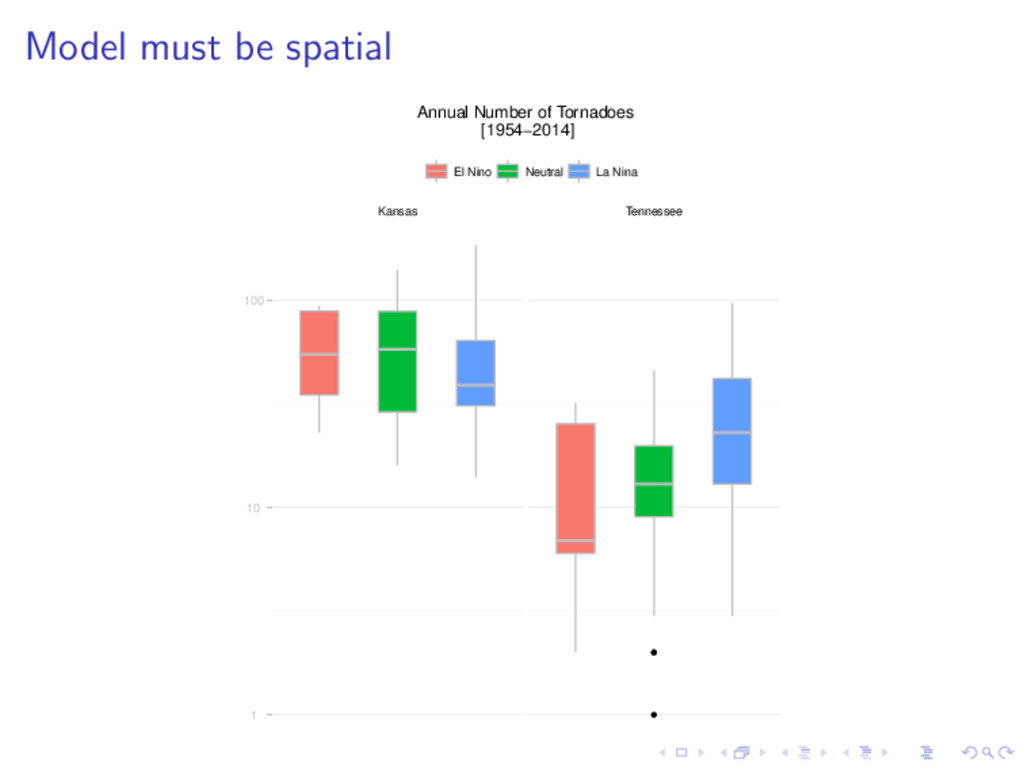
They can predict conditions necessary But necessary does not imply sufficient Statistical models are needed, but how should they be made? Here I show one way that is quite flexible Spatial model (county level) ⇒ Space-time model (grid level)
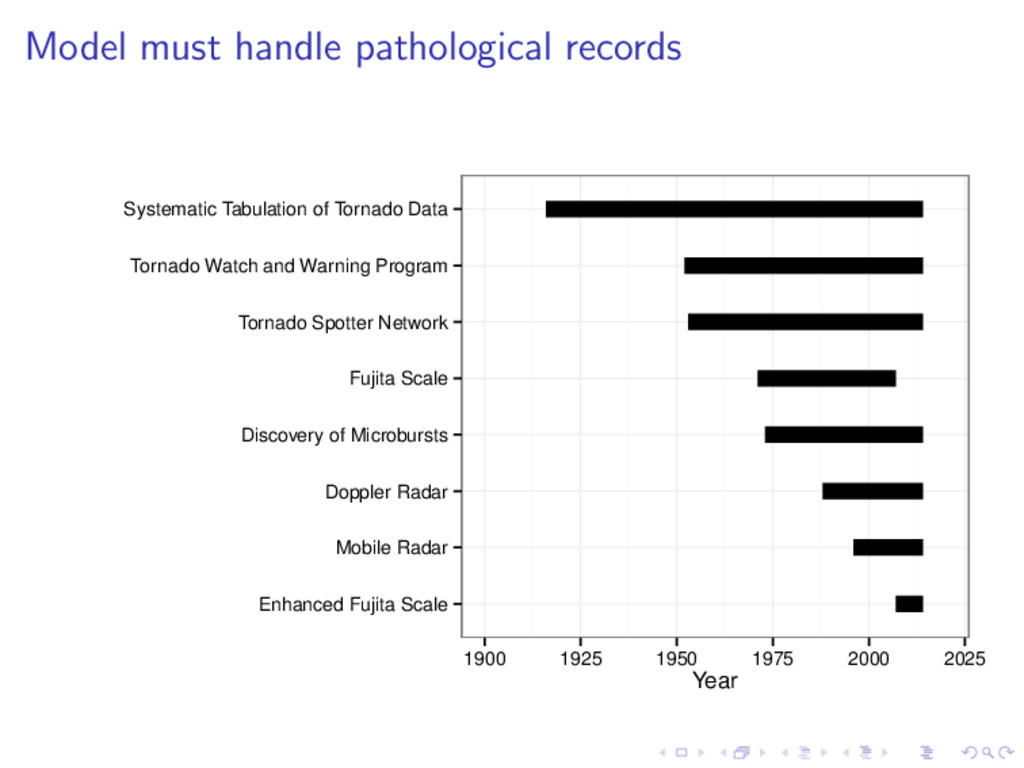
Doppler Radar Discovery of Microbursts Fujita Scale Tornado Spotter Network Tornado Watch and Warning Program Systematic Tabulation of Tornado Data 1900 1925 1950 1975 2000 2025 Year
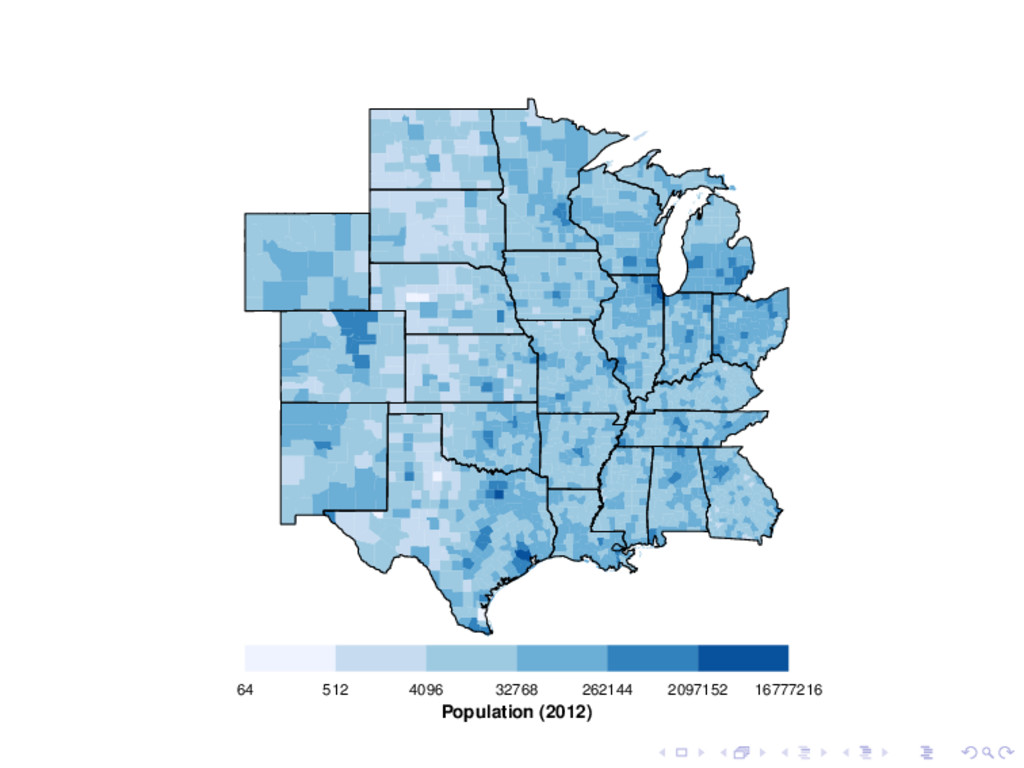
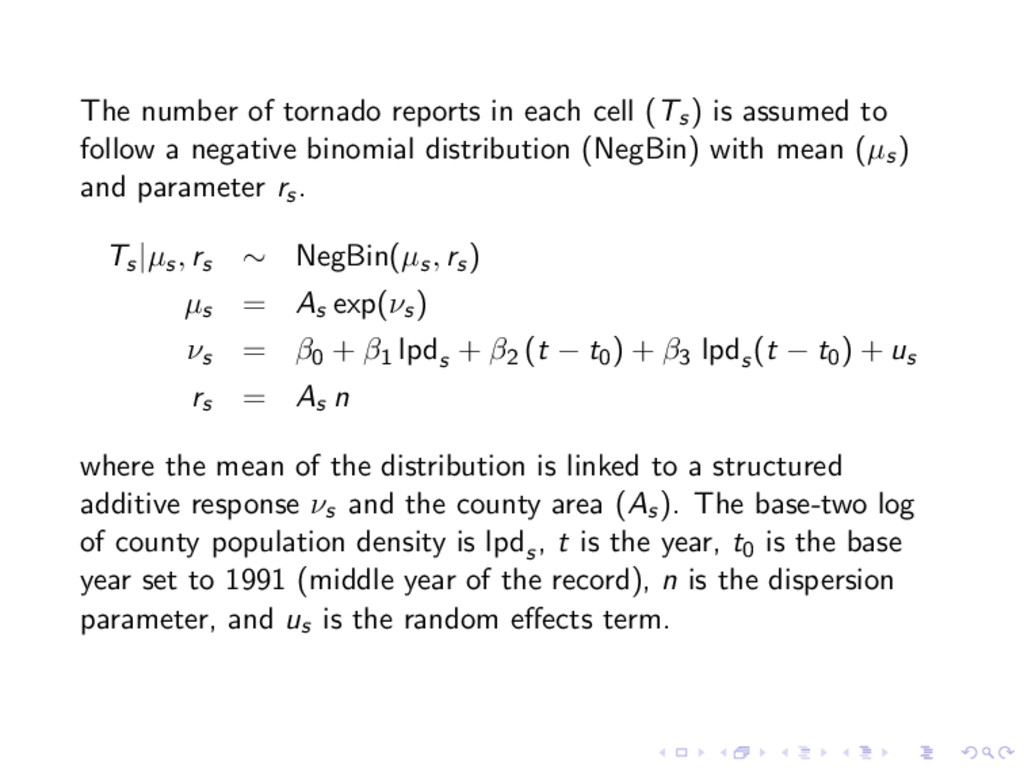
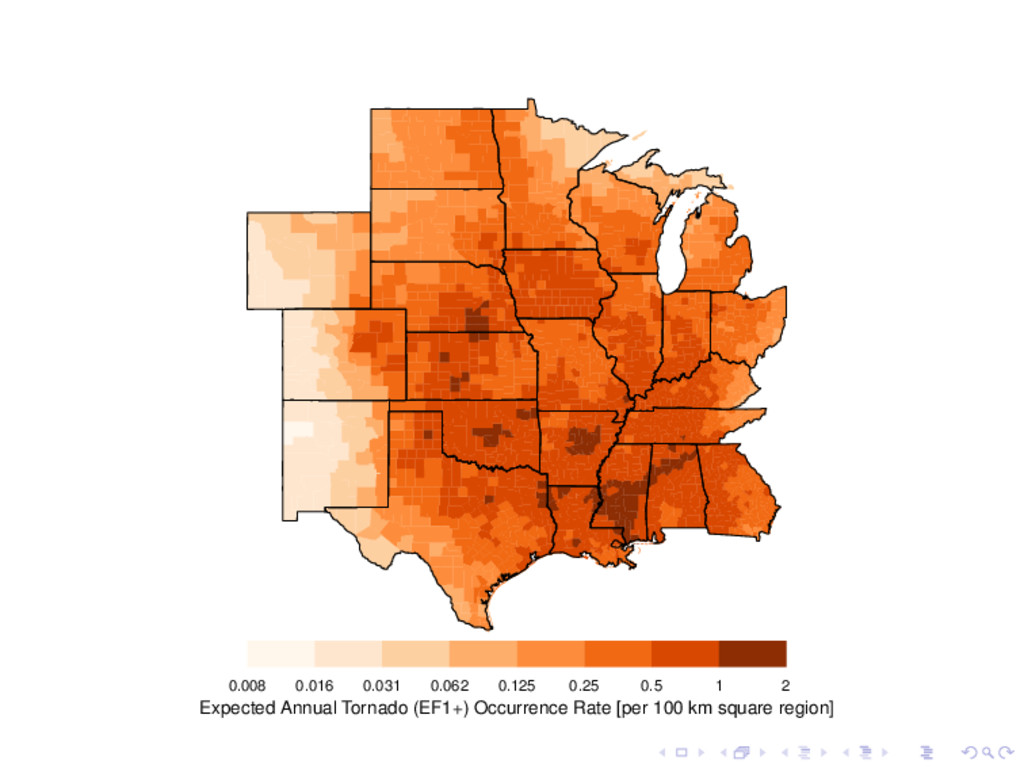
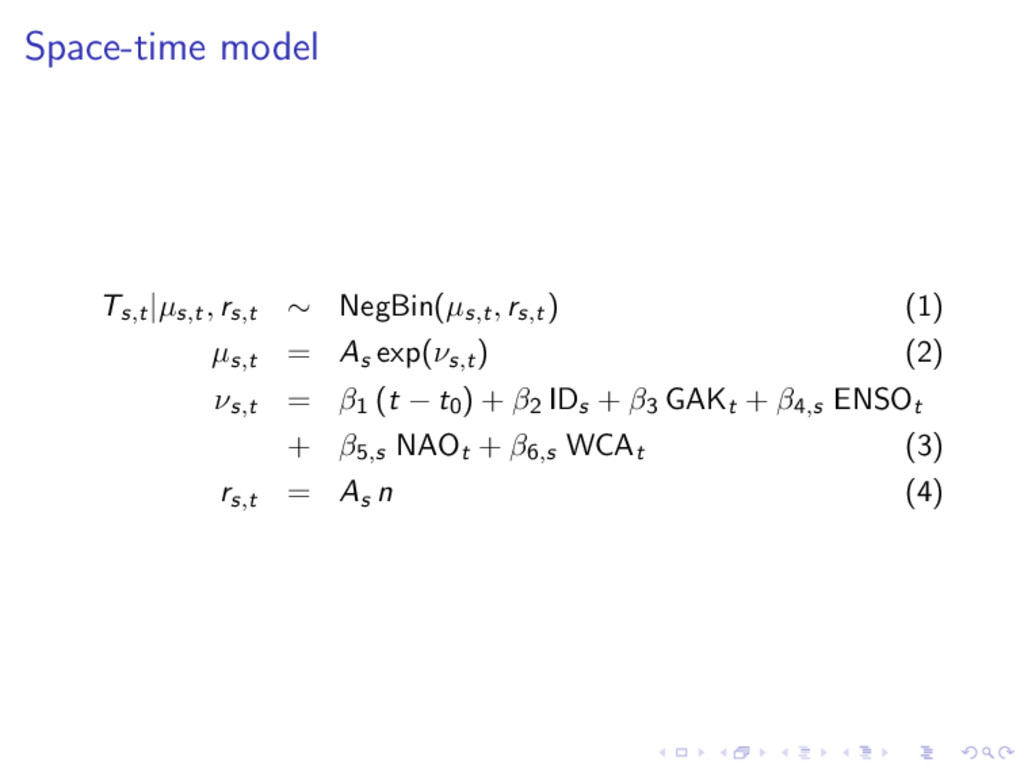
assumed to follow a negative binomial distribution (NegBin) with mean (µs) and parameter rs. Ts|µs, rs ∼ NegBin(µs, rs) µs = As exp(νs) νs = β0 + β1 lpds + β2 (t − t0) + β3 lpds (t − t0) + us rs = As n where the mean of the distribution is linked to a structured additive response νs and the county area (As). The base-two log of county population density is lpds , t is the year, t0 is the base year set to 1991 (middle year of the record), n is the dispersion parameter, and us is the random effects term.
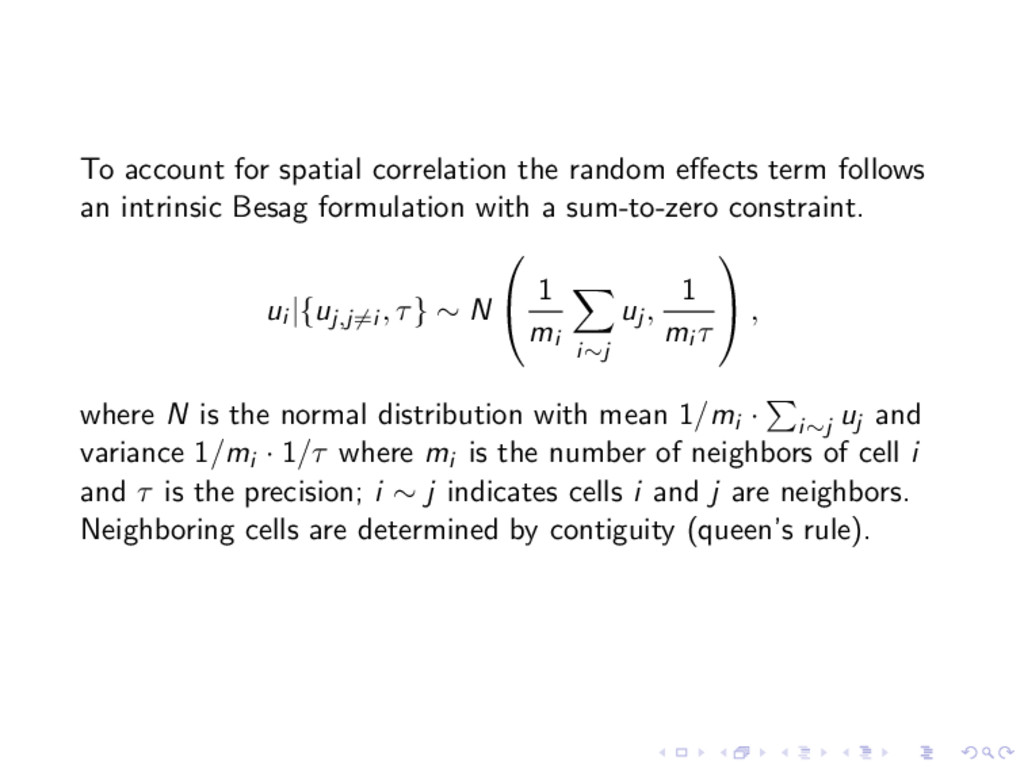
an intrinsic Besag formulation with a sum-to-zero constraint. ui |{uj,j=i , τ} ∼ N 1 mi i∼j uj , 1 mi τ , where N is the normal distribution with mean 1/mi · i∼j uj and variance 1/mi · 1/τ where mi is the number of neighbors of cell i and τ is the precision; i ∼ j indicates cells i and j are neighbors. Neighboring cells are determined by contiguity (queen’s rule).
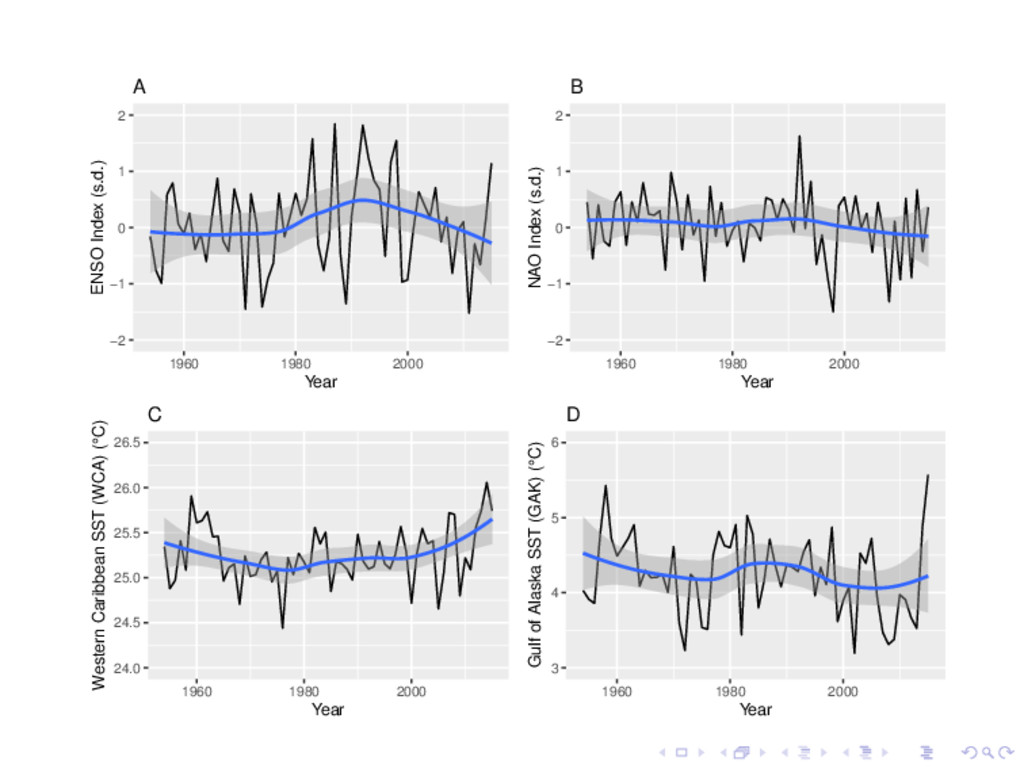
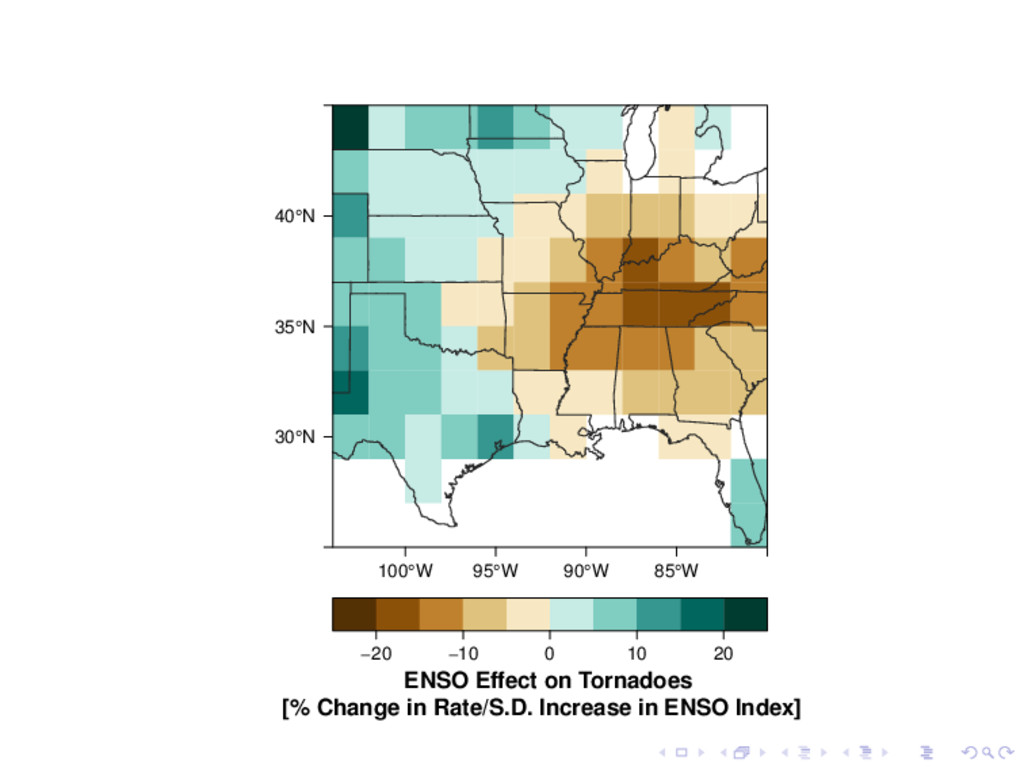
Index (s.d.) A −2 −1 0 1 2 1960 1980 2000 Year NAO Index (s.d.) B 24.0 24.5 25.0 25.5 26.0 26.5 1960 1980 2000 Year Western Caribbean SST (WCA) (°C) C 3 4 5 6 1960 1980 2000 Year Gulf of Alaska SST (GAK) (°C) D
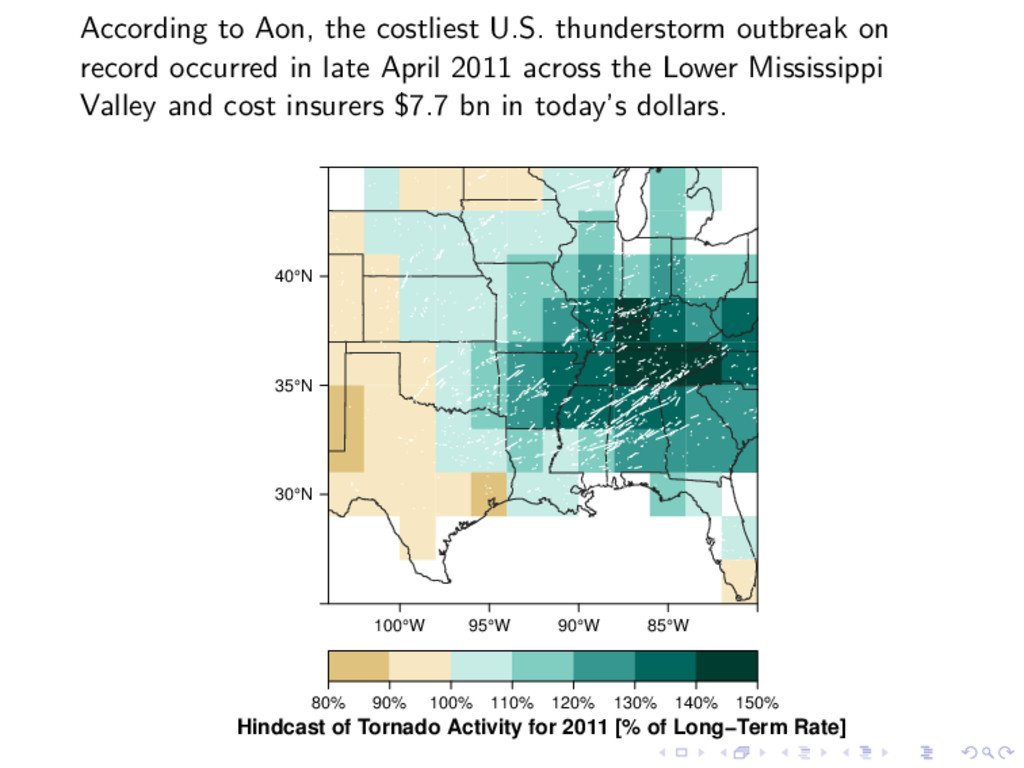
occurred in late April 2011 across the Lower Mississippi Valley and cost insurers $7.7 bn in today’s dollars. Hindcast of Tornado Activity for 2011 [% of Long−Term Rate] 30°N 35°N 40°N 100°W 95°W 90°W 85°W 80% 90% 100% 110% 120% 130% 140% 150%
spatial statistical models. Models are built from historical tornado observations. Modern fitting techniques handle clustered and pathological records. Models produce long- and short-term views of regional tornado risk. Code for both views are available at rpubs.com/jelsner The most important factor in the short-term view is ENSO. New work will attempt to predict the risk of insured loss & casualties given the climate variables.
![Significance Level of ENSO Effect [s.d.] 30°N 35°N 40°N 100°W](https://files.speakerdeck.com/presentations/bf8e6bd6c73c4eac8c7fb78f3159977a/slide_21.jpg)