Upgrade to Pro — share decks privately, control downloads, hide ads and more …

The quantitative state of the Open Cloud (2015 edition)

The quantitative state of the Open Cloud (2015 edition)

Slides for my talk at the Open Cloud Day, OSCON, The quantitative state of the Open Cloud (2015 edition), Portland, July 21th 2015.

Understanding the inner life of free / open source software projects is of fundamental importance to developers, users, and decision makers. This talk will help to understand what’s happening behind the curtain in the most relevant open cloud platforms, by analyzing the rich data obtained from their developing repositories.

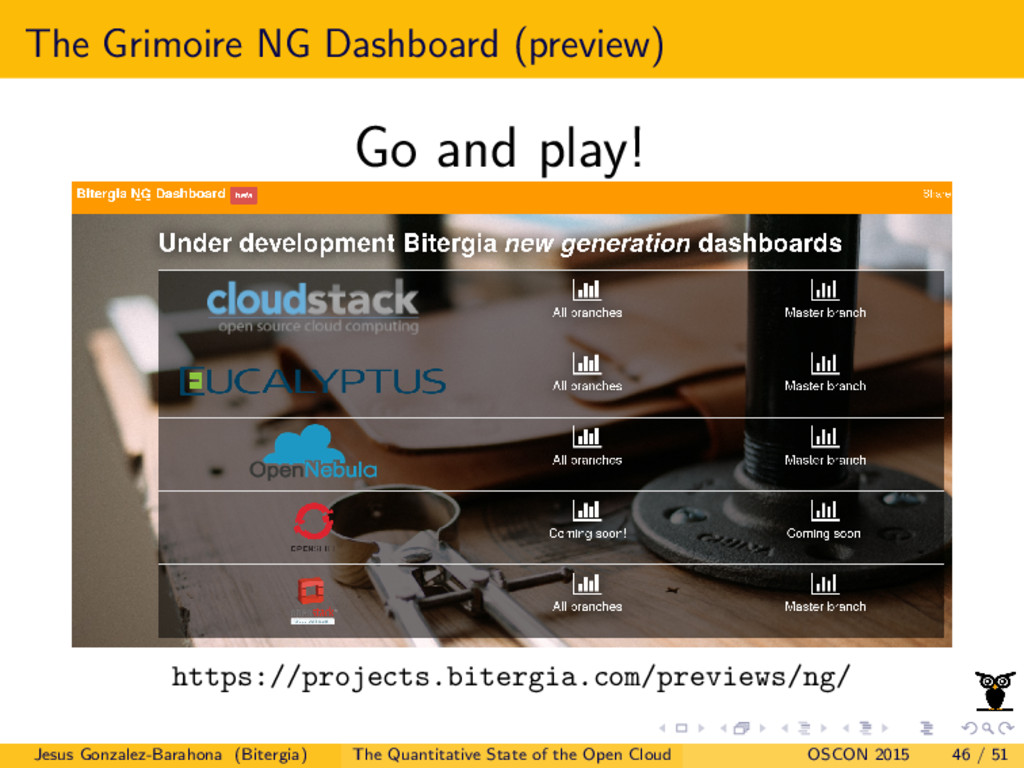
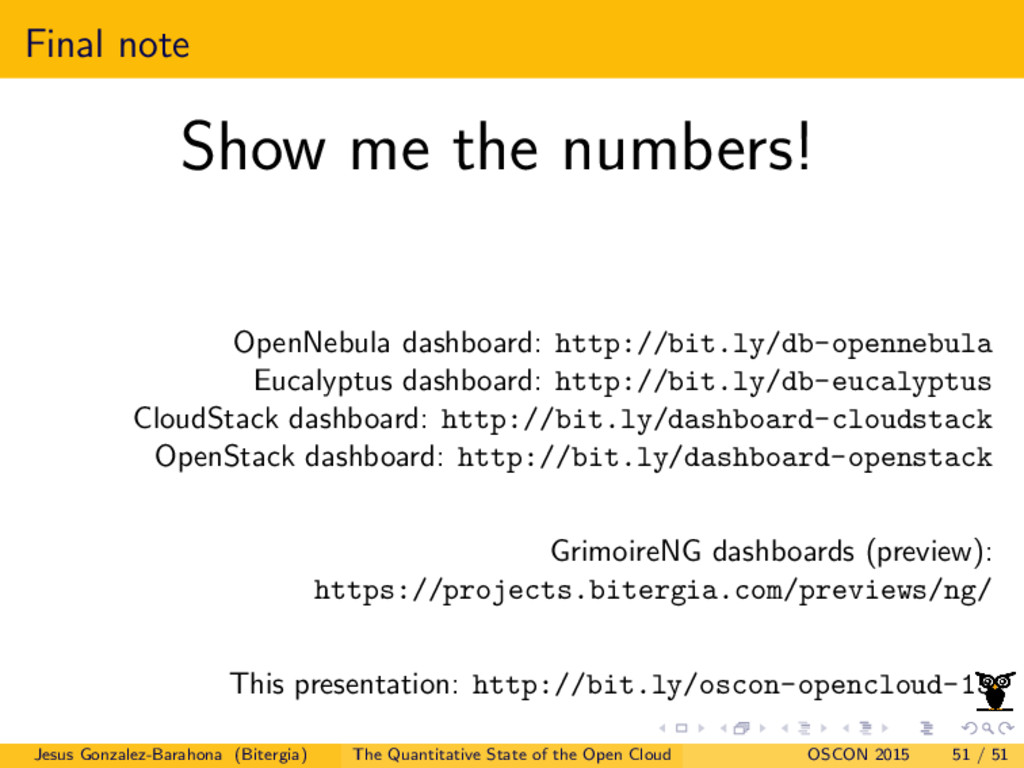
The dashboards for the projects presented at the talk are:

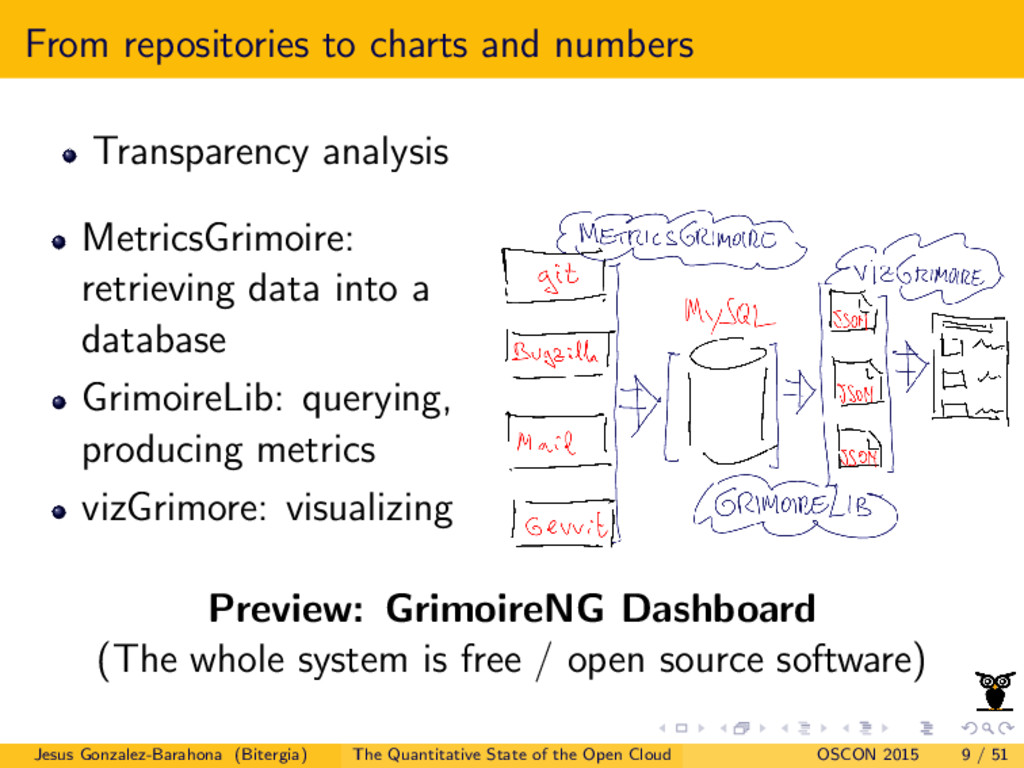
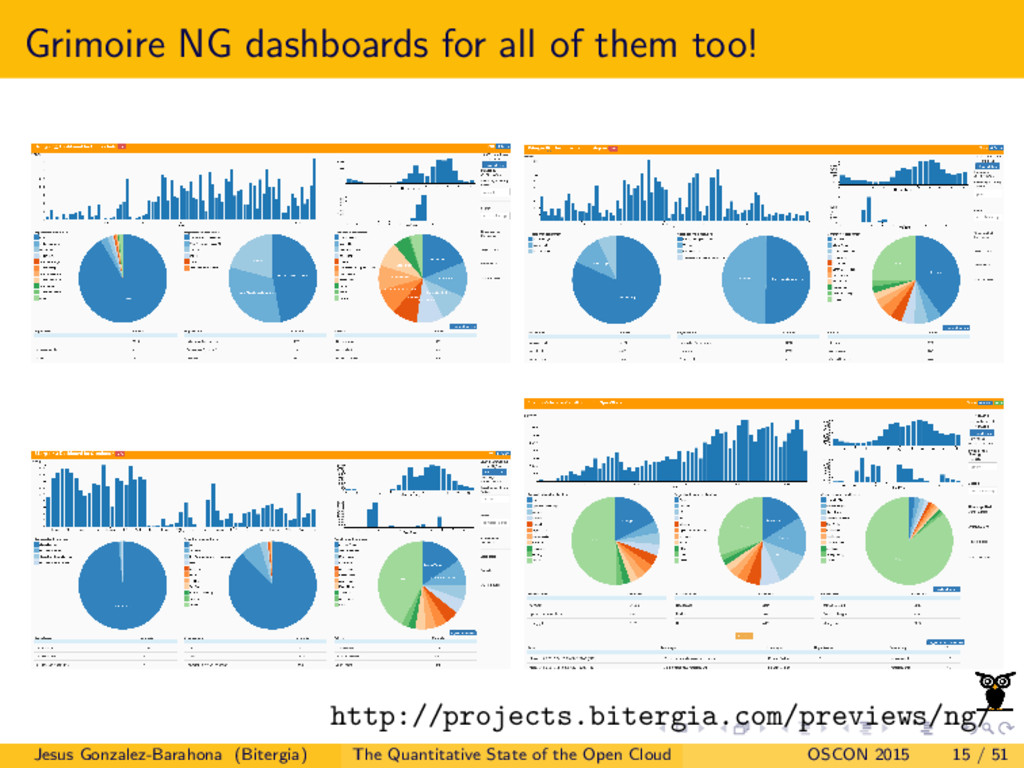
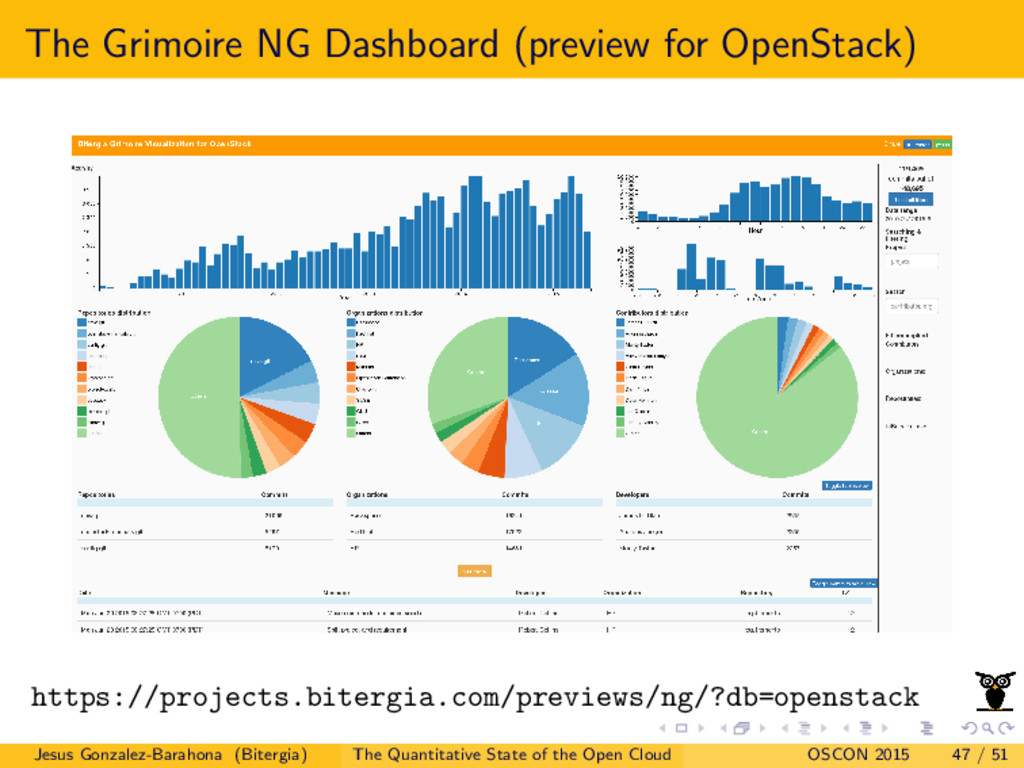
GrimoireNG dashboard for all the projects (preview)
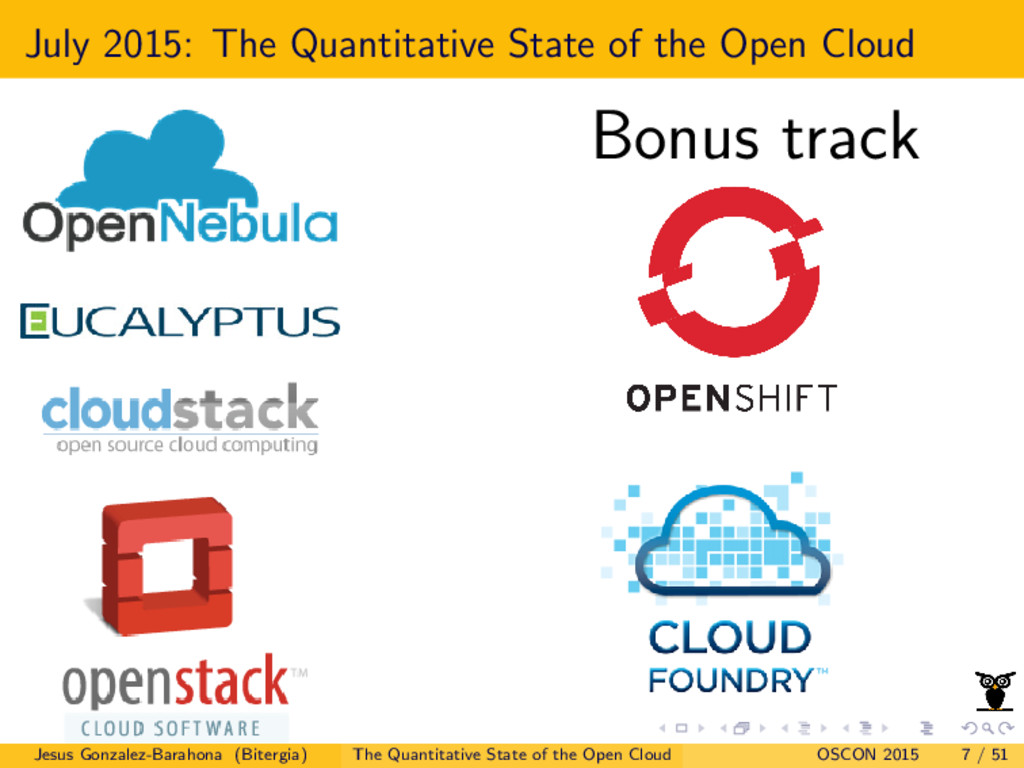
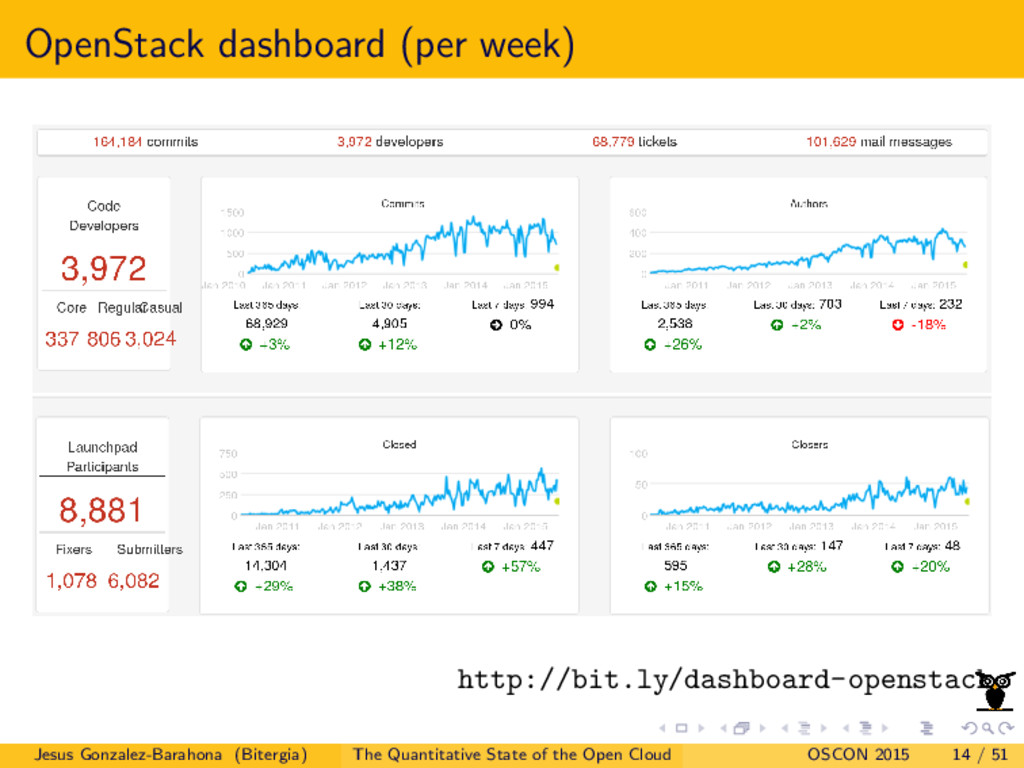
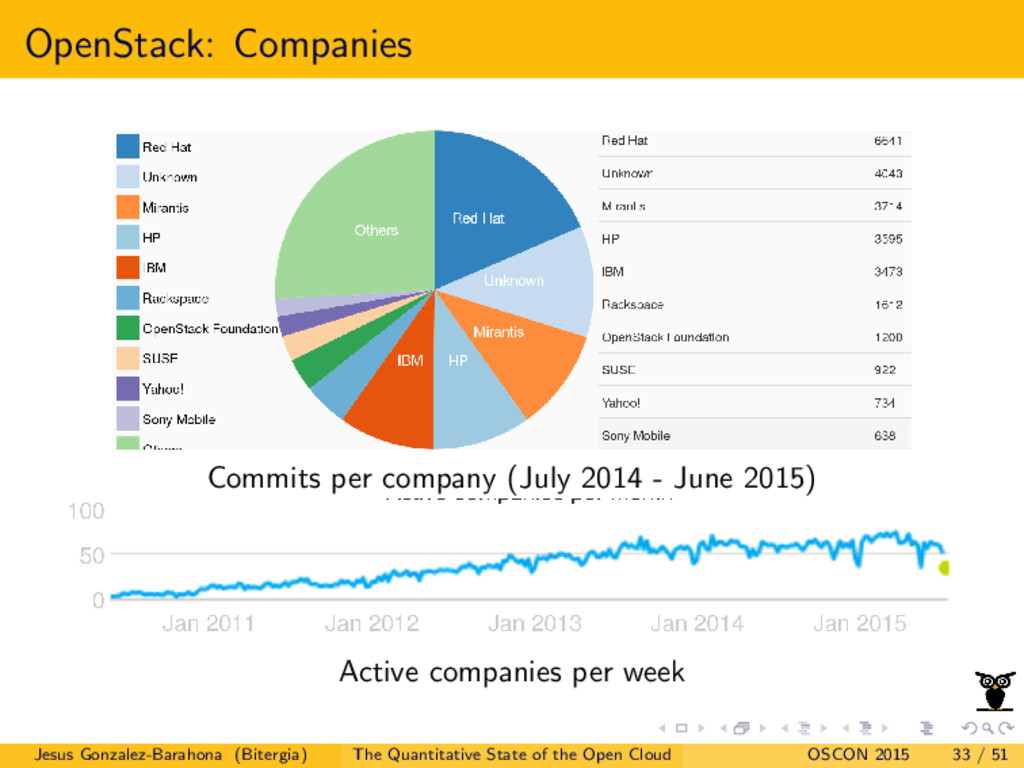
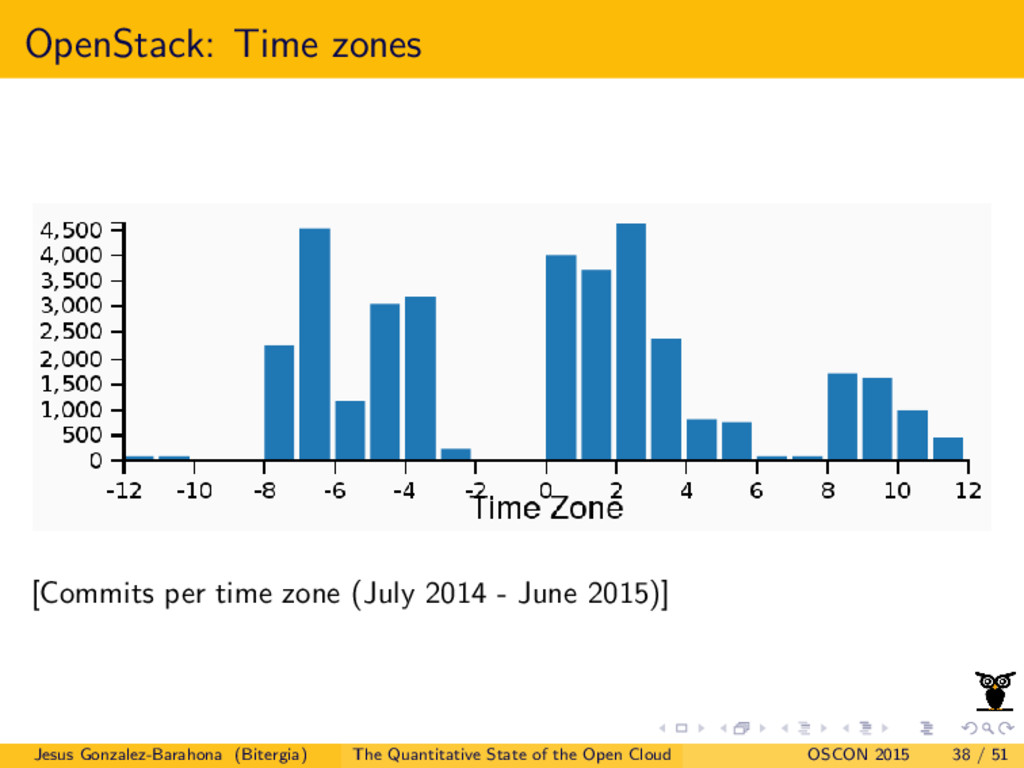
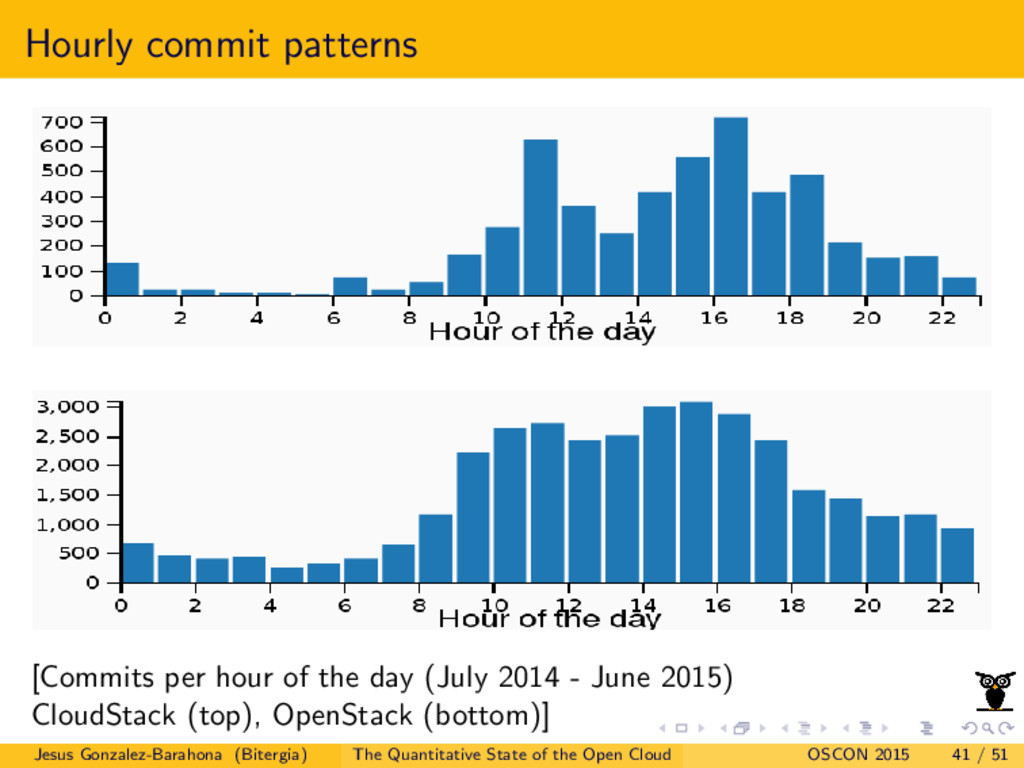
OpenStack Grimoire dashboard
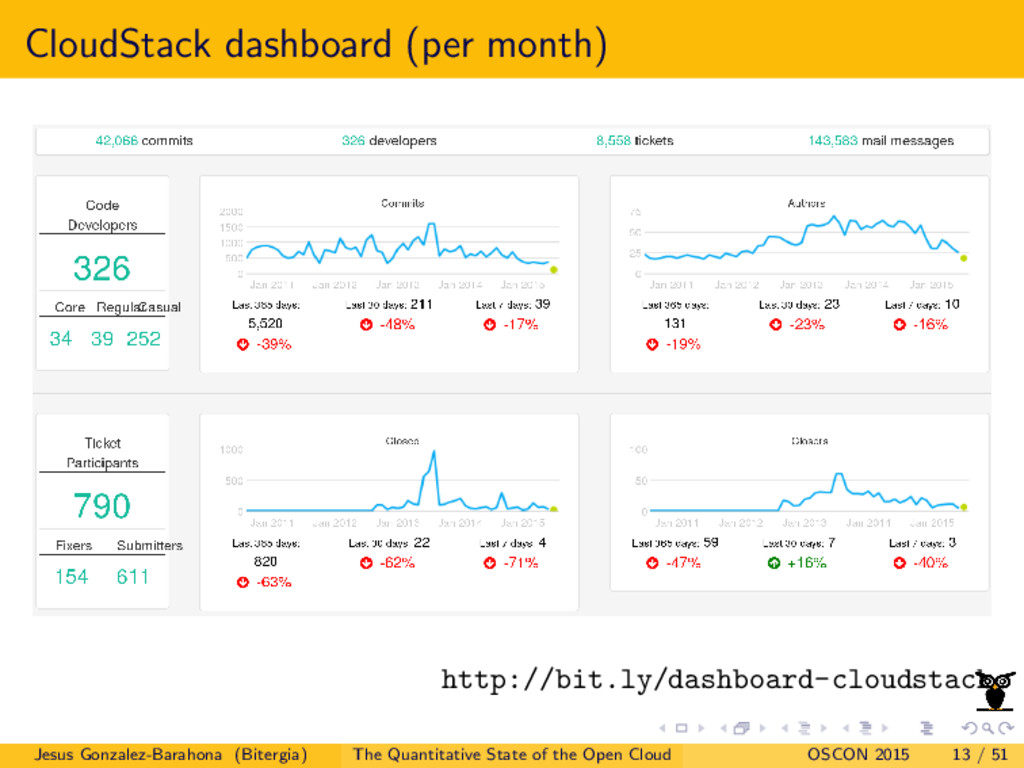
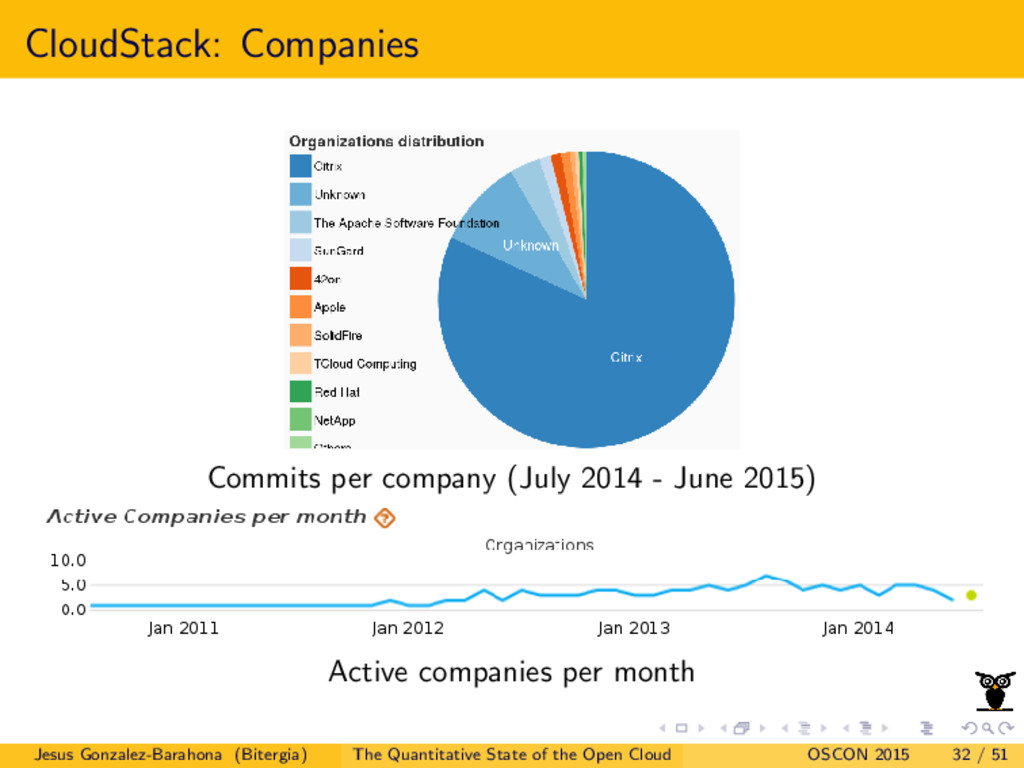
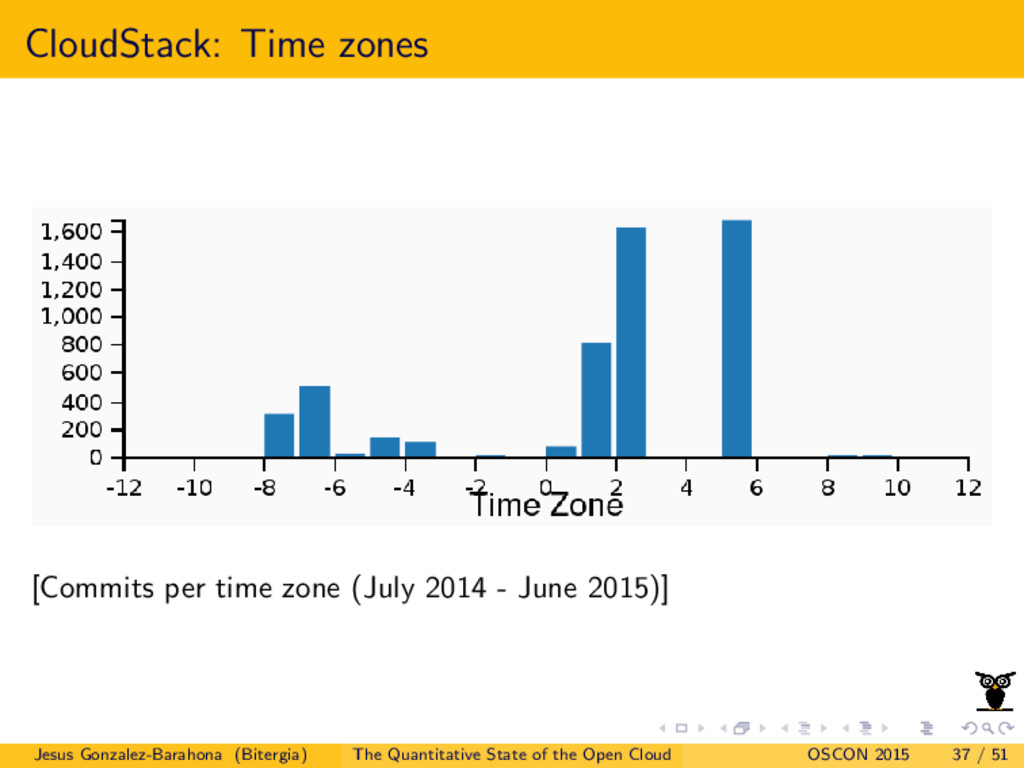
CloudStack Grimoire dashboard
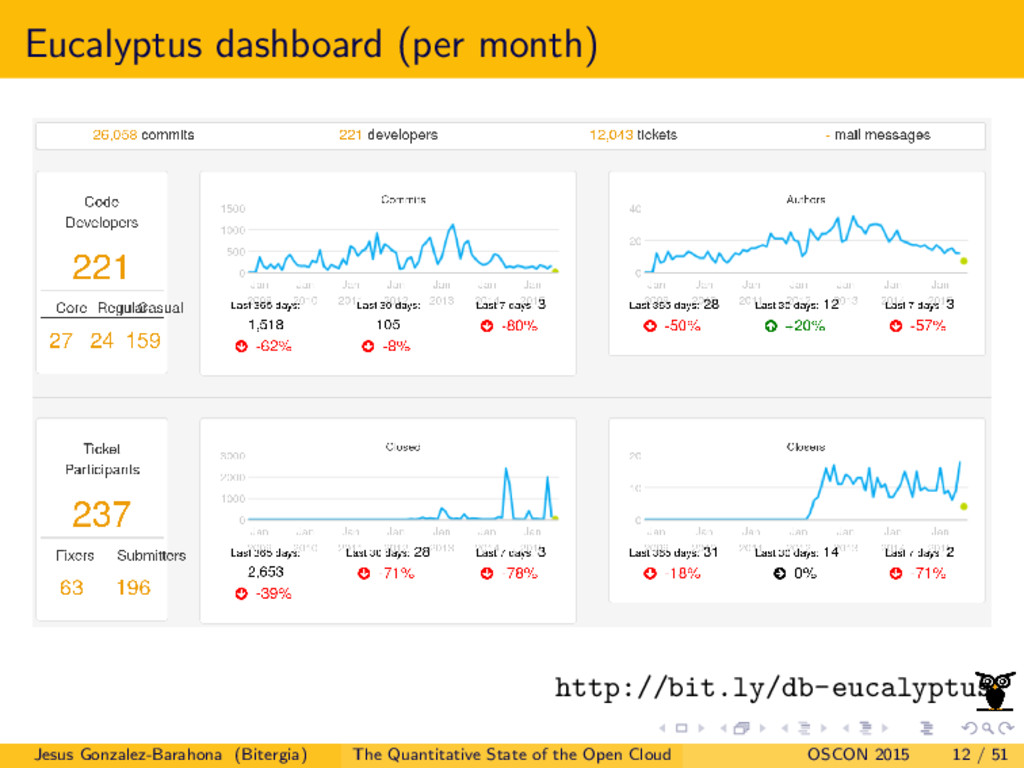
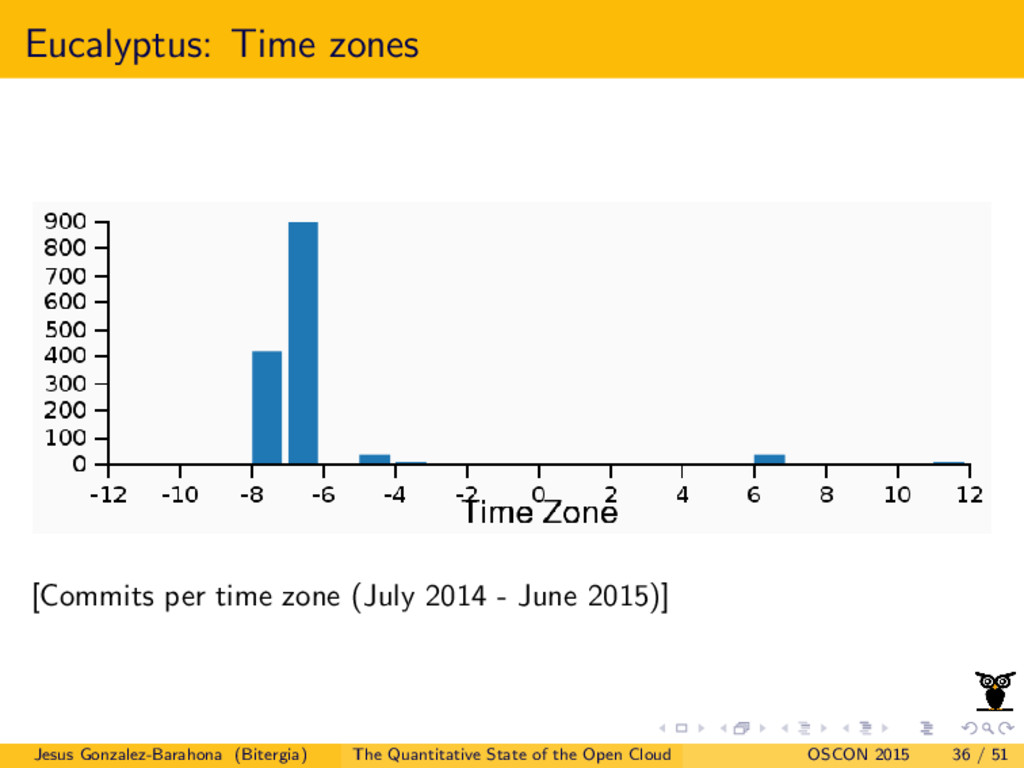
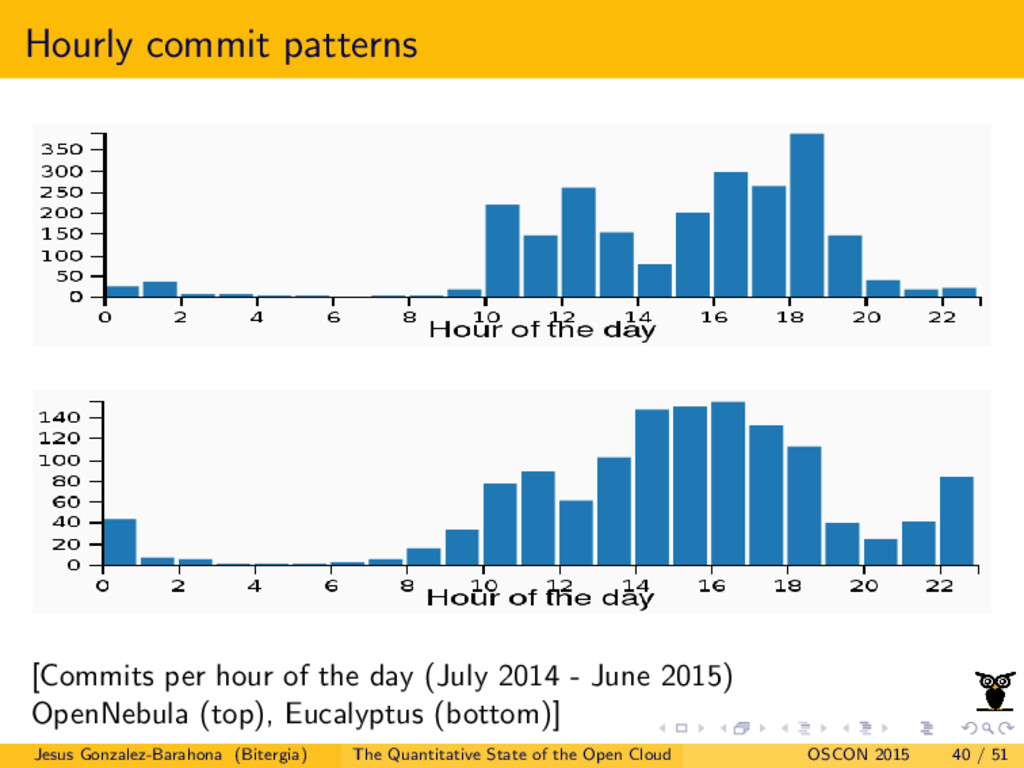
Eucalyptus Grimoire dashboard
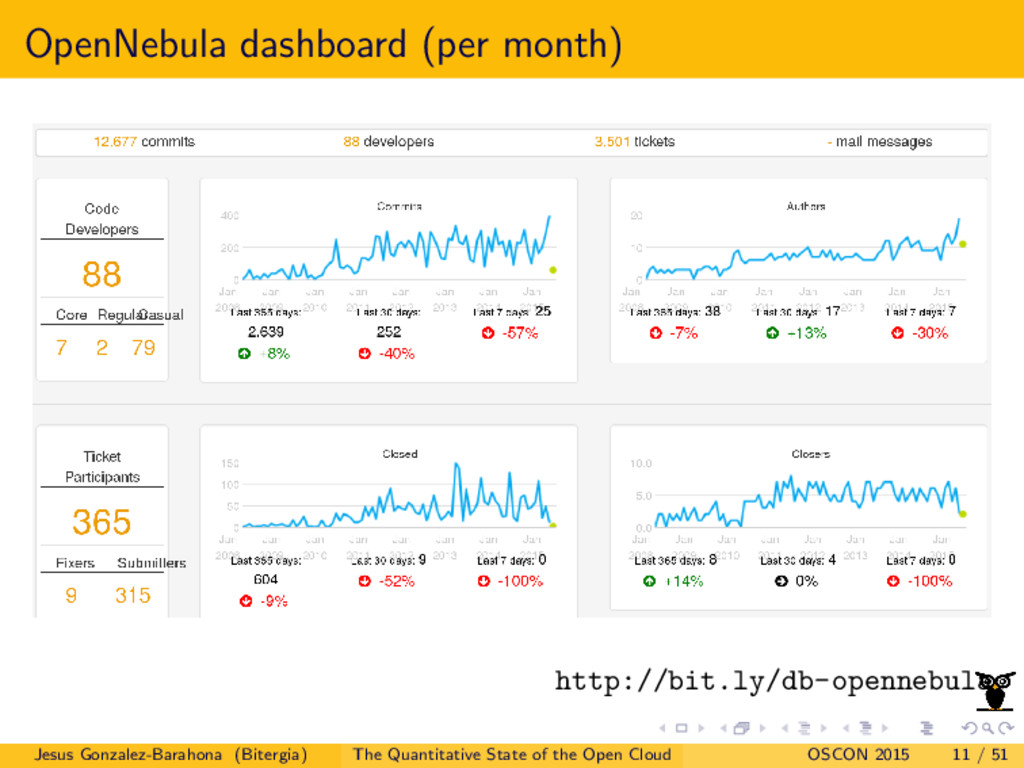
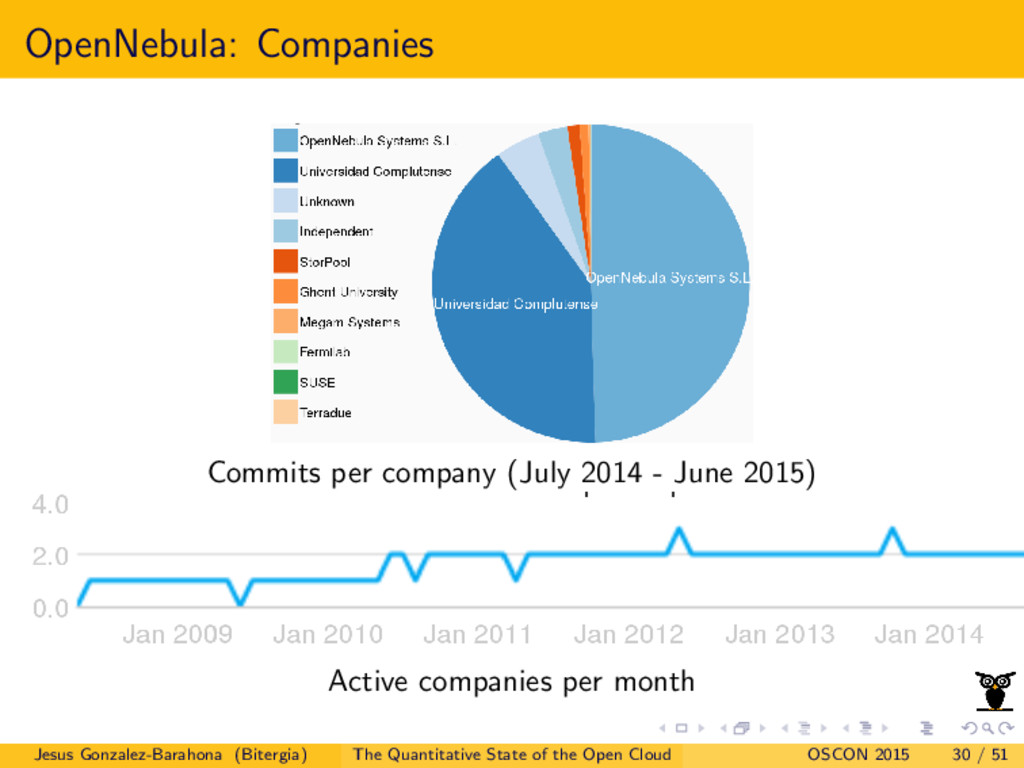
OpenNebula Grimoire dashboard

More Decks by Jesus M. Gonzalez-Barahona

Other Decks in Technology

Transcript

  1. The quantitative state of the Open Cloud (2015 edition) Jesus

    M. Gonzalez-Barahona [email protected] @jgbarah Bitergia / LibreSoft (URJC) http://bit.ly/oscon-opencloud-15 Open Cloud Day, OSCON 2015 Portland, OR (USA), July 21st 2015 Jesus Gonzalez-Barahona (Bitergia) The Quantitative State of the Open Cloud OSCON 2015 1 / 51
  2. c 2012-2015 Bitergia Some rights reserved. This presentation is distributed

    under the “Attribution-ShareAlike 3.0” license, by Creative Commons, available at http://creativecommons.org/licenses/by-sa/3.0/ Jesus Gonzalez-Barahona (Bitergia) The Quantitative State of the Open Cloud OSCON 2015 2 / 51
  3. Structure of the presentation 1 A bit of context 2

    Methodology 3 The projects, in numbers 4 Opening and closing tickets 5 Aging charts 6 Companies 7 Geographical origin 8 Hourly patterns 9 Bonus track 10 The end Jesus Gonzalez-Barahona (Bitergia) The Quantitative State of the Open Cloud OSCON 2015 3 / 51
  4. I am I, and my circumstance Co-founder of Bitergia: The

    software development analytics company Dashboards, reports, consultancy... http://bitergia.com Associate Professor at URJC: Understanding free, open source software development Empirical, data analytics approach http://gsyc.es/~jgb Jesus Gonzalez-Barahona (Bitergia) The Quantitative State of the Open Cloud OSCON 2015 5 / 51
  5. July 2014: The Quantitative State of the Open Cloud http://vimeo.com/105213660

    Jesus Gonzalez-Barahona (Bitergia) The Quantitative State of the Open Cloud OSCON 2015 6 / 51
  6. July 2015: The Quantitative State of the Open Cloud Bonus

    track Jesus Gonzalez-Barahona (Bitergia) The Quantitative State of the Open Cloud OSCON 2015 7 / 51
  7. From repositories to charts and numbers Transparency analysis MetricsGrimoire: retrieving

    data into a database GrimoireLib: querying, producing metrics vizGrimore: visualizing Preview: GrimoireNG Dashboard (The whole system is free / open source software) Jesus Gonzalez-Barahona (Bitergia) The Quantitative State of the Open Cloud OSCON 2015 9 / 51
  8. Facts from software development repositories Focus on how they are

    developed: Activity: how much contributions they get? Processes: how are they performing? Community: who is contributing? We didn’t analyze: Functionality Run-time performance Popularity We produced a dashboard for each of the projects (in fact, three for each of them) Jesus Gonzalez-Barahona (Bitergia) The Quantitative State of the Open Cloud OSCON 2015 10 / 51
  9. Grimoire NG dashboards for all of them too! http://projects.bitergia.com/previews/ng/ Jesus

    Gonzalez-Barahona (Bitergia) The Quantitative State of the Open Cloud OSCON 2015 15 / 51
  10. Transparency analysis Did we have data for all of them?

    Public source code management (git) and issue tracking systems All code seems to land in git at some point OpenStack, CloudStack, Eucalyptus: all tickets seem to be in public issue tracking system OpenNebula: maybe not all tickets in public issue tracking systems Jesus Gonzalez-Barahona (Bitergia) The Quantitative State of the Open Cloud OSCON 2015 16 / 51
  11. Activity, community OpenNebula Eucalyptus CloudStack OpenStack Commits 12,677 26,058 42,066

    164,184 Devels 88 221 326 3,972 Core 7 27 34 337 Tickets 3,501 12,043 8,558 68,779 Fixers 9 63 154 1,078 Submitters 315 196 611 6,082 Jesus Gonzalez-Barahona (Bitergia) The Quantitative State of the Open Cloud OSCON 2015 18 / 51
  12. Activity, community (last months) OpenNebula Eucalyptus CloudStack OpenStack Commits 220

    140 330 2,500 Devels 12 12 35 500 Tickets closed 50 25 40 1,200 Closers 5 10 10 100 For the last months... (all numbers are approximate, per month) Jesus Gonzalez-Barahona (Bitergia) The Quantitative State of the Open Cloud OSCON 2015 19 / 51
  13. OpenNebula: Tickets [Green: tickets opened per month / Blue: tickets

    closed per month] Jesus Gonzalez-Barahona (Bitergia) The Quantitative State of the Open Cloud OSCON 2015 21 / 51
  14. Eucalyptus: Tickets [Green: tickets opened per month / Blue: tickets

    closed per month] Jesus Gonzalez-Barahona (Bitergia) The Quantitative State of the Open Cloud OSCON 2015 22 / 51
  15. CloudStack: Tickets [Green: tickets opened per month / Blue: tickets

    closed per month] Jesus Gonzalez-Barahona (Bitergia) The Quantitative State of the Open Cloud OSCON 2015 23 / 51
  16. OpenStack: Tickets [Green: tickets opened per month / Blue: tickets

    closed per week] Jesus Gonzalez-Barahona (Bitergia) The Quantitative State of the Open Cloud OSCON 2015 24 / 51
  17. The aging chart Find out the aging structure of a

    community. Attracted and retained developers per “generation” (usually, 6-months generations) How much “good old expertise” do you have? How much “new blood” do you have? How are you retaining each generation? http://radar.oreilly.com/2014/10/ measure-your-open-source-communitys-age-to-keep-it-healthy.html Jesus Gonzalez-Barahona (Bitergia) The Quantitative State of the Open Cloud OSCON 2015 26 / 51
  18. OpenNebula: Companies Commits per company (July 2014 - June 2015)

    Active companies per month Jesus Gonzalez-Barahona (Bitergia) The Quantitative State of the Open Cloud OSCON 2015 30 / 51
  19. Eucalyptus: Companies Commits per company (July 2014 - June 2015)

    Active companies per month Jesus Gonzalez-Barahona (Bitergia) The Quantitative State of the Open Cloud OSCON 2015 31 / 51
  20. CloudStack: Companies Commits per company (July 2014 - June 2015)

    Active companies per month Jesus Gonzalez-Barahona (Bitergia) The Quantitative State of the Open Cloud OSCON 2015 32 / 51
  21. OpenStack: Companies Commits per company (July 2014 - June 2015)

    Active companies per week Jesus Gonzalez-Barahona (Bitergia) The Quantitative State of the Open Cloud OSCON 2015 33 / 51
  22. OpenNebula: Time zones [Commits per time zone (July 2014 -

    June 2015)] Jesus Gonzalez-Barahona (Bitergia) The Quantitative State of the Open Cloud OSCON 2015 35 / 51
  23. Eucalyptus: Time zones [Commits per time zone (July 2014 -

    June 2015)] Jesus Gonzalez-Barahona (Bitergia) The Quantitative State of the Open Cloud OSCON 2015 36 / 51
  24. CloudStack: Time zones [Commits per time zone (July 2014 -

    June 2015)] Jesus Gonzalez-Barahona (Bitergia) The Quantitative State of the Open Cloud OSCON 2015 37 / 51
  25. OpenStack: Time zones [Commits per time zone (July 2014 -

    June 2015)] Jesus Gonzalez-Barahona (Bitergia) The Quantitative State of the Open Cloud OSCON 2015 38 / 51
  26. Hourly commit patterns [Commits per hour of the day (July

    2014 - June 2015) OpenNebula (top), Eucalyptus (bottom)] Jesus Gonzalez-Barahona (Bitergia) The Quantitative State of the Open Cloud OSCON 2015 40 / 51
  27. Hourly commit patterns [Commits per hour of the day (July

    2014 - June 2015) CloudStack (top), OpenStack (bottom)] Jesus Gonzalez-Barahona (Bitergia) The Quantitative State of the Open Cloud OSCON 2015 41 / 51
  28. Measuring diversity: Apache Pony Factor In words of Daniel Gruno:

    We [the ASF] created a term we have coined “Pony Factor” (because ASF is full of ponies, or people who think they are ponies). Pony Factor (PF) shows the diversity of a project in terms of the division of labor among committers in a project. Pony Factor is determined as: “The lowest number of committers whose total contribution constitutes the majority of the codebase” https://ke4qqq.wordpress.com/2015/02/08/pony-factor-math/ Jesus Gonzalez-Barahona (Bitergia) The Quantitative State of the Open Cloud OSCON 2015 43 / 51
  29. Measuring diversity: Bitergia Elephant Factor Projects can benefit from powerful

    collaborations from companies (elephants). The elephant factor shows the diversity of a project in terms of the division of labor among companies (by mean of developers affiliated with them). Elephant factor is determined as: “The lowest number of companies whose total contribution (in commits by their employees) constitutes the majority of the commits” Jesus Gonzalez-Barahona (Bitergia) The Quantitative State of the Open Cloud OSCON 2015 44 / 51
  30. Measuring diversity: some projects Pony Factor Elephant Factor Commits (excl

    bots) OpenNebula 4 1 12K Eucalyptus 5 1 25K CloudStack 14 1 42K OpenStack >100 6 126K CloudFoundry 41 1 60K OpenShift 10 1 15K Docker 15 1 18K Kubernetes 12 1 7K Jesus Gonzalez-Barahona (Bitergia) The Quantitative State of the Open Cloud OSCON 2015 45 / 51
  31. The Grimoire NG Dashboard (preview) Go and play! https://projects.bitergia.com/previews/ng/ Jesus

    Gonzalez-Barahona (Bitergia) The Quantitative State of the Open Cloud OSCON 2015 46 / 51
  32. Final considerations There are huge differences in most of the

    metrics But we cannot define good or bad: that depends on your target Look at the details... ...and draw your own conclusions The bottom line: the Open Cloud is really transparent you can drill down to any level of detail Jesus Gonzalez-Barahona (Bitergia) The Quantitative State of the Open Cloud OSCON 2015 49 / 51
  33. Disclaimer and transparency package OpenStack Foundation and Citrix are Bitergia’s

    customers They fund the OpenStack and the CloudStack dashboards All the data has been checked, but could have some errors JSON files with the data used in this presentation are available from the corresponding dashboards. Jesus Gonzalez-Barahona (Bitergia) The Quantitative State of the Open Cloud OSCON 2015 50 / 51
  34. Final note Show me the numbers! OpenNebula dashboard: http://bit.ly/db-opennebula Eucalyptus

    dashboard: http://bit.ly/db-eucalyptus CloudStack dashboard: http://bit.ly/dashboard-cloudstack OpenStack dashboard: http://bit.ly/dashboard-openstack GrimoireNG dashboards (preview): https://projects.bitergia.com/previews/ng/ This presentation: http://bit.ly/oscon-opencloud-15 Jesus Gonzalez-Barahona (Bitergia) The Quantitative State of the Open Cloud OSCON 2015 51 / 51