Bell, Roy Østensen, Agnes Bischoff-Kim, Sean Moorehead, Sandra Greiss, Boris Gänsicke, Danny Steeghs, Mike Montgomery, D. E. Winget, James Dalessio, Judi Provencal, Barbara Castanheira!
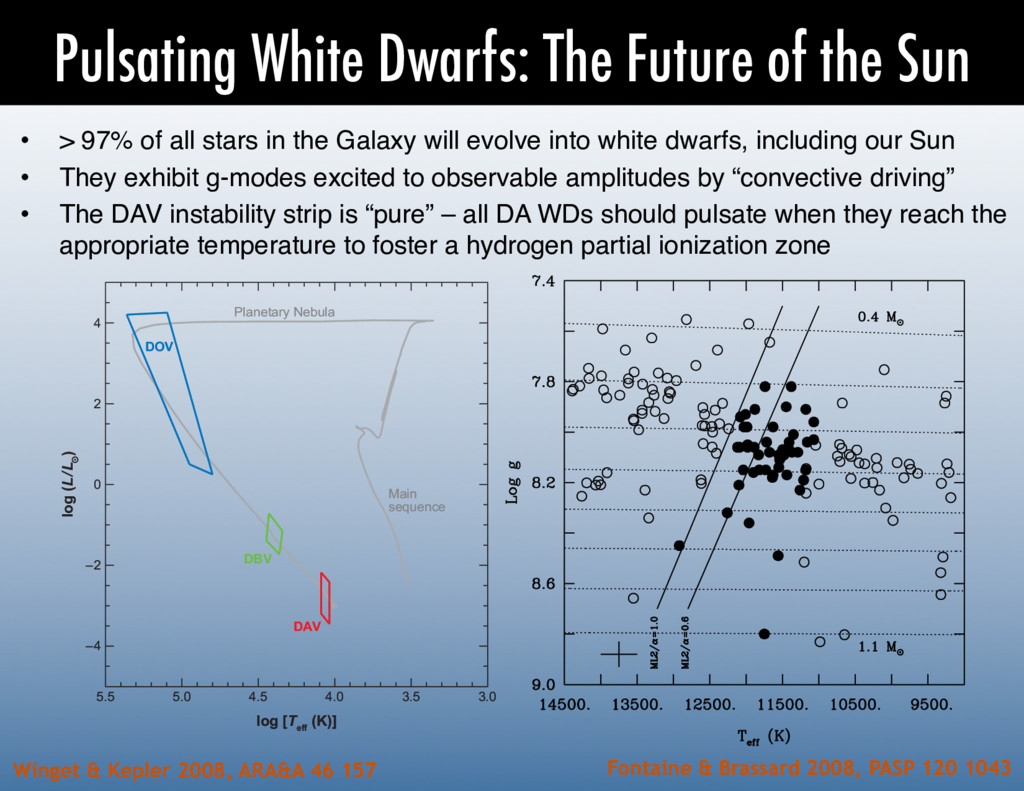
97% of all stars in the Galaxy will evolve into white dwarfs, including our Sun! • They exhibit g-modes excited to observable amplitudes by “convective driving”! • The DAV instability strip is “pure” – all DA WDs should pulsate when they reach the appropriate temperature to foster a hydrogen partial ionization zone! Fontaine & Brassard 2008, PASP 120 1043 (1 Th cu th sta tio by to pe th of D pe in sh sy a pa br re th FIG. 9.—Instability domain in the log g À T diagram for the ZZ Ceti stars. 1054 FONTAINE & BRASSARD 82; Winget et al. 1982a). Theorists were finally able to find in their models the association of excitation by the zone of partial H ionization discovered by McGraw. The demonstration of driving from the H-partial-ionization zone led Winget (1981) and nget et al. (1982a) to investigate models of DB white dwarf stars for possible instabilities ing to the surface He partial ionization at a correspondingly higher temperature. They found tabilities in their models and predicted pulsations in DB white dwarf stars near the He I opacity ximum associated with the onset of significant partial ionization. Observations soon caught up. A systematic survey of the DB white dwarf stars demonstrated t the brightest DB with the broadest He I lines, GD 358, did indeed pulsate in nonradial modes—remarkably similar to the large-amplitude DAV pulsators (Winget et al. 1982b). The observed pulsating white dwarf stars lie in three strips in the H-R diagram, as indicated Figure 3. The pulsating pre-white dwarf PG 1159 stars, the DOVs, around 75,000 K to 0,000 K have the highest number of detected modes. The first class of pulsating stars to be 5.5 5.0 4.5 Planetary Nebula Main sequence DOV DBV DAV 4.0 3.5 3.0 log [T eff (K)] 4 2 0 –2 –4 log (L/L ) ure 3 3-Gyr isochrone with z = 0.019 from Marigo et al. (2007), on which we have drawn the observed ations of the instability strips, following the nonadiabatic calculations of C´ orsico, Althaus & Miller Winget & Kepler 2008, ARA&A 46 157
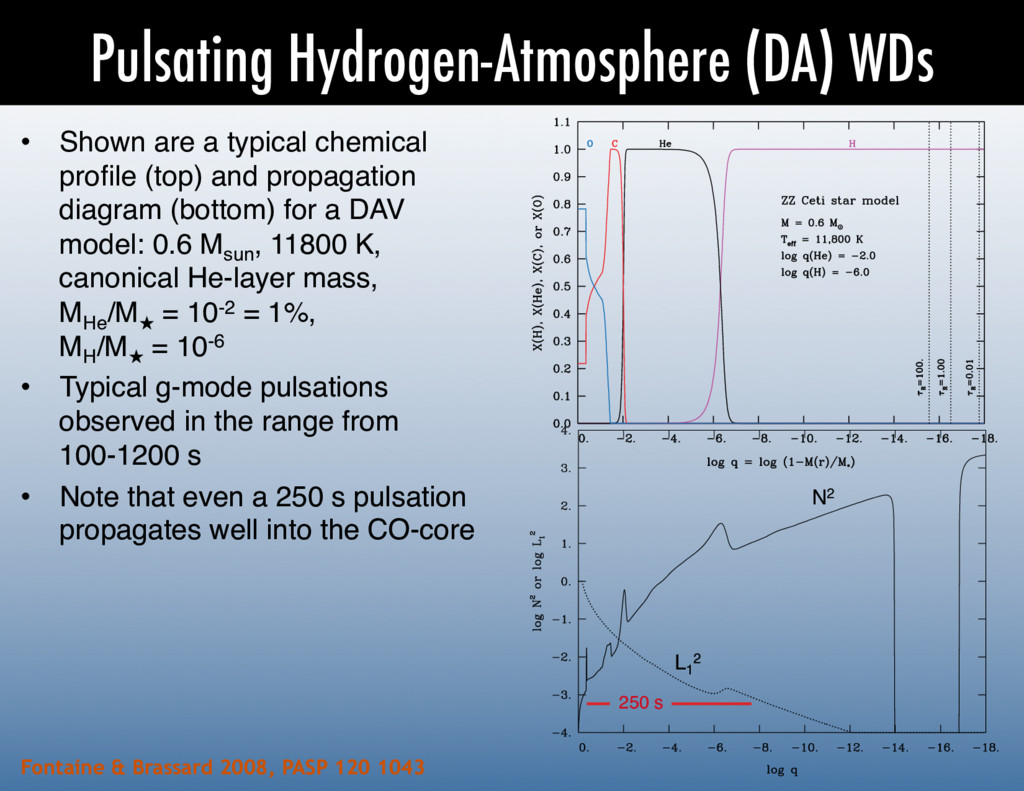
profile (top) and propagation diagram (bottom) for a DAV model: 0.6 Msun , 11800 K, canonical He-layer mass, MHe /M★ = 10-2 = 1%, MH /M★ = 10-6! • Typical g-mode pulsations observed in the range from 100-1200 s! • Note that even a 250 s pulsation propagates well into the CO-core! Fontaine & Brassard 2008, PASP 120 1043 the g-modes observed in pulsating white dwarfs are relatively short ought to be considered a good thing. This is because a large number of pulsation cycles can be covered in a single night of observations and, as a consequence, it is easier to assess the multiperiodic character of a given light curve. On the downside, as indicated above, white dwarfs remain intrinsically faint and it is often difficult, observationally speaking, to reach comfortable S/Ns. Along with its compact nature, the chemical layering of a pulsating white dwarf is another mechanical property that bears a strong imprint on its period spectrum. Even though a typical white dwarf consists of a C/O core containing more than 99% of its mass, the thin He mantle that surrounds the core (containing at most <1% of the total mass), and the even thinner H layer that envelops a DA star (containing at most <0:01% of the total mass) play a major role in establishing the period distribution. This is because g-modes in white dwarfs have large amplitudes and propagate easily in these outermost layers. The modes are therefore quite sensitive to the details of the chemical stratifica- tion above the core. In fact, the layered structure produces a highly nonuniform period spectrum for a family of g-modes be- have very low amplitudes there. To a large extent, and this is particularly true for the most degenerate configuration repre- sented by ZZ Ceti stars, the degenerate interior of a white dwarf is refractory to asteroseismological probing. This poses a FIG. 6.—Chemical layering in a representative model of a ZZ Ceti pulsator. The location of the atmospheric layers is indicated through the values of the Rosseland optical depth. 3 This is strictly valid only for purely radiative and chemically homogeneous models in the asymptotic regime of high radial order as demonstrated by Tassoul (1980). 2008 PASP, 120:1043–1096 N2 L1 2 250 s
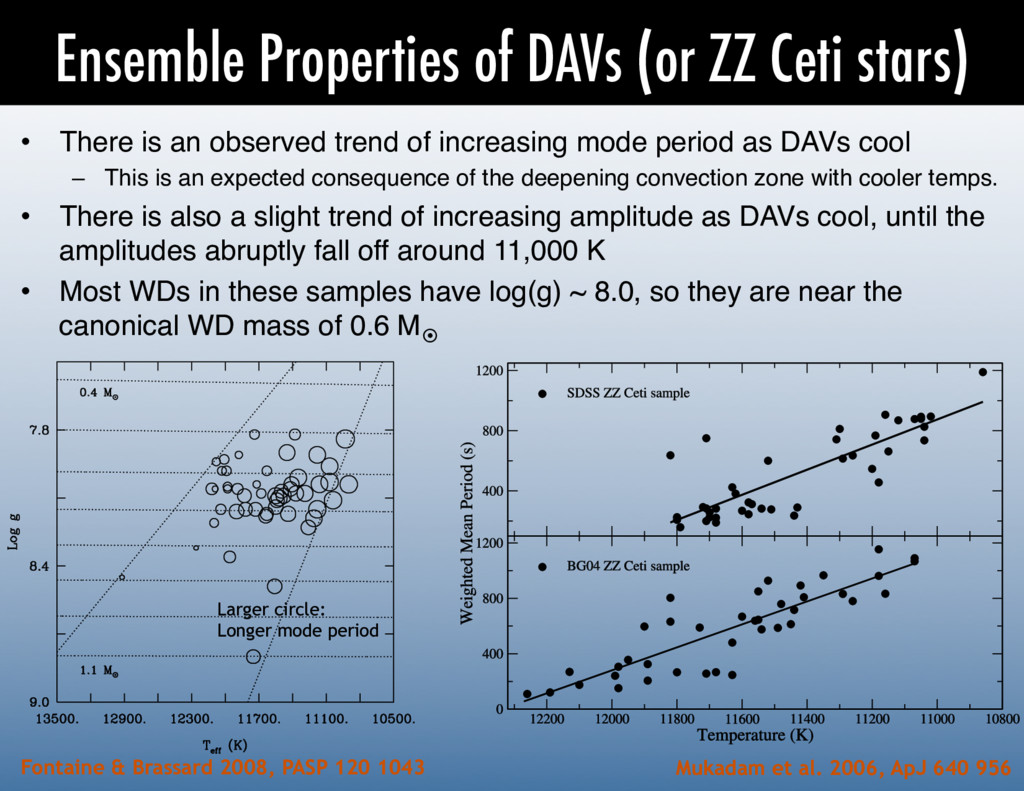
is an observed trend of increasing mode period as DAVs cool! – This is an expected consequence of the deepening convection zone with cooler temps.! • There is also a slight trend of increasing amplitude as DAVs cool, until the amplitudes abruptly fall off around 11,000 K! • Most WDs in these samples have log(g) ~ 8.0, so they are near the canonical WD mass of 0.6 M¤! Mukadam et al. 2006, ApJ 640 956 2004) and Gianninas et al. (2005) have consistent temperatures and log g fits for r latest model atmospheres; we hereafter et of 39 DAVs as the BG04 ZZ Ceti sample. sponding set of 39 pulsation spectra from private communication with our colleagues. he BG04 ZZ Ceti sample were acquired by sing different instruments and telescopes. al amount of time-series data exists on most , and we utilized practically all published carefully derive well-averaged values of d and pulsation amplitudes, which we pre- 2004a) show evidence of a relative shift een the SDSS and BG04 ZZ Ceti instabil- differ in shape and width. The spectra of samples were analyzed using different tech- Fig. 1.—Weighted mean period of 41 newly discovered ZZ Ceti stars from ENSEMBLE CHARACTERISTICS OF ZZ CETI STARS 957 FIG. 24.—Correlation between excited period and effective temperature or Larger circle: Longer mode period Fontaine & Brassard 2008, PASP 120 1043
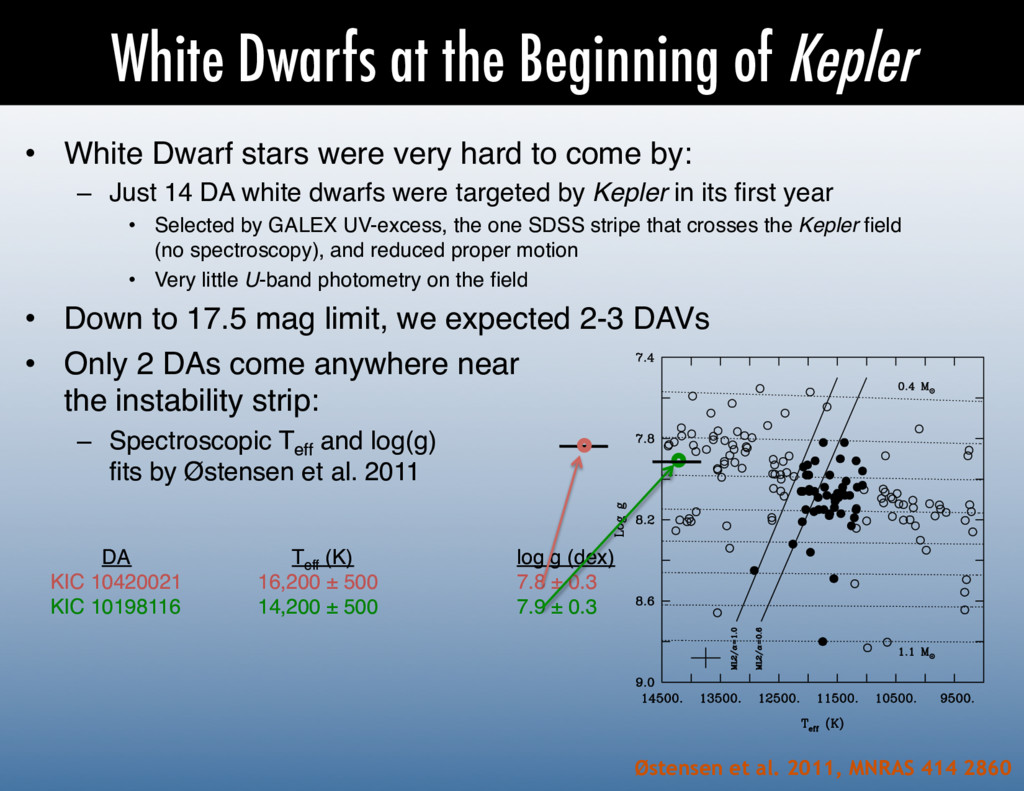
2011, MNRAS 414 2860 • White Dwarf stars were very hard to come by:! – Just 14 DA white dwarfs were targeted by Kepler in its first year! • Selected by GALEX UV-excess, the one SDSS stripe that crosses the Kepler field (no spectroscopy), and reduced proper motion! • Very little U-band photometry on the field! • Down to 17.5 mag limit, we expected 2-3 DAVs! • Only 2 DAs come anywhere near the instability strip:! – Spectroscopic Teff and log(g) fits by Østensen et al. 2011! ( T c t s t b t p t o D p i s s a p b r t ( t FIG. 9.—Instability domain in the log g À Teff diagram for the ZZ Ceti stars. The positions of the pulsators are indicated by the filled circles, while those of 1054 FONTAINE & BRASSARD !DA ! ! ! Teff (K)! ! ! !log g (dex)! KIC 10420021 ! !16,200 ± 500 ! ! !7.8 ± 0.3! KIC 10198116 ! !14,200 ± 500 ! ! !7.9 ± 0.3!
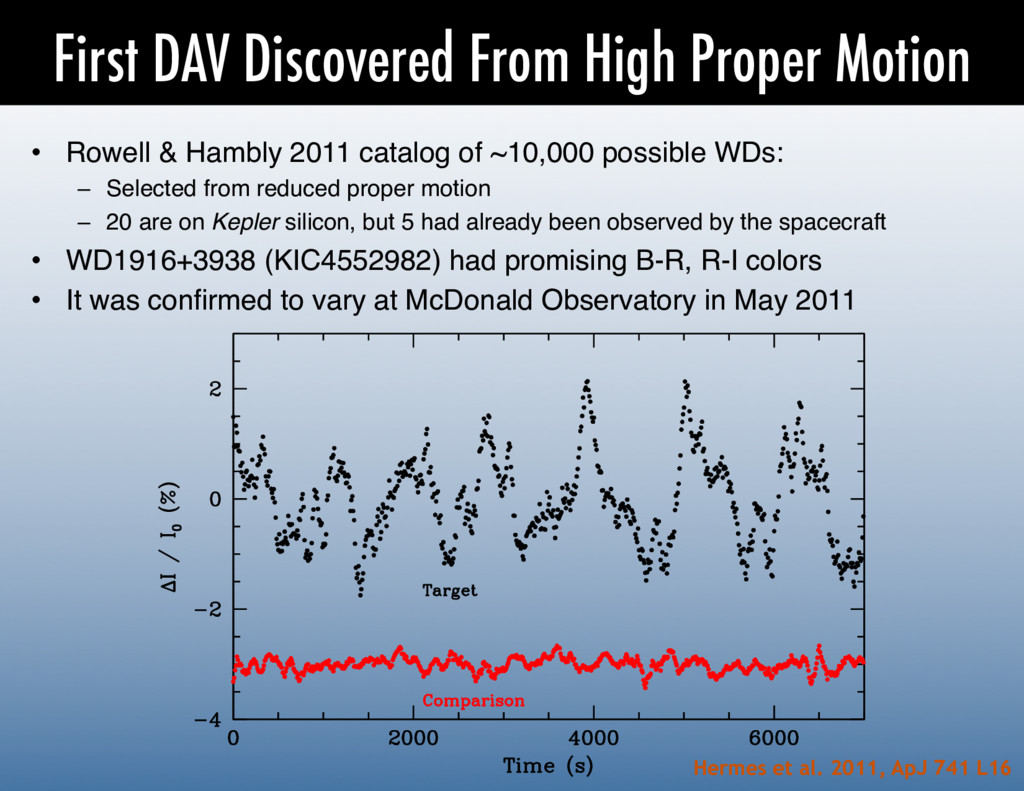
Hambly 2011 catalog of ~10,000 possible WDs:! – Selected from reduced proper motion! – 20 are on Kepler silicon, but 5 had already been observed by the spacecraft! • WD1916+3938 (KIC4552982) had promising B-R, R-I colors! • It was confirmed to vary at McDonald Observatory in May 2011! ! Hermes et al. 2011, ApJ 741 L16
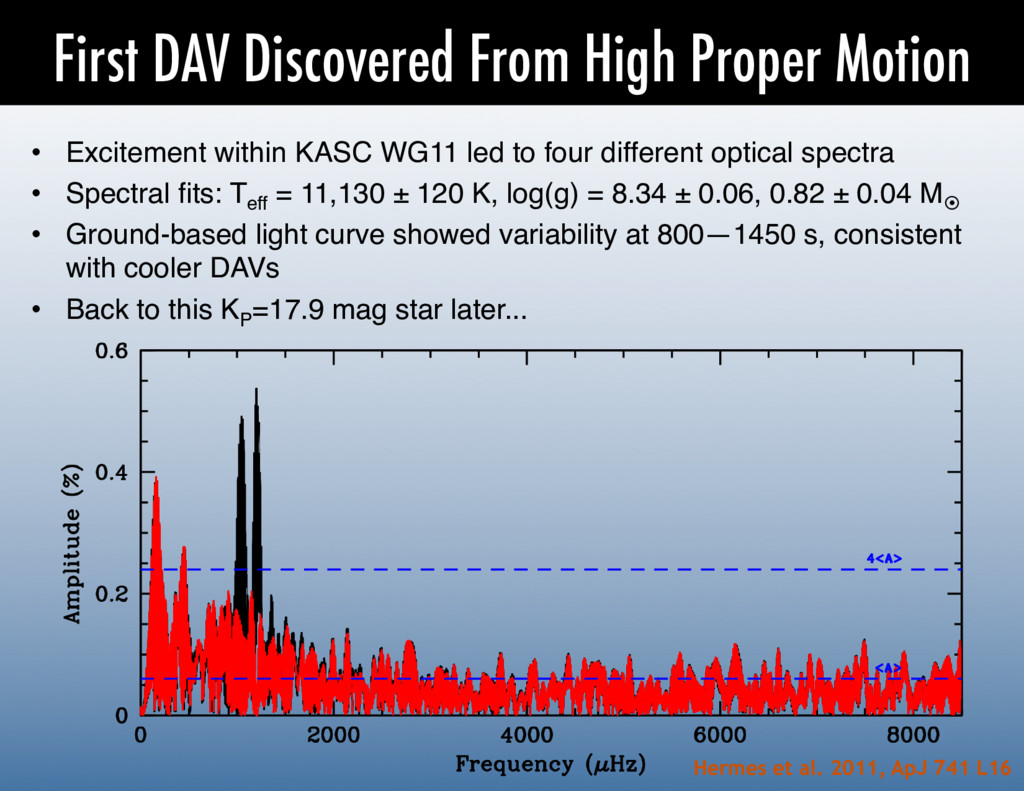
KASC WG11 led to four different optical spectra! • Spectral fits: Teff = 11,130 ± 120 K, log(g) = 8.34 ± 0.06, 0.82 ± 0.04 M¤! • Ground-based light curve showed variability at 800—1450 s, consistent with cooler DAVs! • Back to this KP =17.9 mag star later...! Hermes et al. 2011, ApJ 741 L16
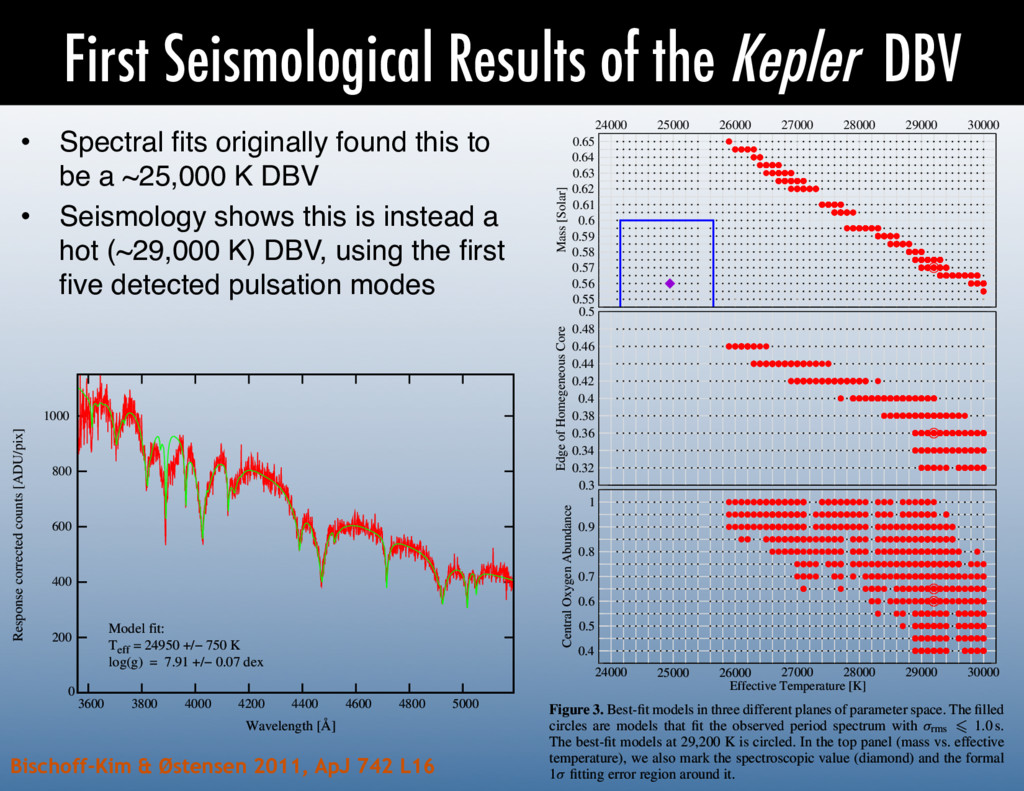
originally found this to be a ~25,000 K DBV! • Seismology shows this is instead a hot (~29,000 K) DBV, using the first five detected pulsation modes! Bischoff-Kim & Østensen 2011, ApJ 742 L16 The Astrophysical Journal Letters, 742:L16 (5pp), 2011 November 20 24000 25000 26000 27000 28000 29000 30000 0.55 0.56 0.57 0.58 0.59 0.6 0.61 0.62 0.63 0.64 0.65 Mass [Solar] 0.3 0.32 0.34 0.36 0.38 0.4 0.42 0.44 0.46 0.48 0.5 Edge of Homegeneous Core 24000 25000 26000 27000 28000 29000 30000 Effective Temperature [K] 0.4 0.5 0.6 0.7 0.8 0.9 1 Central Oxygen Abundance Figure 3. Best-fit models in three different planes of parameter space. The filled circles are models that fit the observed period spectrum with σrms 1.0 s. The best-fit models at 29,200 K is circled. In the top panel (mass vs. effective temperature), we also mark the spectroscopic value (diamond) and the formal 1σ fitting error region around it. Letters, 736:L39 (5pp), 2011 August 1 Østensen et al. 0 200 400 600 800 1000 3600 3800 4000 4200 4400 4600 4800 5000 Response corrected counts [ADU/pix] Wavelength [Å] Teff = 24950 +/− 750 K log(g) = 7.91 +/− 0.07 dex Model fit: trum of GALEX J192904.6+444708. Overplotted is our best-fit DB model spectrum with Teff and log g as stated on the figure. Except , the model is an excellent fit to the observed spectrum. s available in the online journal.)
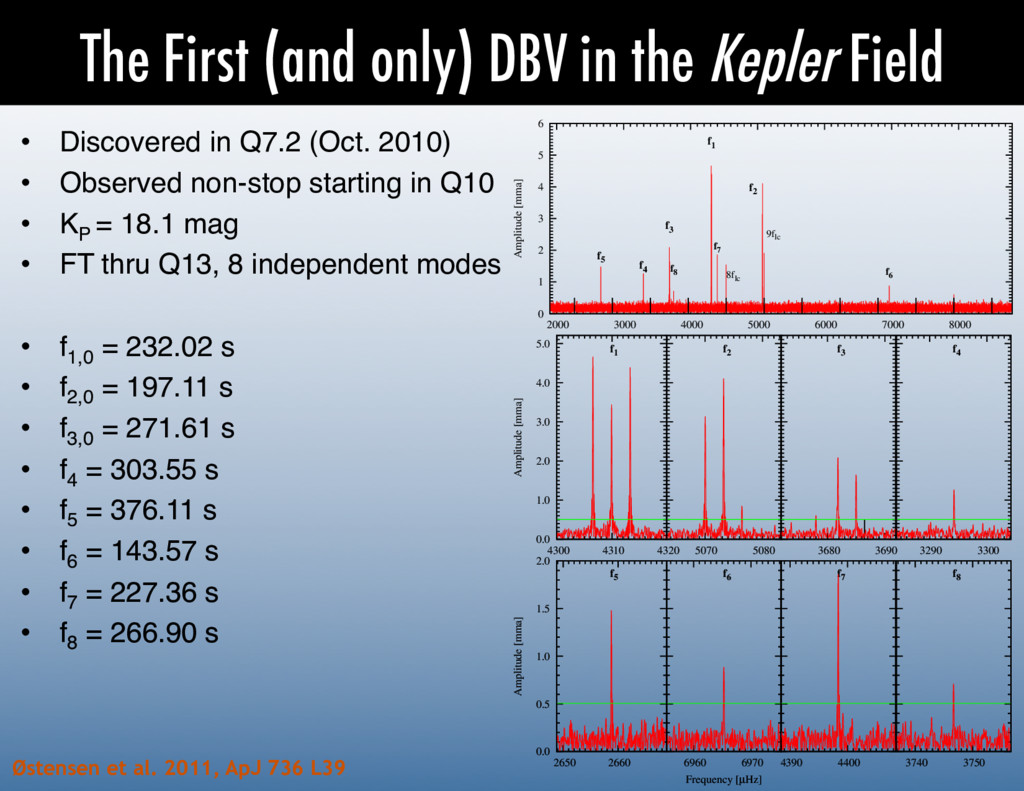
in preparation • Additional observations have uncovered 8 significant, independent modes! • Seismology still suggests this is a hot DBV, with a mass near 0.57 M¤! ((O-C)2)1/2 [0.1 s] Best Fit Worse Fit
in preparation • The models show a good constraint on the helium layer mass! • The best fits occur for a roughly canonical He-layer mass, MHe /M★ ~ 10-2.8! ((O-C)2)1/2 [0.1 s] Log - - - - - - - - . . . . . . . . Best Fit Worse Fit
in preparation • We continue to get similar results regarding the degeneracy boundary: The carbon-oxygen core extends to roughly 40% of mass! ((O-C)2)1/2 [0.1 s] Best Fit Worse Fit
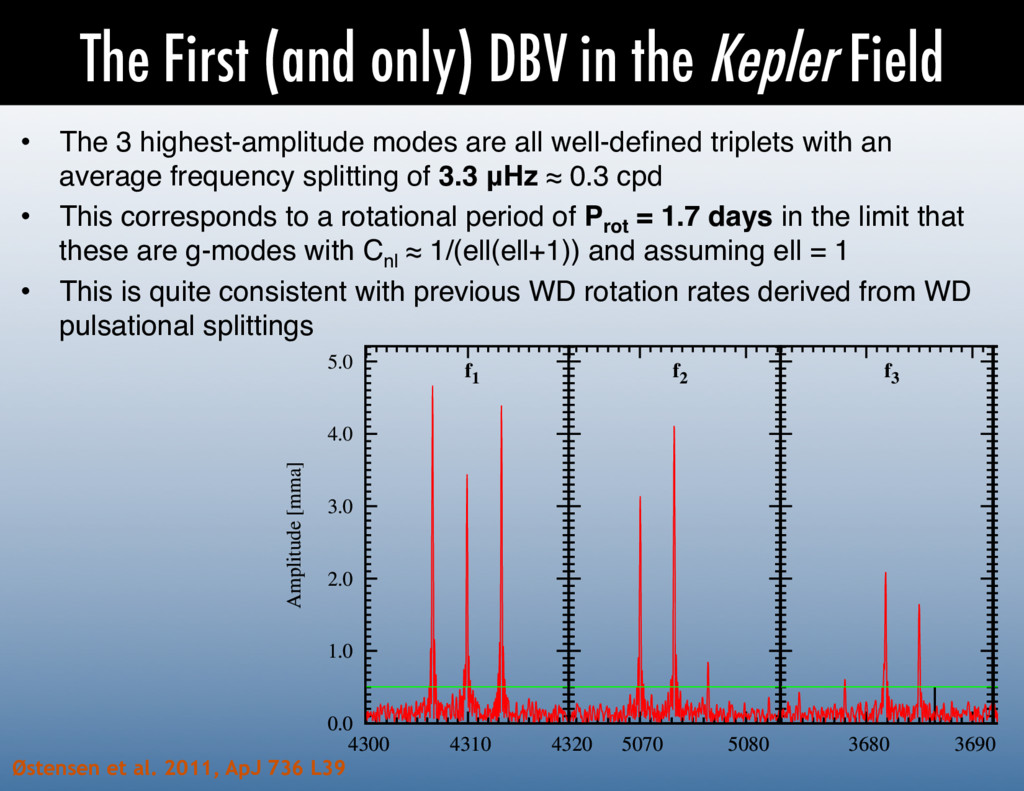
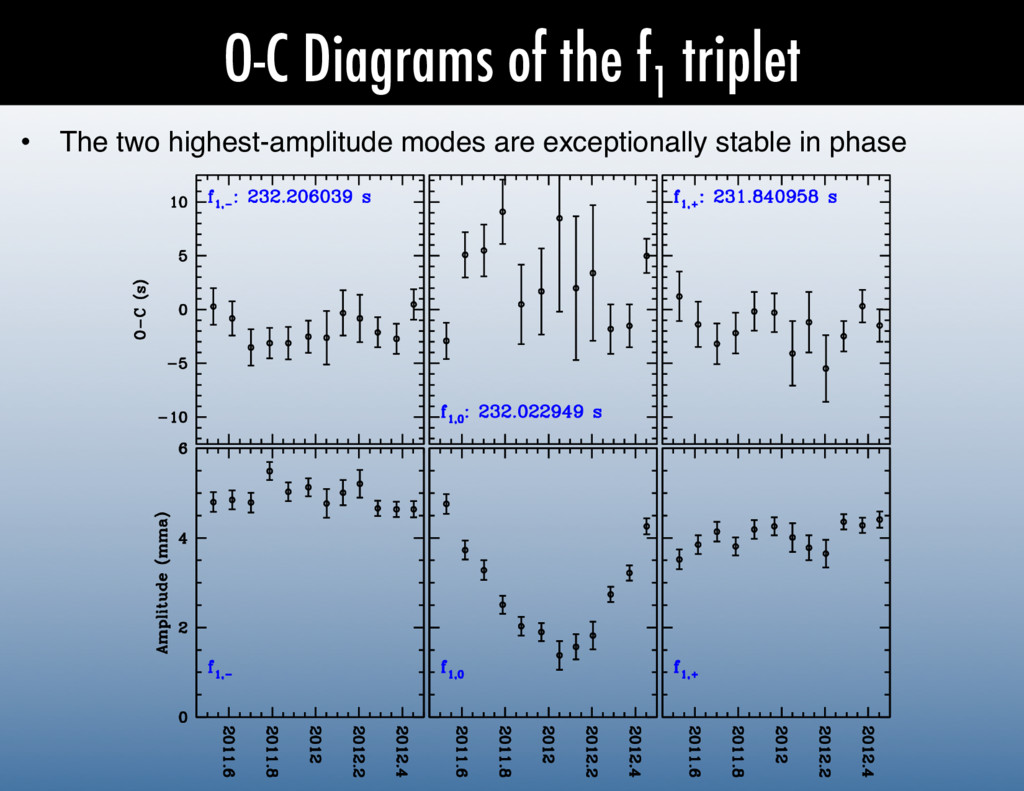
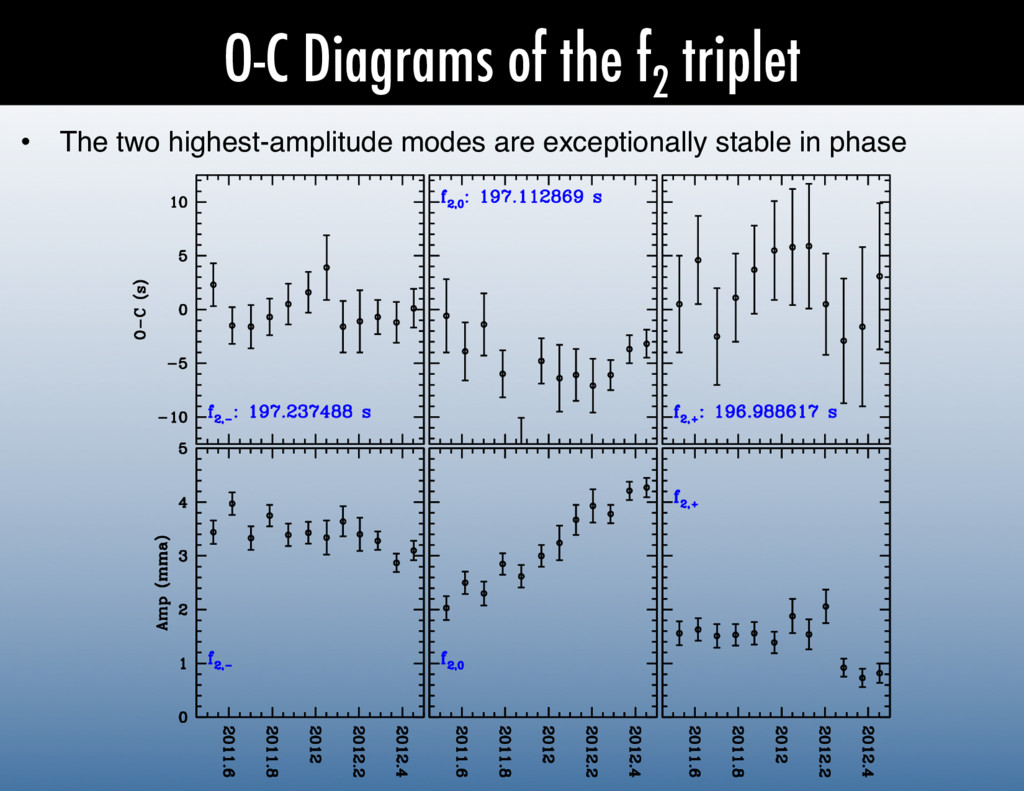
The 3 highest-amplitude modes are all well-defined triplets with an average frequency splitting of 3.3 μHz ≈ 0.3 cpd! • This corresponds to a rotational period of Prot = 1.7 days in the limit that these are g-modes with Cnl ≈ 1/(ell(ell+1)) and assuming ell = 1! • This is quite consistent with previous WD rotation rates derived from WD pulsational splittings! Østensen et al. 2011, ApJ 736 L39 0 1 2 3 4 5 2000 3000 4000 5000 6000 7000 Amplitude [mma] 1 f2 f3 f4 f5 f6 f7 f8 8flc 9flc 0.0 1.0 2.0 3.0 4.0 5.0 4300 4310 4320 Amplitude [mma] f1 5070 5080 f2 3680 3690 f3 2.0
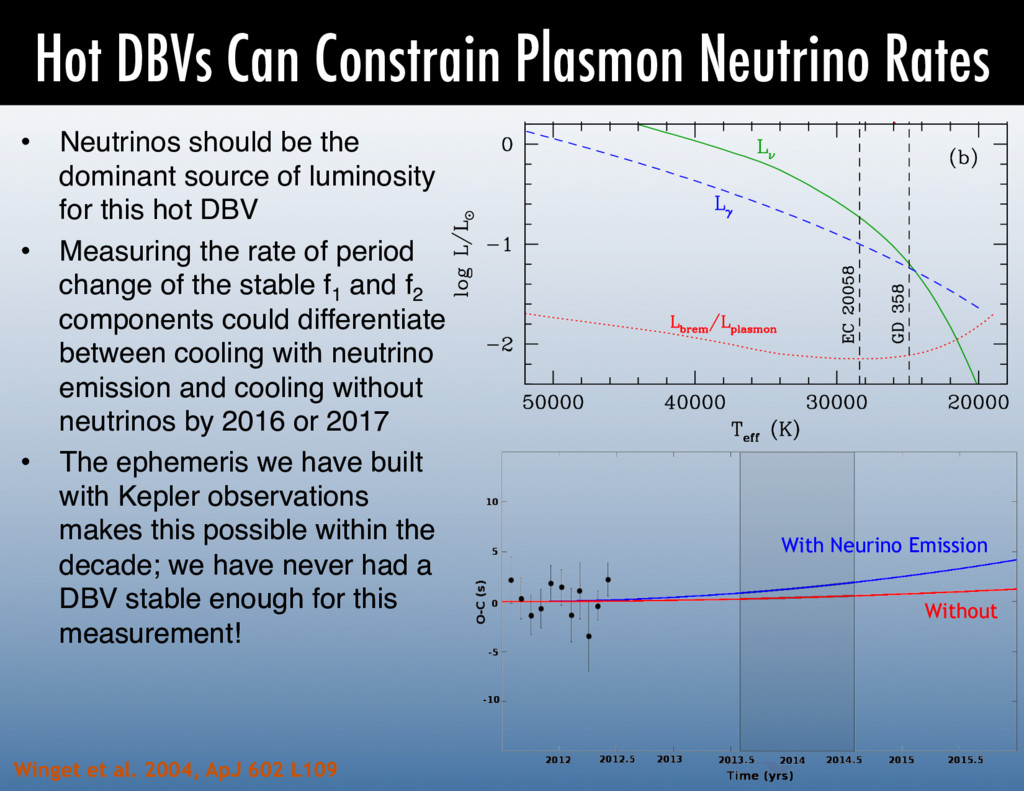
be the dominant source of luminosity for this hot DBV! • Measuring the rate of period change of the stable f1 and f2 components could differentiate between cooling with neutrino emission and cooling without neutrinos by 2016 or 2017! • The ephemeris we have built with Kepler observations makes this possible within the decade; we have never had a DBV stable enough for this measurement!! Winget et al. 2004, ApJ 602 L109 With Neurino Emission Without
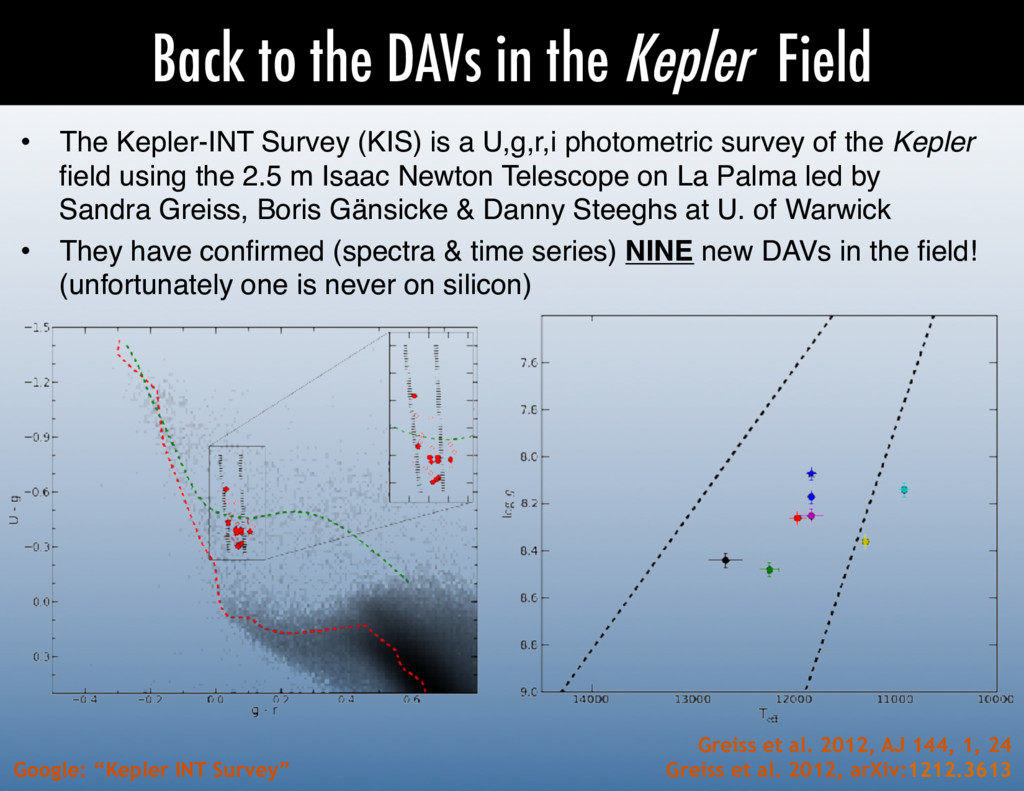
Kepler-INT Survey (KIS) is a U,g,r,i photometric survey of the Kepler field using the 2.5 m Isaac Newton Telescope on La Palma led by Sandra Greiss, Boris Gänsicke & Danny Steeghs at U. of Warwick! • They have confirmed (spectra & time series) NINE new DAVs in the field! (unfortunately one is never on silicon)! Greiss et al. 2012, AJ 144, 1, 24 Greiss et al. 2012, arXiv:1212.3613 Google: “Kepler INT Survey”
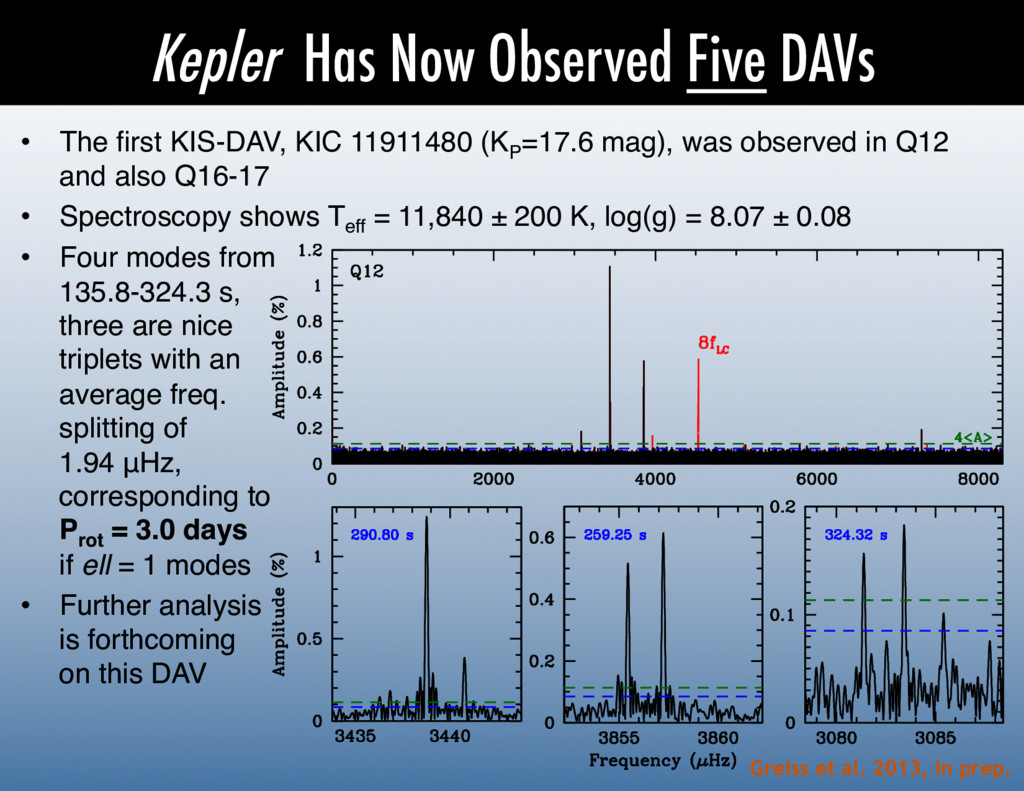
KIC 11911480 (KP =17.6 mag), was observed in Q12 and also Q16-17! • Spectroscopy shows Teff = 11,840 ± 200 K, log(g) = 8.07 ± 0.08! • Four modes from 135.8-324.3 s, three are nice triplets with an average freq. splitting of 1.94 μHz, corresponding to Prot = 3.0 days if ell = 1 modes! • Further analysis is forthcoming on this DAV! Greiss et al. 2013, in prep.
KIC 10132702 (KP =18.6), was observed in Q15! • Spectroscopy shows Teff = 11,840 ± 300 K, log(g) = 8.25 ± 0.10! • These data are very fresh, but we see at least 15 modes from 450-1000 s!!
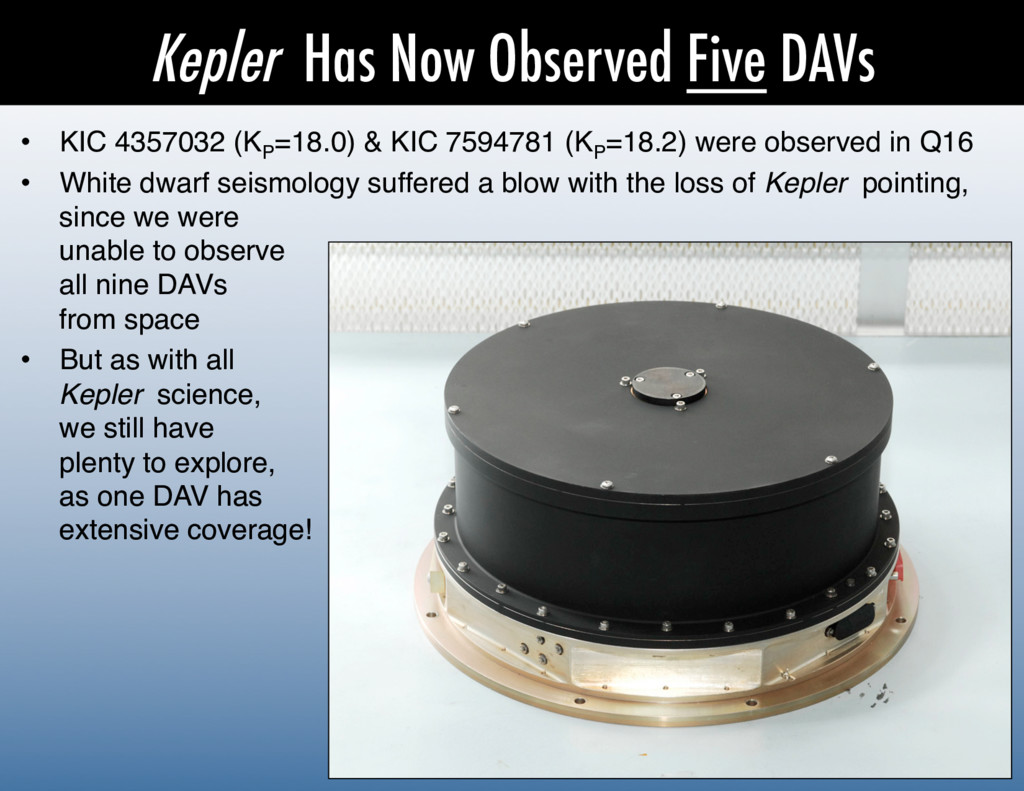
=18.0) & KIC 7594781 (KP =18.2) were observed in Q16! • White dwarf seismology suffered a blow with the loss of Kepler pointing, since we were unable to observe all nine DAVs from space! • But as with all Kepler science, we still have plenty to explore, as one DAV has extensive coverage!!
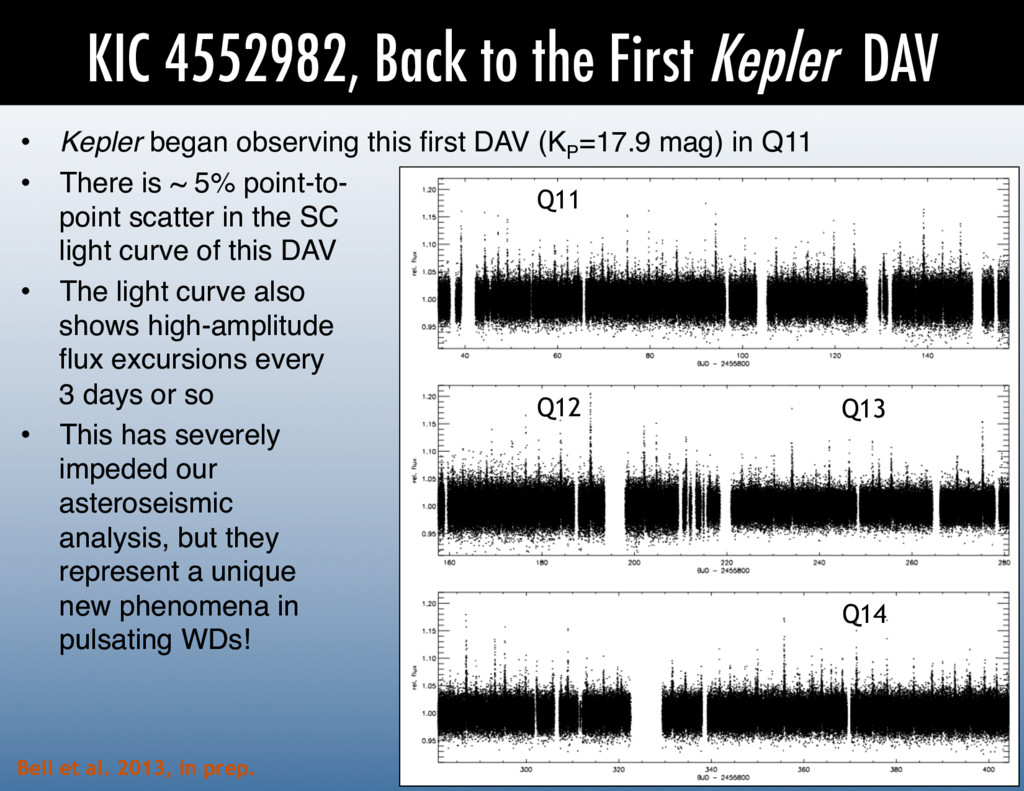
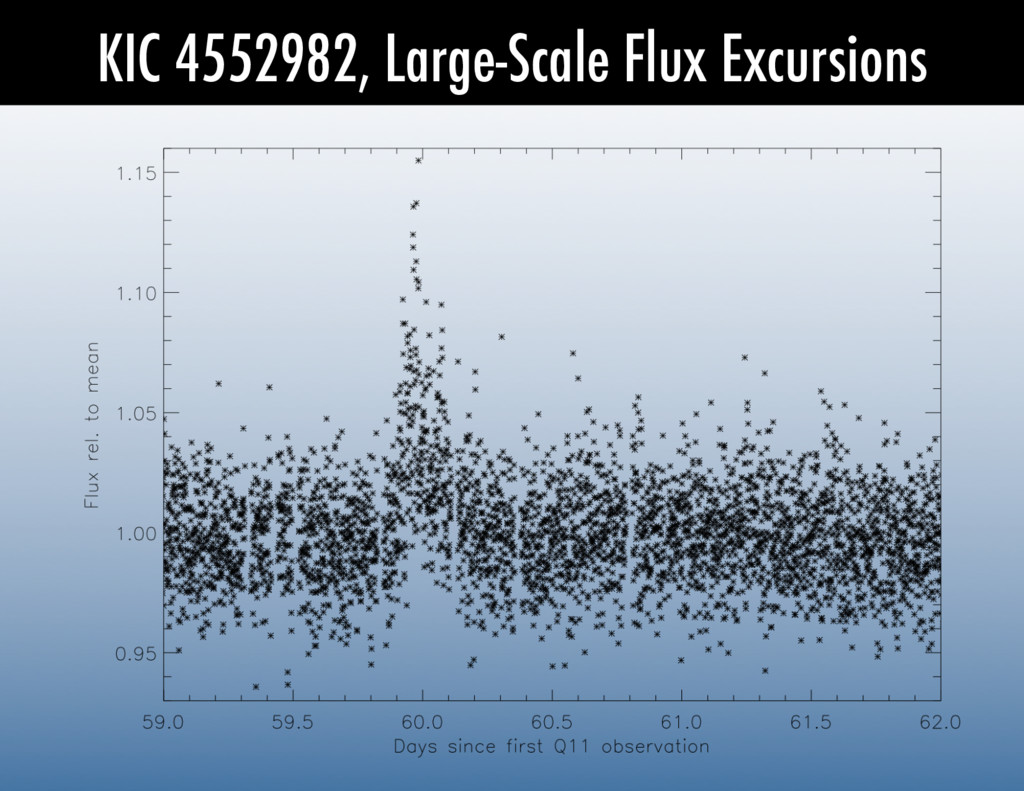
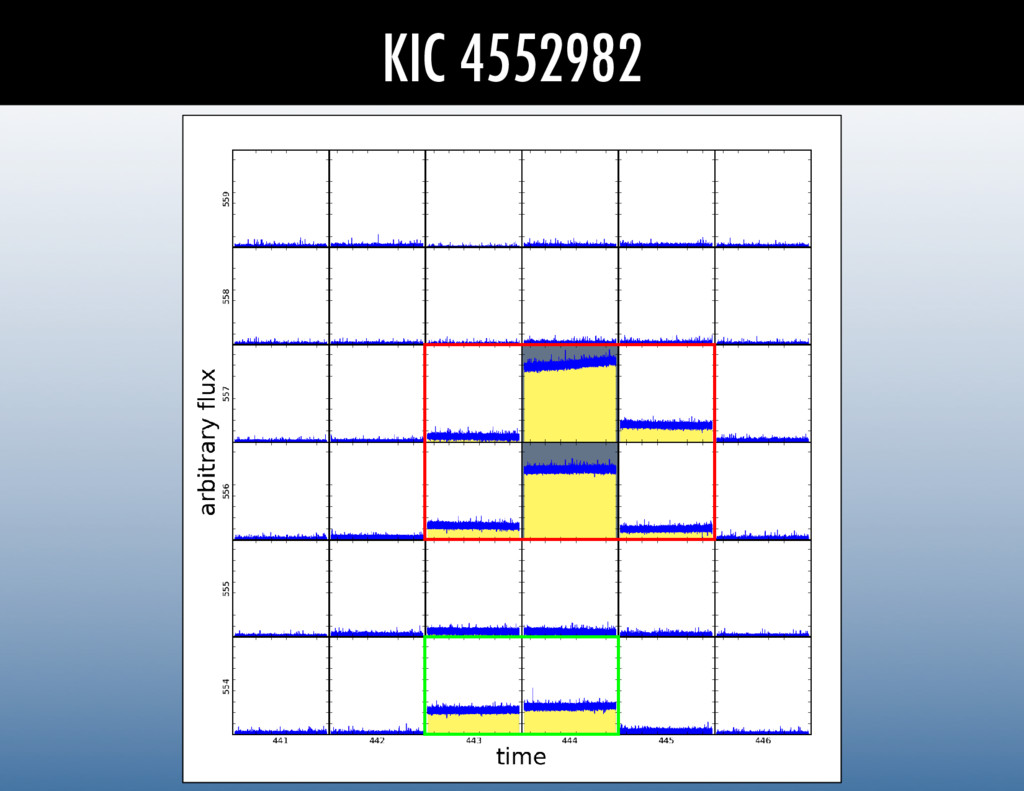
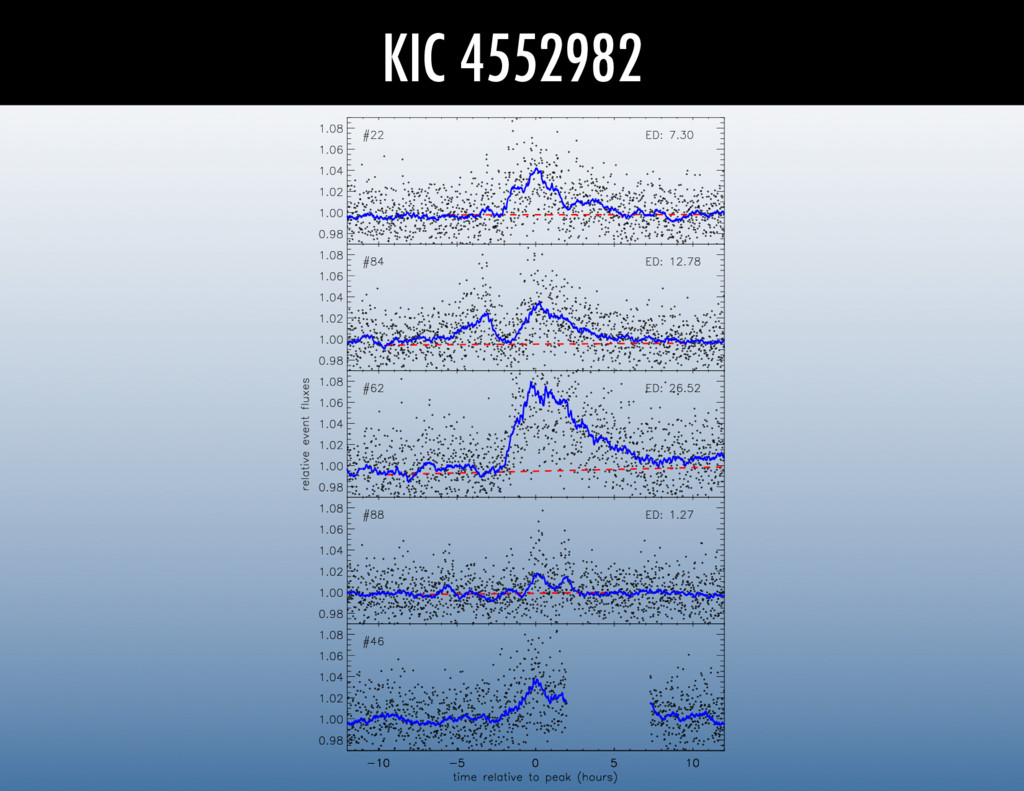
Q13 Q14 • Kepler began observing this first DAV (KP =17.9 mag) in Q11! • There is ~ 5% point-to- point scatter in the SC light curve of this DAV! • The light curve also shows high-amplitude flux excursions every 3 days or so! • This has severely impeded our asteroseismic analysis, but they represent a unique new phenomena in pulsating WDs!! Bell et al. 2013, in prep.
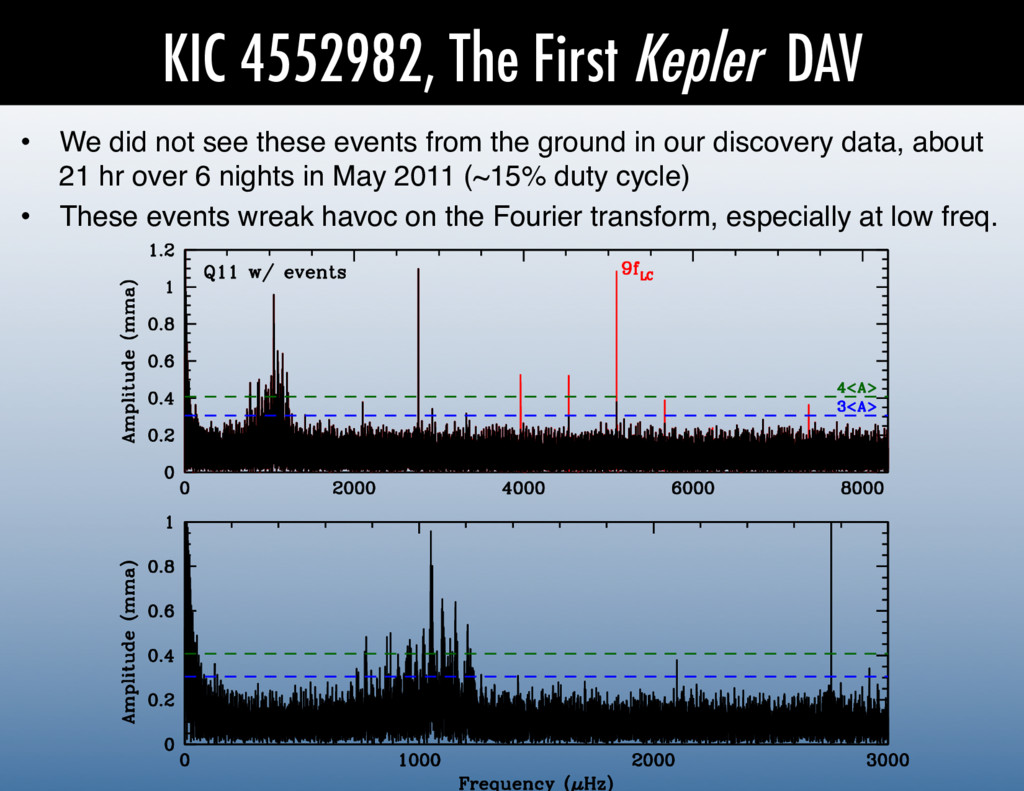
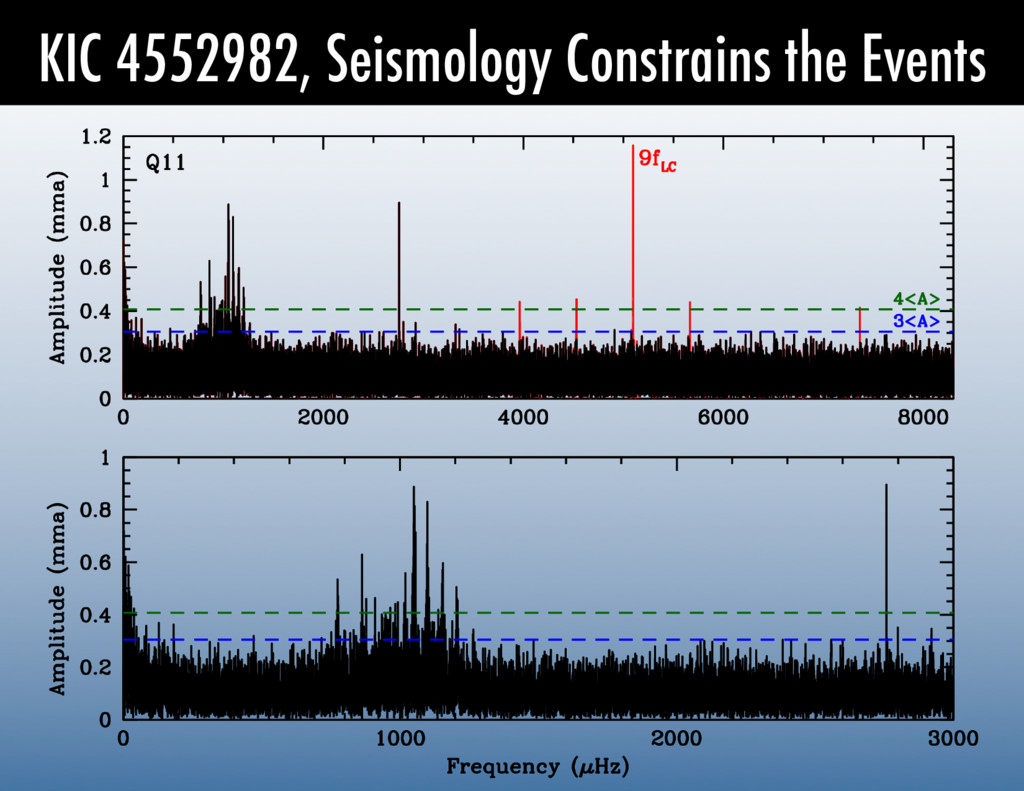
see these events from the ground in our discovery data, about 21 hr over 6 nights in May 2011 (~15% duty cycle)! • These events wreak havoc on the Fourier transform, especially at low freq.!
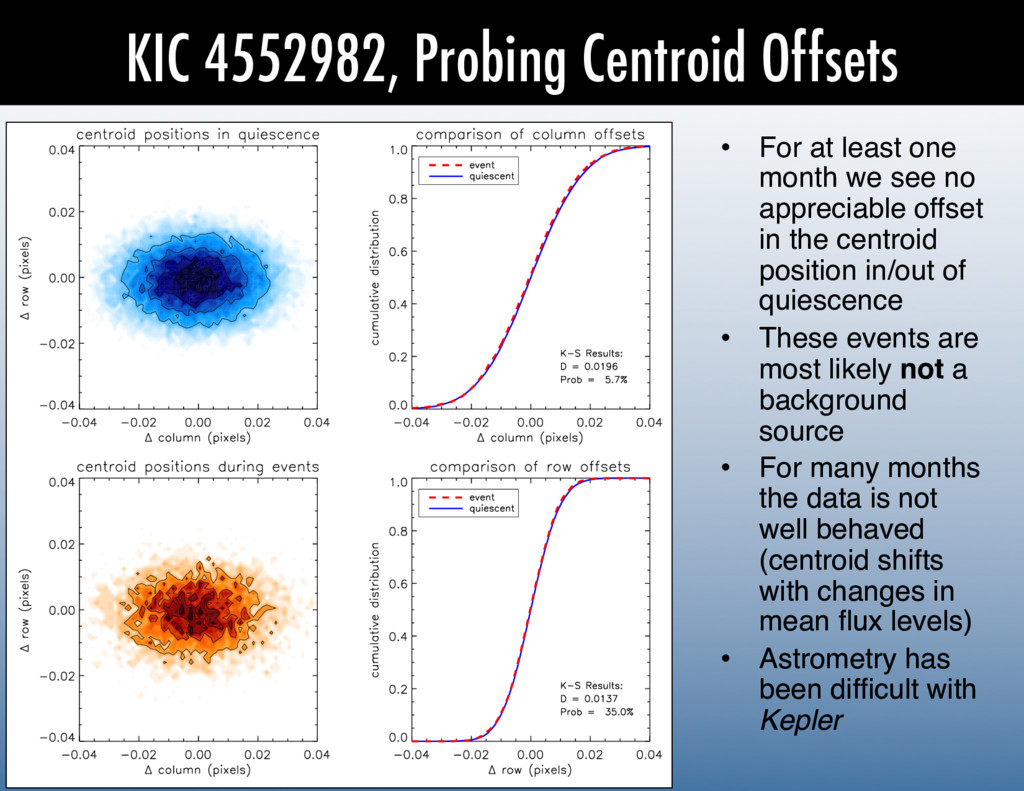
month we see no appreciable offset in the centroid position in/out of quiescence! • These events are most likely not a background source! • For many months the data is not well behaved (centroid shifts with changes in mean flux levels)! • Astrometry has been difficult with Kepler!
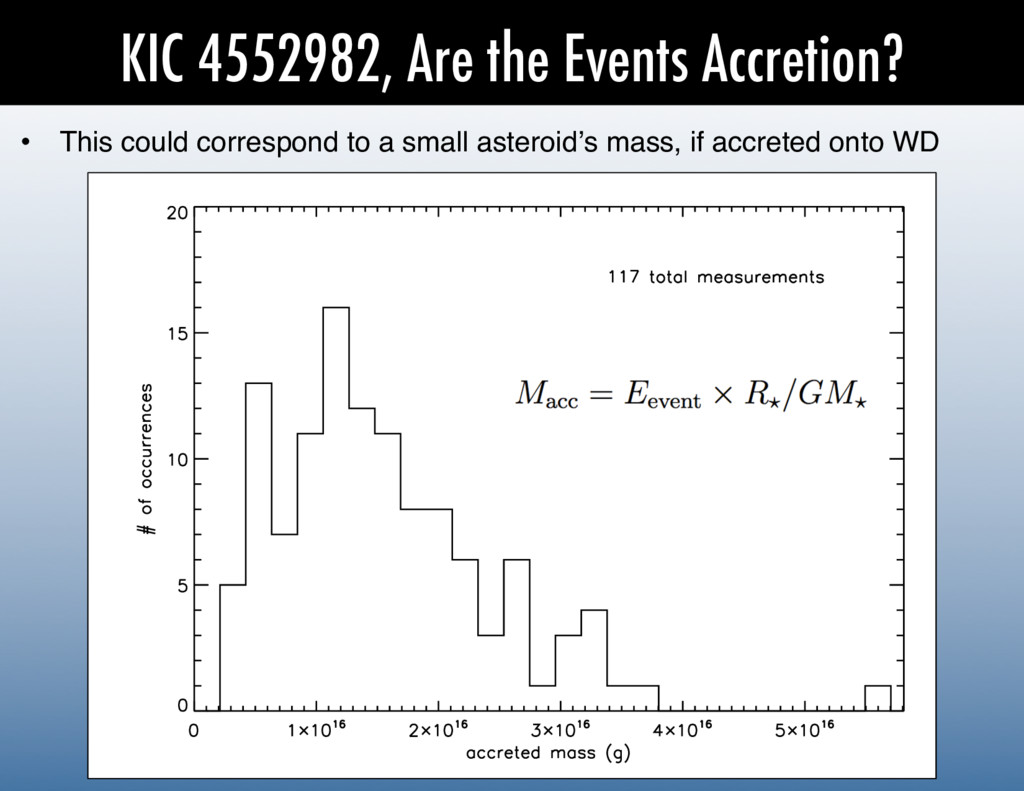
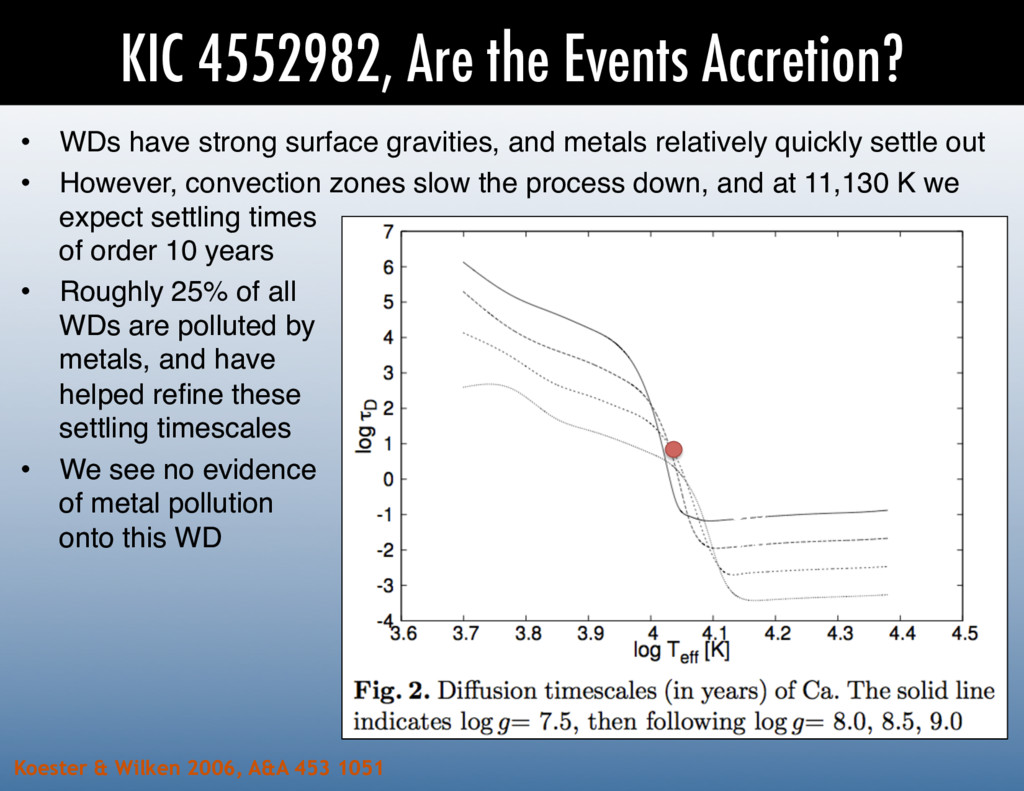
8.5 9.0 Koester & Wilken 2006, A&A 453 1051 • WDs have strong surface gravities, and metals relatively quickly settle out! • However, convection zones slow the process down, and at 11,130 K we expect settling times of order 10 years! • Roughly 25% of all WDs are polluted by metals, and have helped refine these settling timescales! • We see no evidence of metal pollution onto this WD!
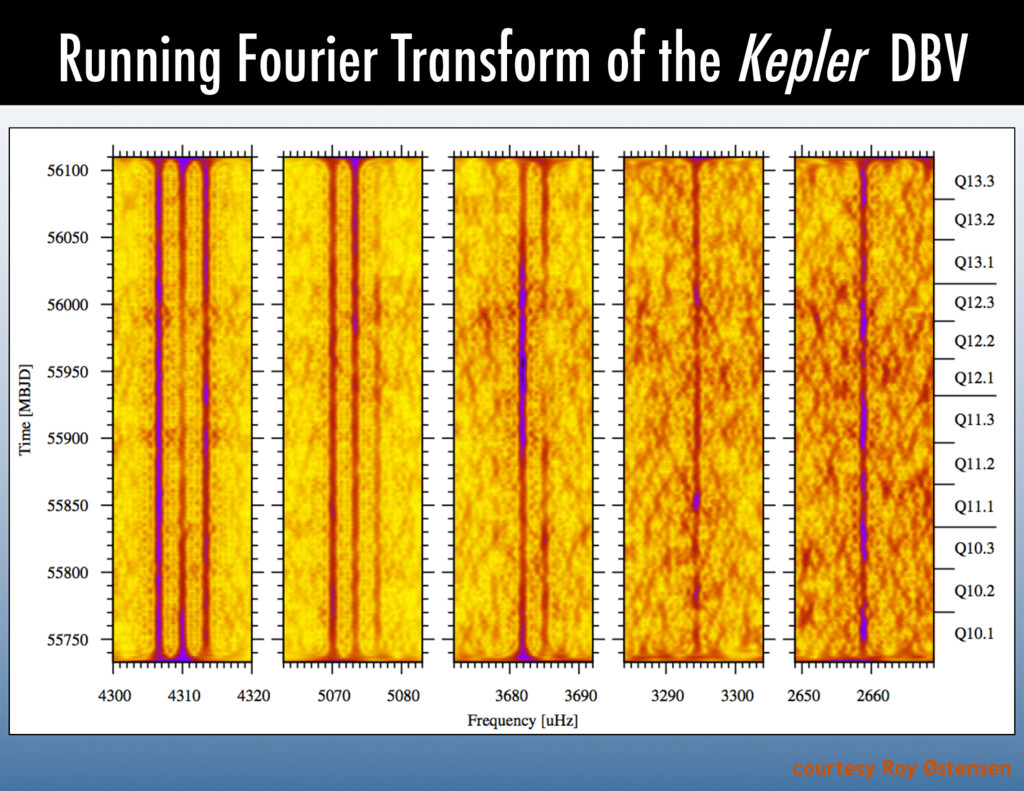
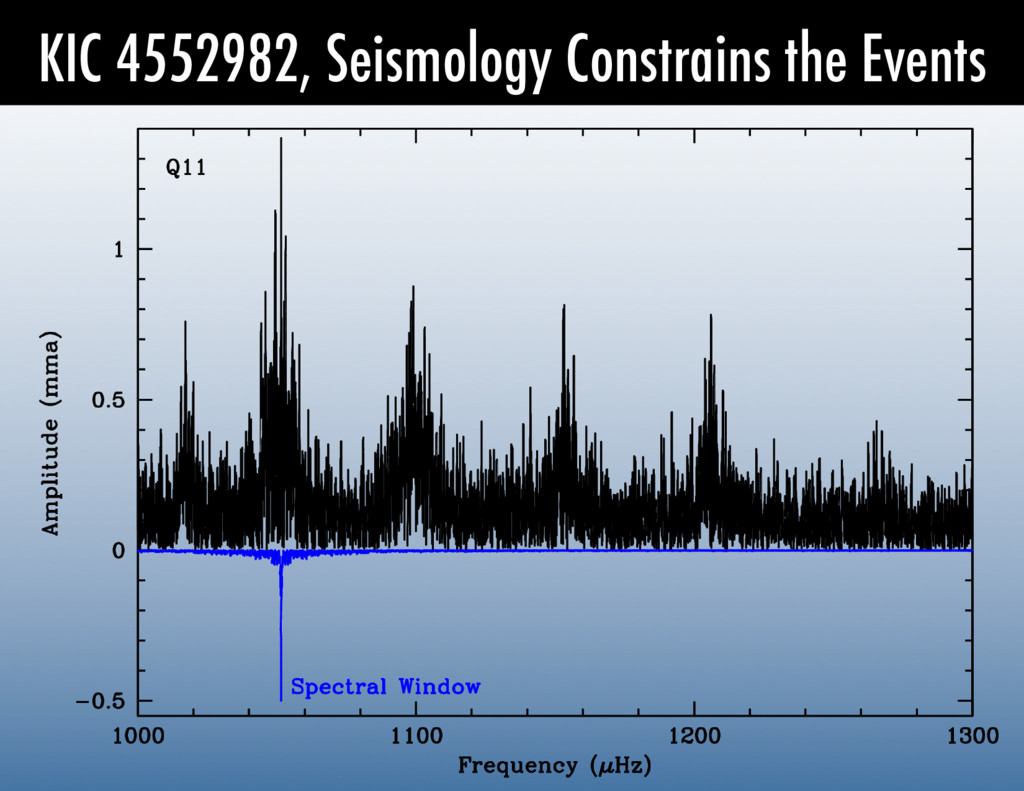
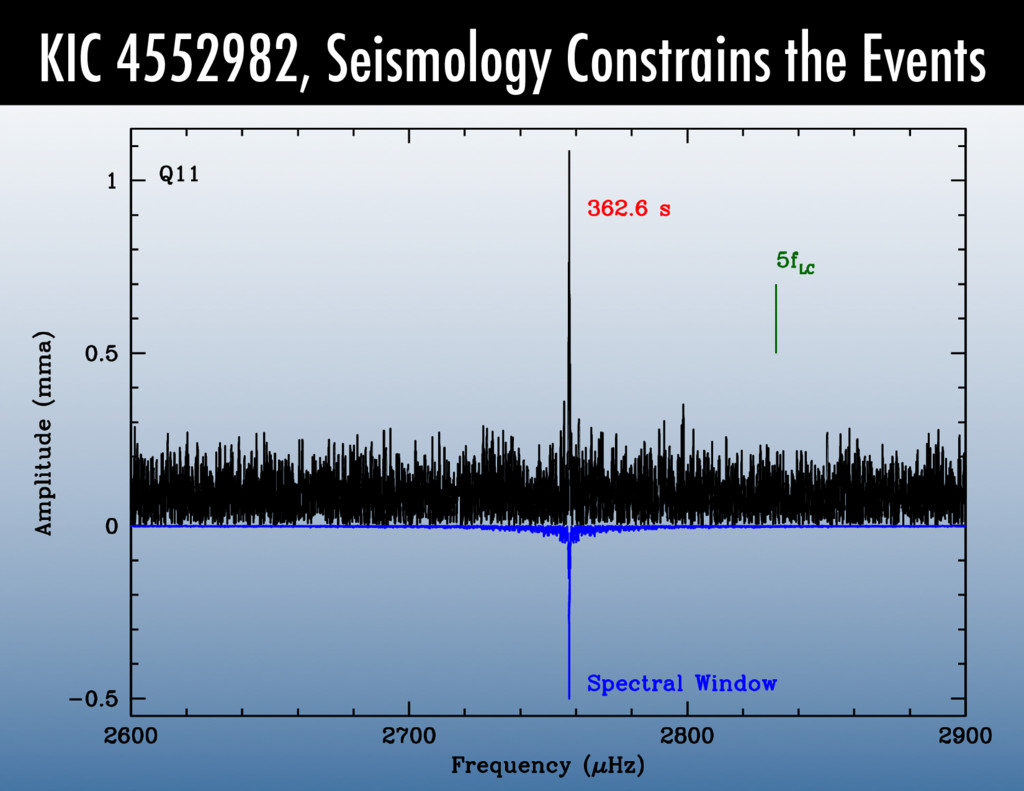
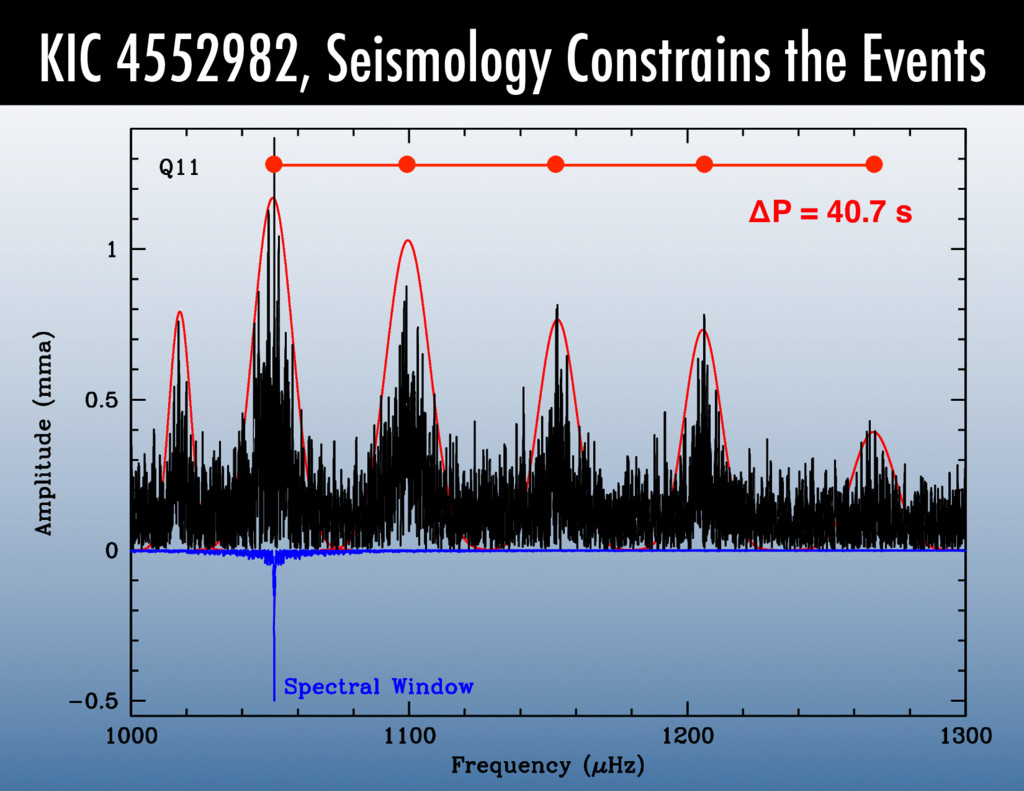
of the region of pulsations (this is shown zoomed from roughly 1670 s to 770 s) is incredibly dense! • This is ~90 days of ~97% duty cycle data (Q11), so the spectral window is incredibly sharp (basically the width of each peak)!
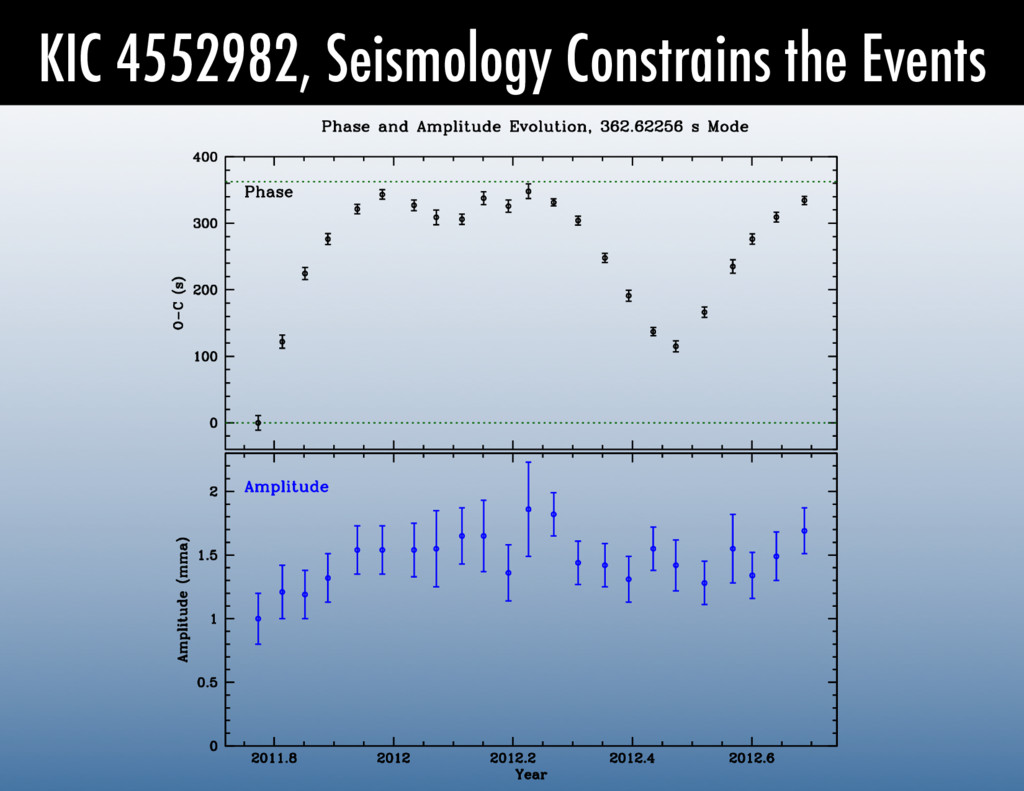
s 950 s • The observed modes fit marginally best as k = 6, 17—22 (all ell = 1)! • Best model: Teff = 11,200 K, M = 0.805 M¤ , MHe = 10-2 M¤ , MH = 10-5.5 M¤ ! • Perhaps more usefully, seismology establishes that the events are occurring at the surface of this WD, and are more strongly affecting the pulsations nearer the surface! • The isolated 362.6 s mode has lower k, even if has a different ell value, and propagates deeper in the star than the longer-period modes! • This 362.6 s mode is thus more insulated from changes at the surface of the star, which can explain why the 362.6 s mode is changing much less dramatically over the timescale of our observations! = log (1-M(r)/M★ )
known pulsating white dwarfs known in the Kepler field, but only six were observed before May 2013! • There is one DBV: It has more than 1.5 years of SC data! – Seismology suggests this is a hot (29,000 K) DBV with a mass near 0.57 M¤ – Longer-term monitoring can constrain the neutrino luminosity from this WD! • The first DAV in the Kepler field is a complicated mess of variability that will be difficult but exciting to interpret! – There are unprecedented large-scale flux excursions every ~3 days! – These events are very likely on the surface of the WD:! – The low-k pulsation appears much less affected by these outbursts than the longer-period high-k modes! • There may be more surprises as we investigate the other DAVs observed from space found by the Kepler-INT Survey!
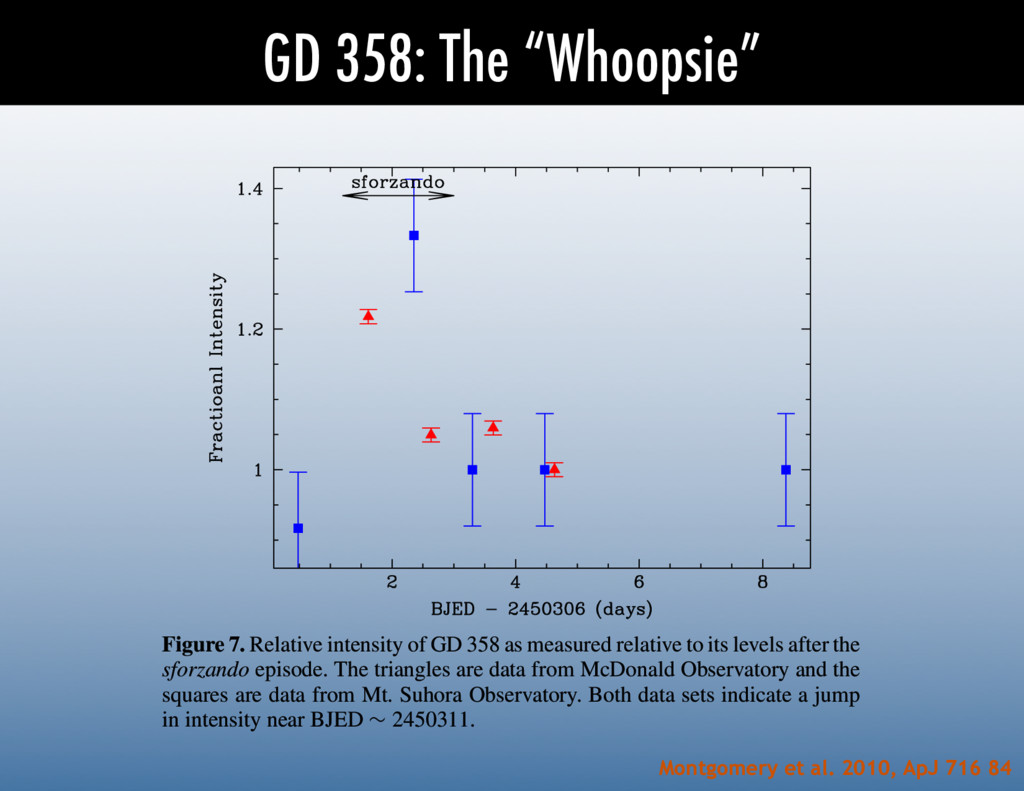
84 No. 1, 2010 TEMPERATURE CHANGE AND OBLIQUE P Figure 7. Relative intensity of GD 358 as measured relative to its levels after the sforzando episode. The triangles are data from McDonald Observatory and the squares are data from Mt. Suhora Observatory. Both data sets indicate a jump in intensity near BJED ∼ 2450311. (A color version of this figure is available in the online journal.) One ef is to atte its base. amplitud where F0 the instan at the pho of the mo If we a of the co Equation to an inc we would apparent a large fa increase