Upgrade to Pro — share decks privately, control downloads, hide ads and more …

Measuring Dependency Freshness in Software Systems

Measuring Dependency Freshness in Software Systems

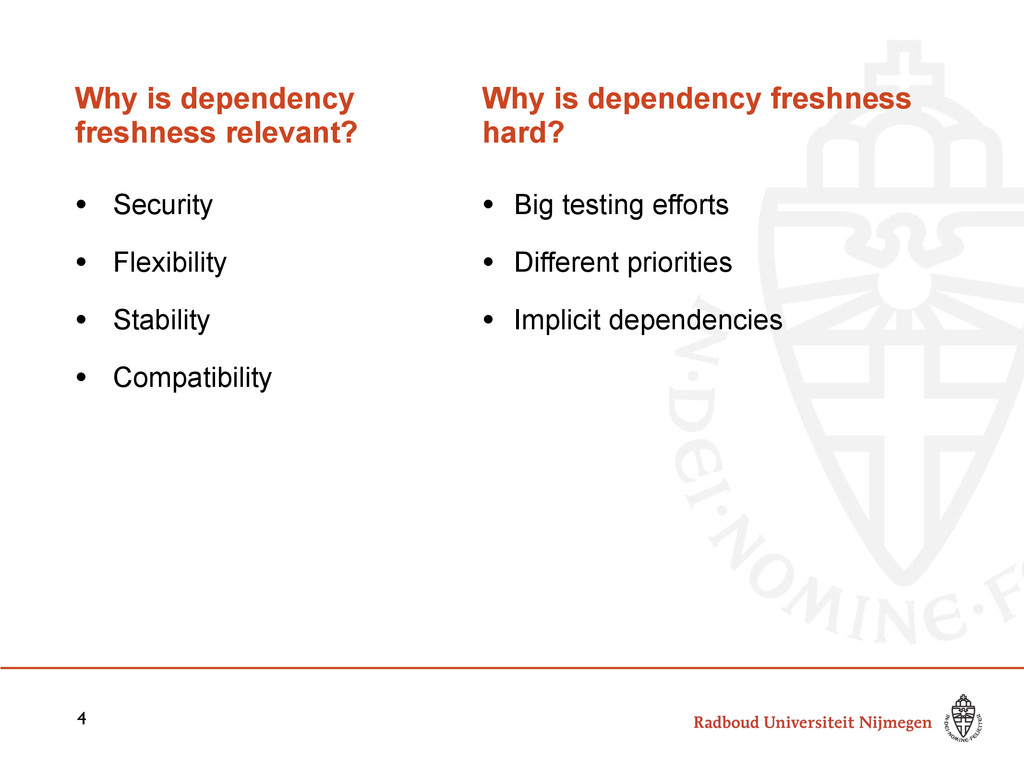
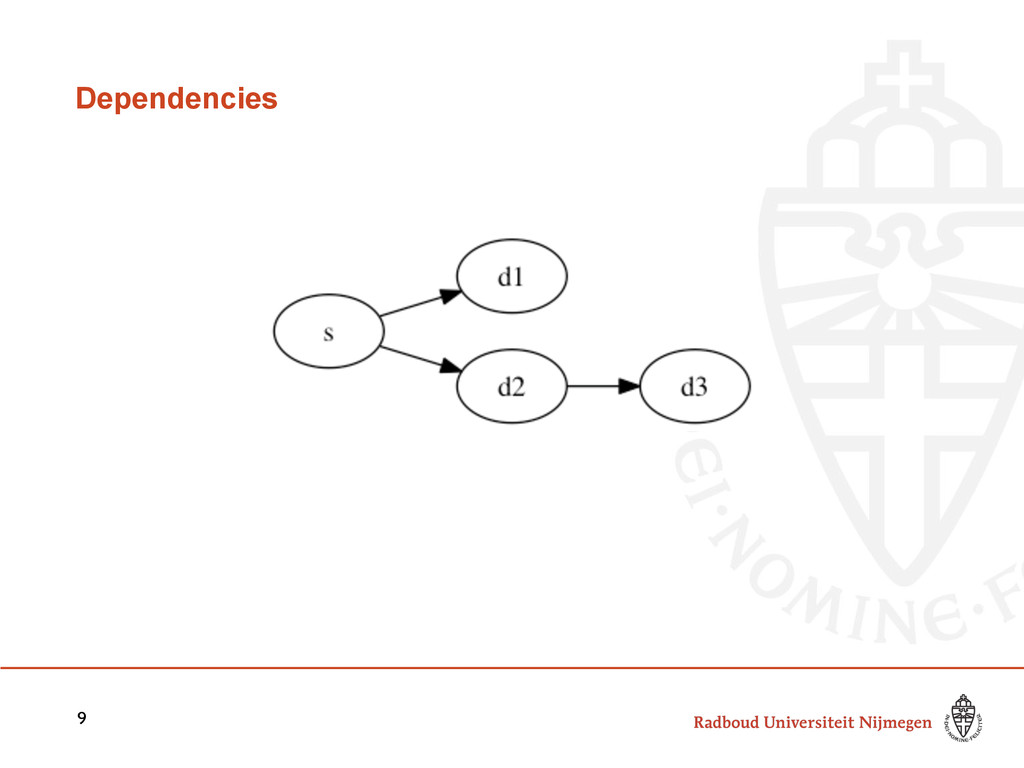
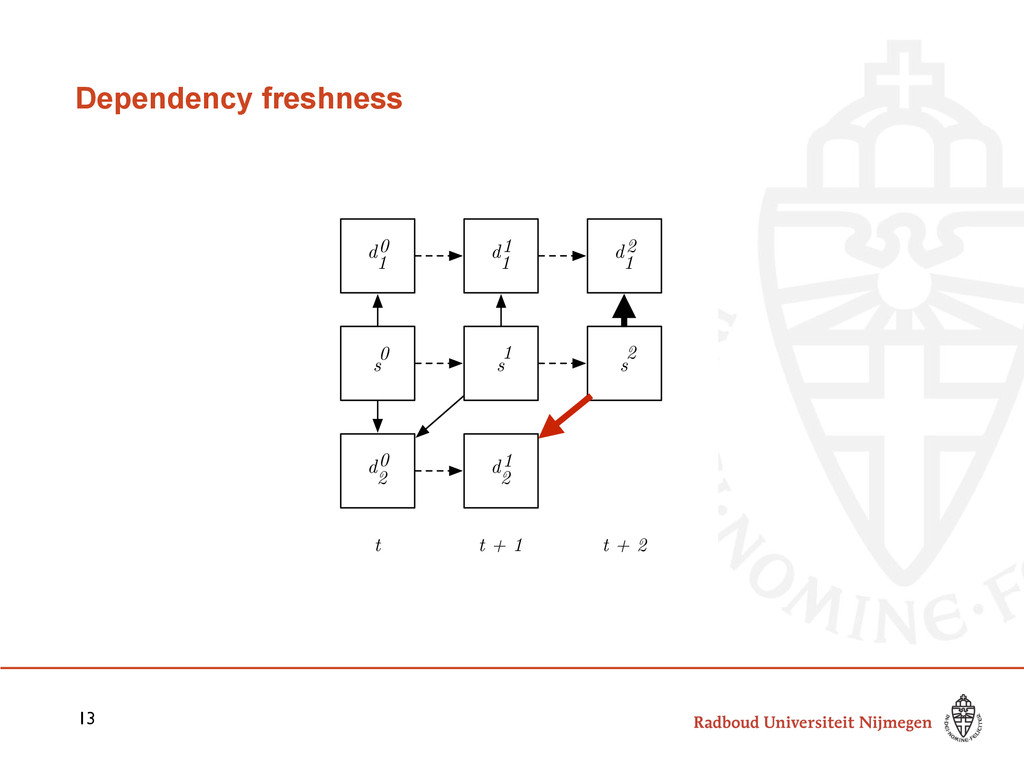
Modern software systems often make use of third- party components to speed-up development and reduce maintenance costs. In return, developers need to update to new releases of these dependencies to avoid, for example, security and compatibility risks.

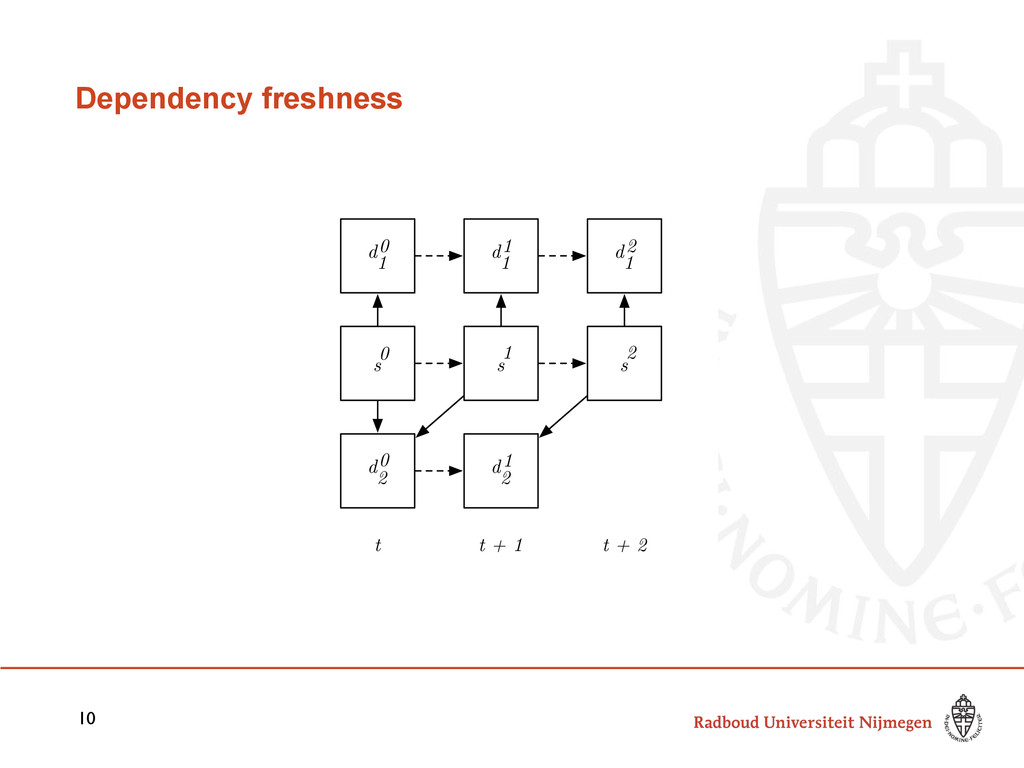
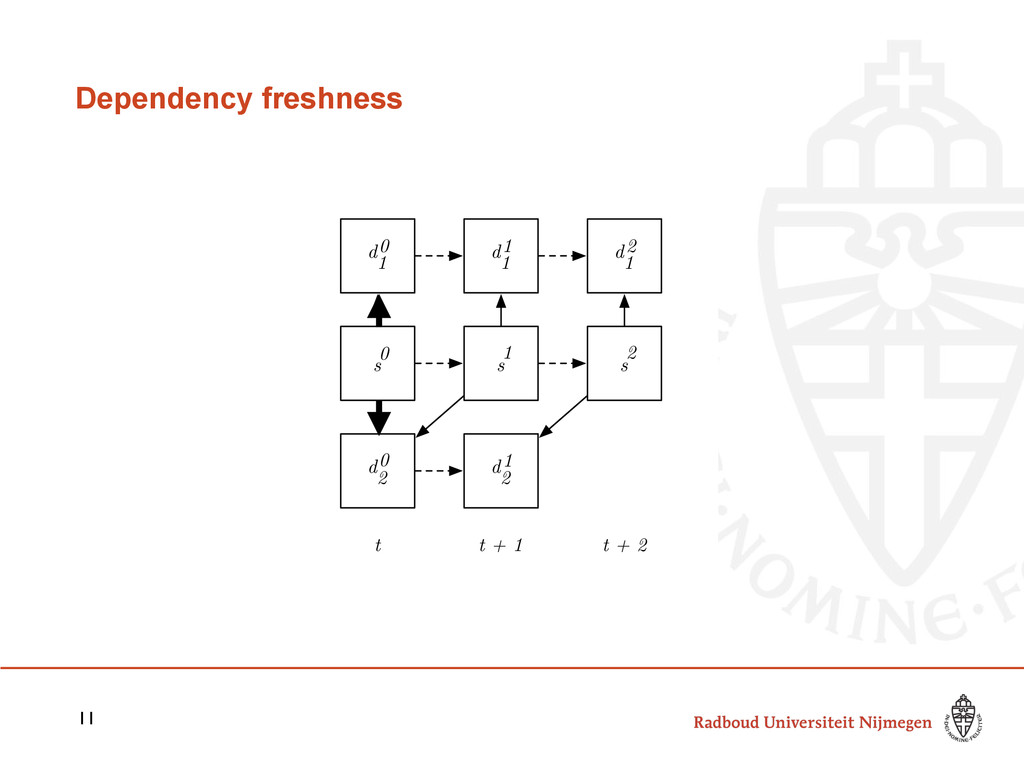
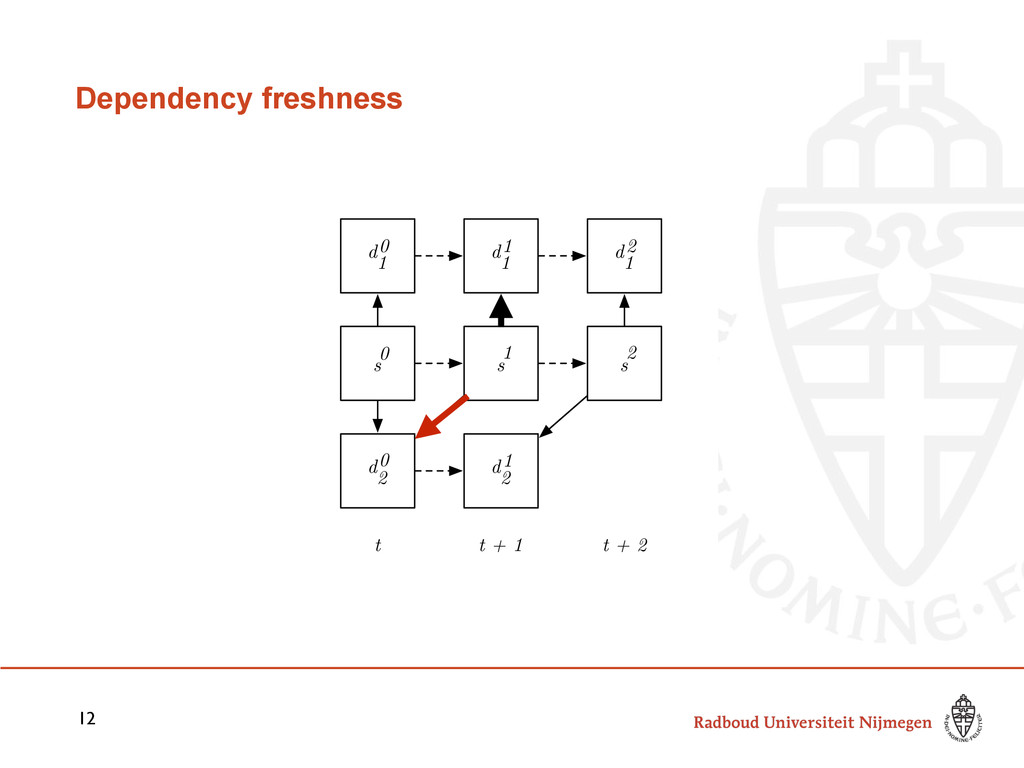
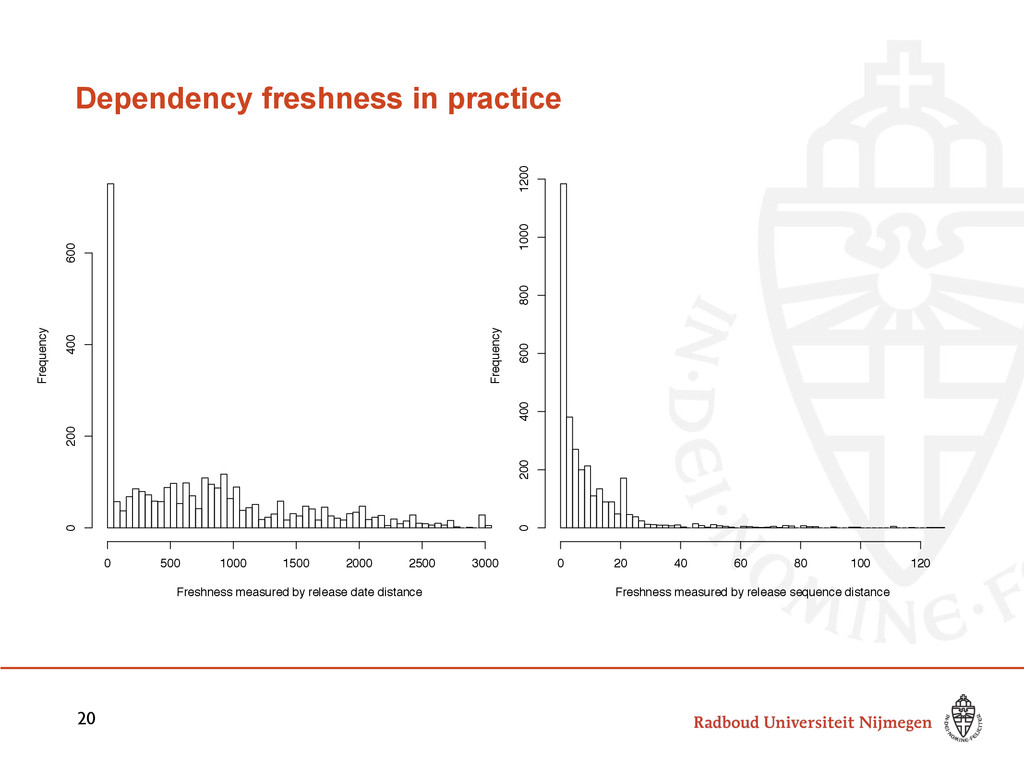
In practice, prioritizing these updates is difficult because the use of outdated dependencies is often opaque. In this paper we aim to make this concept more transparent by introducing metrics to quantify the use of recent versions of dependencies, i.e. the system’s "dependency freshness".

Presented at the 37th International Conference on Software Engineering (ICSE 2015), Florence.

More from me about business and technology.

Joël Cox

May 21, 2015
Tweet

More Decks by Joël Cox

Other Decks in Research

Transcript

  1. 2 Outline • Introduction • Dependency freshness at the component-level

    • Dependency freshness at the system-level • Validation • Conclusion
  2. What is dependency freshness? • Dependency: third-party (Java) software components

    • Actual used version vs. ideal version of a dependency 3
  3. Why is dependency freshness relevant? • Security • Flexibility •

    Stability • Compatibility 4 Why is dependency freshness hard? • Big testing efforts • Different priorities • Implicit dependencies
  4. Research questions • RQ1 How can we measure the dependency

    freshness of a single dependency? • RQ2 How can we measure the dependency freshness of a system as a whole? • Goal To quantify the dependency freshness of a given software system from the point of view of external quality evaluators. 7
  5. Dependency freshness 10 t t + 1 t + 2

    s s s d 1 d 1 d 1 d 2 d 2 1 1 1 2 2 depends on succeeded by 0 0 0
  6. Dependency freshness 11 t t + 1 t + 2

    s s s d 1 d 1 d 1 d 2 d 2 1 1 1 2 2 depends on succeeded by 0 0 0
  7. Dependency freshness 12 t t + 1 t + 2

    s s s d 1 d 1 d 1 d 2 d 2 1 1 1 2 2 depends on succeeded by 0 0 0
  8. Dependency freshness 13 t t + 1 t + 2

    s s s d 1 d 1 d 1 d 2 d 2 1 1 1 2 2 depends on succeeded by 0 0 0
  9. What makes a good metric given our research context? •

    Technology independent • Ease of implementation • Simple to understand • Enable root-cause analysis 14
  10. Metric overview 18 Version sequence number Version release date Version

    number delta Technology independent + + - Ease of implementation + + + Simple to understand + + - Enable root-cause analysis + + +
  11. Datasets 19 Industry systems repository Maven components repository Available dependencies

    Used dependencies Tooling Rating Thresholds 75 systems, 30 clients 3107 dependencies, 8718 versions 23431 additional dependencies 75% release date hit rate
  12. Dependency freshness in practice 20 Freshness measured by release date

    distance Frequency 0 500 1000 1500 2000 2500 3000 0 200 400 600 Freshness measured by release sequence distance Frequency 0 20 40 60 80 100 120 0 200 400 600 800 1000 1200
  13. • What is good dependency management? • Use a benchmark

    approach to compare systems. Normative vs. descriptive 22
  14. Defining a system-level measurement 23 {6, 21, 8, 11, 7,

    31, 17, 3} Component-level measurements Risk profile Star rating Alves, et. al. Deriving metric thresholds from benchmark data. ICSM 2010 
 Alves, et. al. Benchmark-based aggregation of metrics to ratings. IWSM-MENSURA 2011
  15. Three different studies 1. Reported security vulnerabilities in dependencies 2.

    Interviews with practitioners 3. Longitudinal analysis 25
  16. 1. Reported security vulnerabilities 26 • 0 1 2 3

    4 1 2 3 4 5 Number of dependencies with reported vulnerability Dependency freshness rating 0.0 0.2 0.4 0.6 1 2 3 4 5 Dependency freshness rating Density Vulnerable FALSE TRUE
  17. 2. Interviews 27 Qualitative results • High usefulness
 All interviewees

    considered the metric useful when assessing systems • High reliability
 All interviewees were able top predict the rating ±1 star • High actionability
 Most interviewees would follow up on the results with clients Metric ranking System Subject # Rating Rank 1 2 3 4 5 1108 5.053 5 5 5 5 5 5 1994 4.105 4 4 2 4 4 4 850 3.248 3 3 3 3 3 3 362 2.188 2 2 4 2 2 2 181 1.427 1 1 1 1 1 1
  18. 3. Longitudinal analysis (1) 28 1 2 3 4 5

    2010 2011 2012 2013 2014 Time Dependency freshness rating
  19. 3. Longitudinal analysis (2) 29 1 2 3 4 5

    2010 2011 2012 2013 2014 Time Dependency freshness rating
  20. 3. Longitudinal analysis (3) 30 1 2 3 4 5

    2010 2011 2012 2013 2014 Time Dependency freshness rating
  21. 3. Longitudinal analysis (4) 31 1 2 3 4 5

    2010 2011 2012 2013 2014 Time Dependency freshness rating
  22. Summary • Serves as an indicator for security • Metric

    is considered useful in practice • Allows for monitoring through time 32
  23. Contributions • Component-level metric for dependency freshness • Analysis of

    dependency freshness on industry systems • System-level metric for dependency freshness, that can help stakeholders make decisions about dependency management • Validated for usefulness, reliability and its relation to security 34
  24. In practice • Inspect systems on a case-by-case • Monitor

    systems over a time • Remediate underperforming systems 35