Upgrade to Pro — share decks privately, control downloads, hide ads and more …

How to Use Value Stream Maps to Reinforce Agili...

Sponsored · Your Podcast. Everywhere. Effortlessly. Share. Educate. Inspire. Entertain. You do you. We'll handle the rest.

How to Use Value Stream Maps to Reinforce Agility & Effectiveness

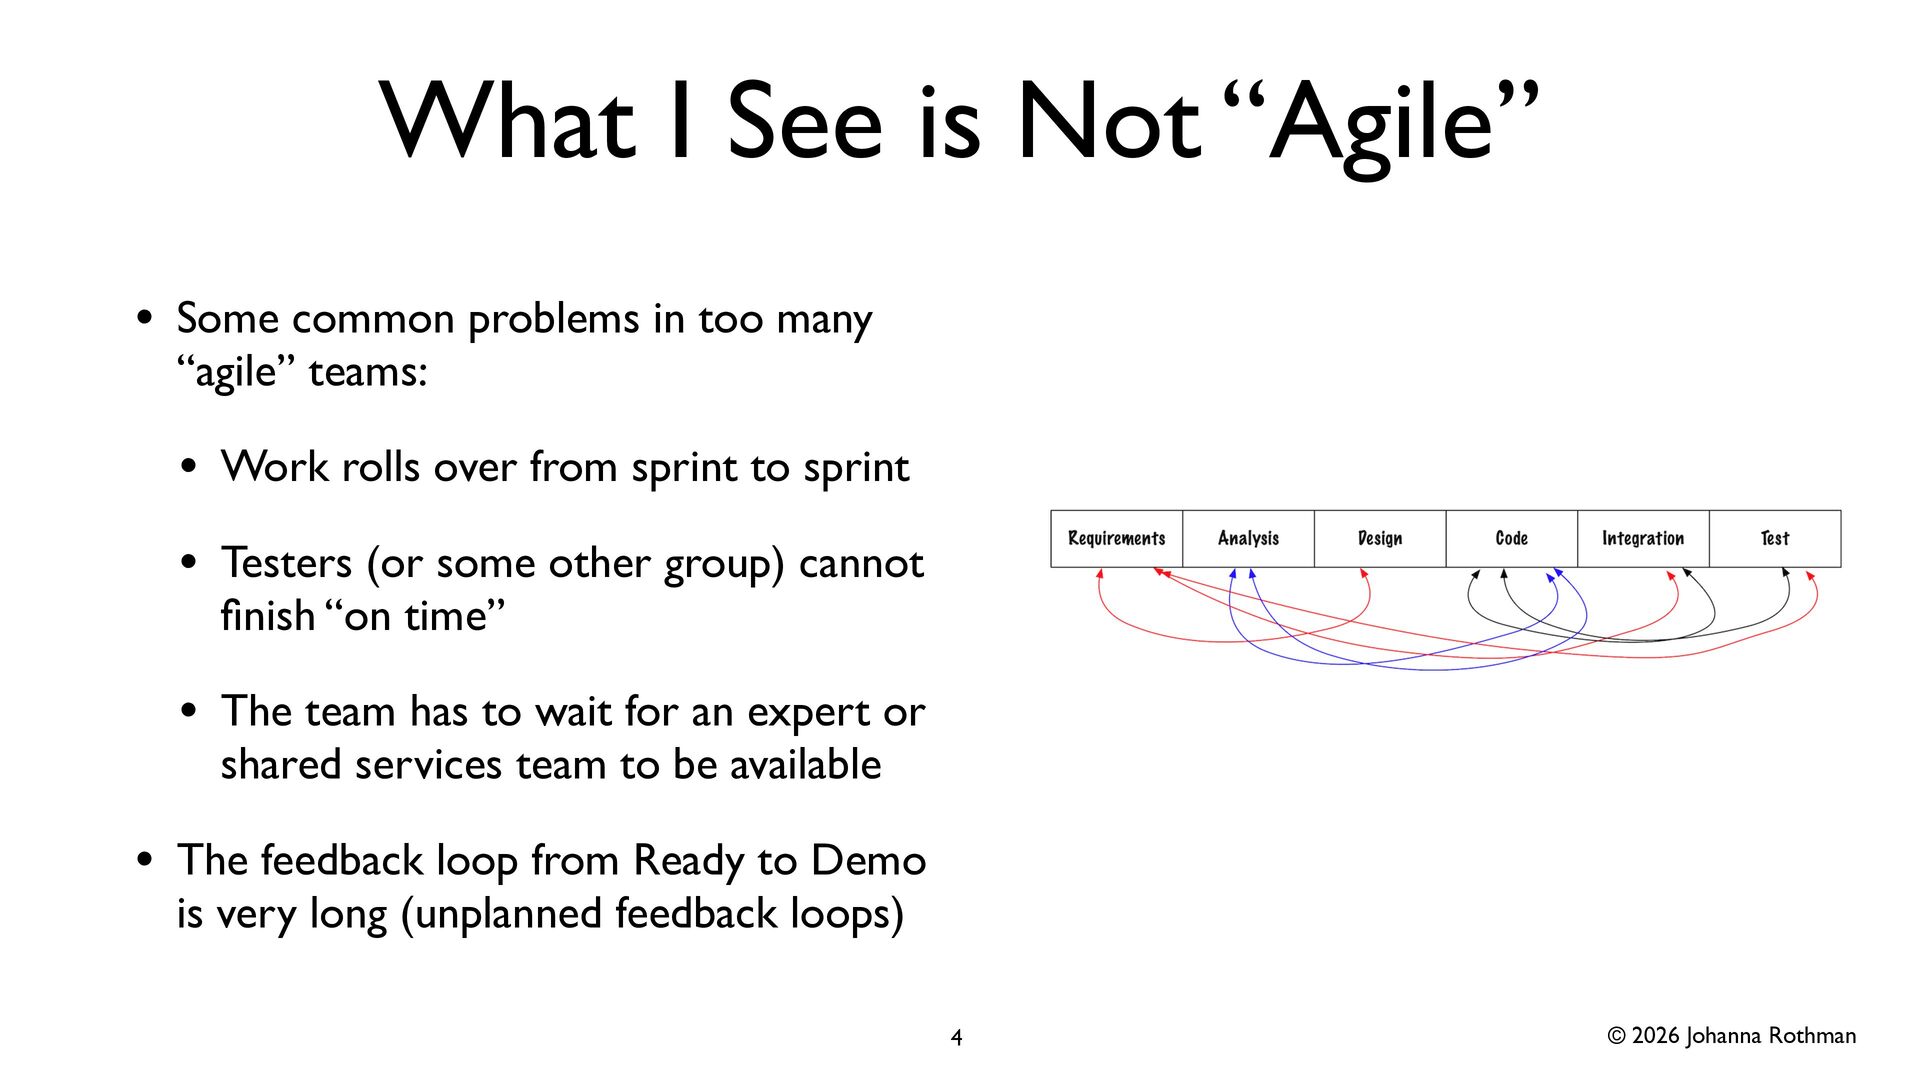
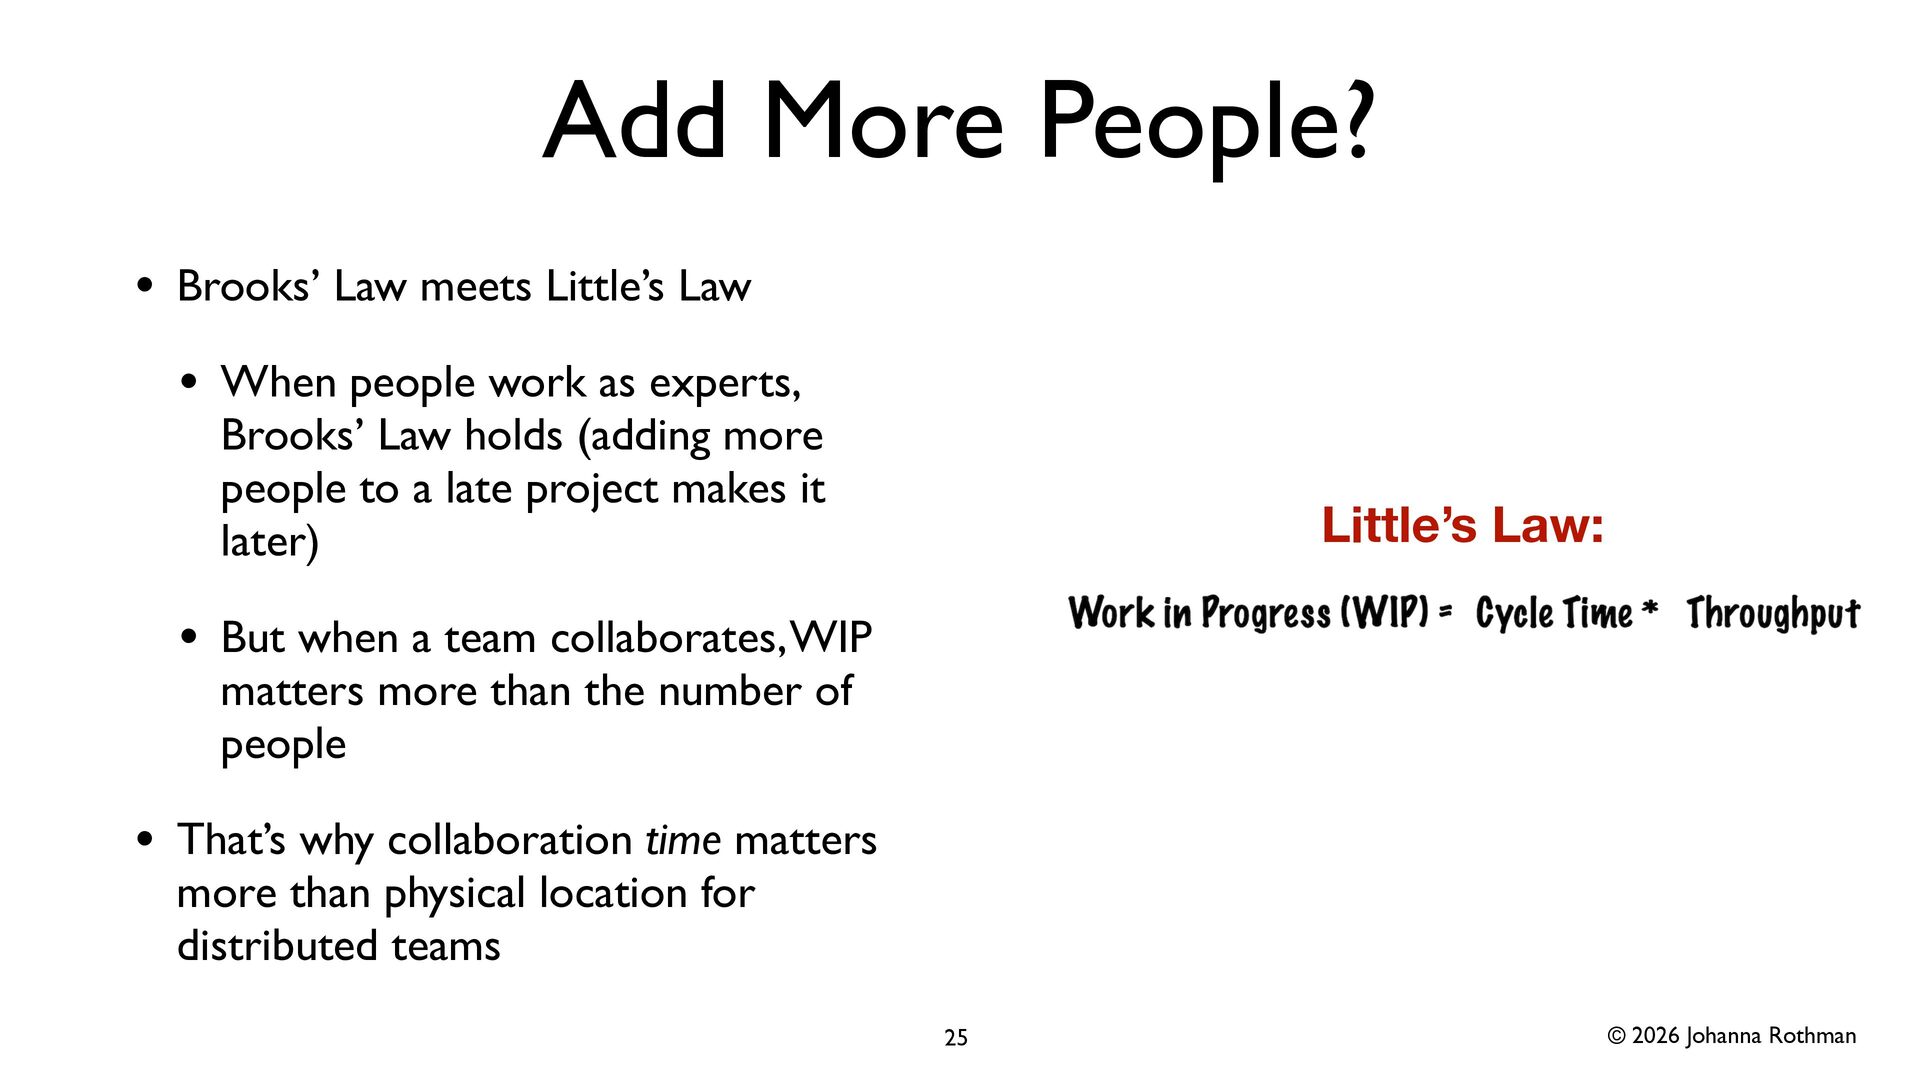
Does your team struggle with finishing work “on time?” Or that work queues up behind a particular person or function? That’s too much WIP (Work in Progress) and can slow a team’s pace to a crawl.

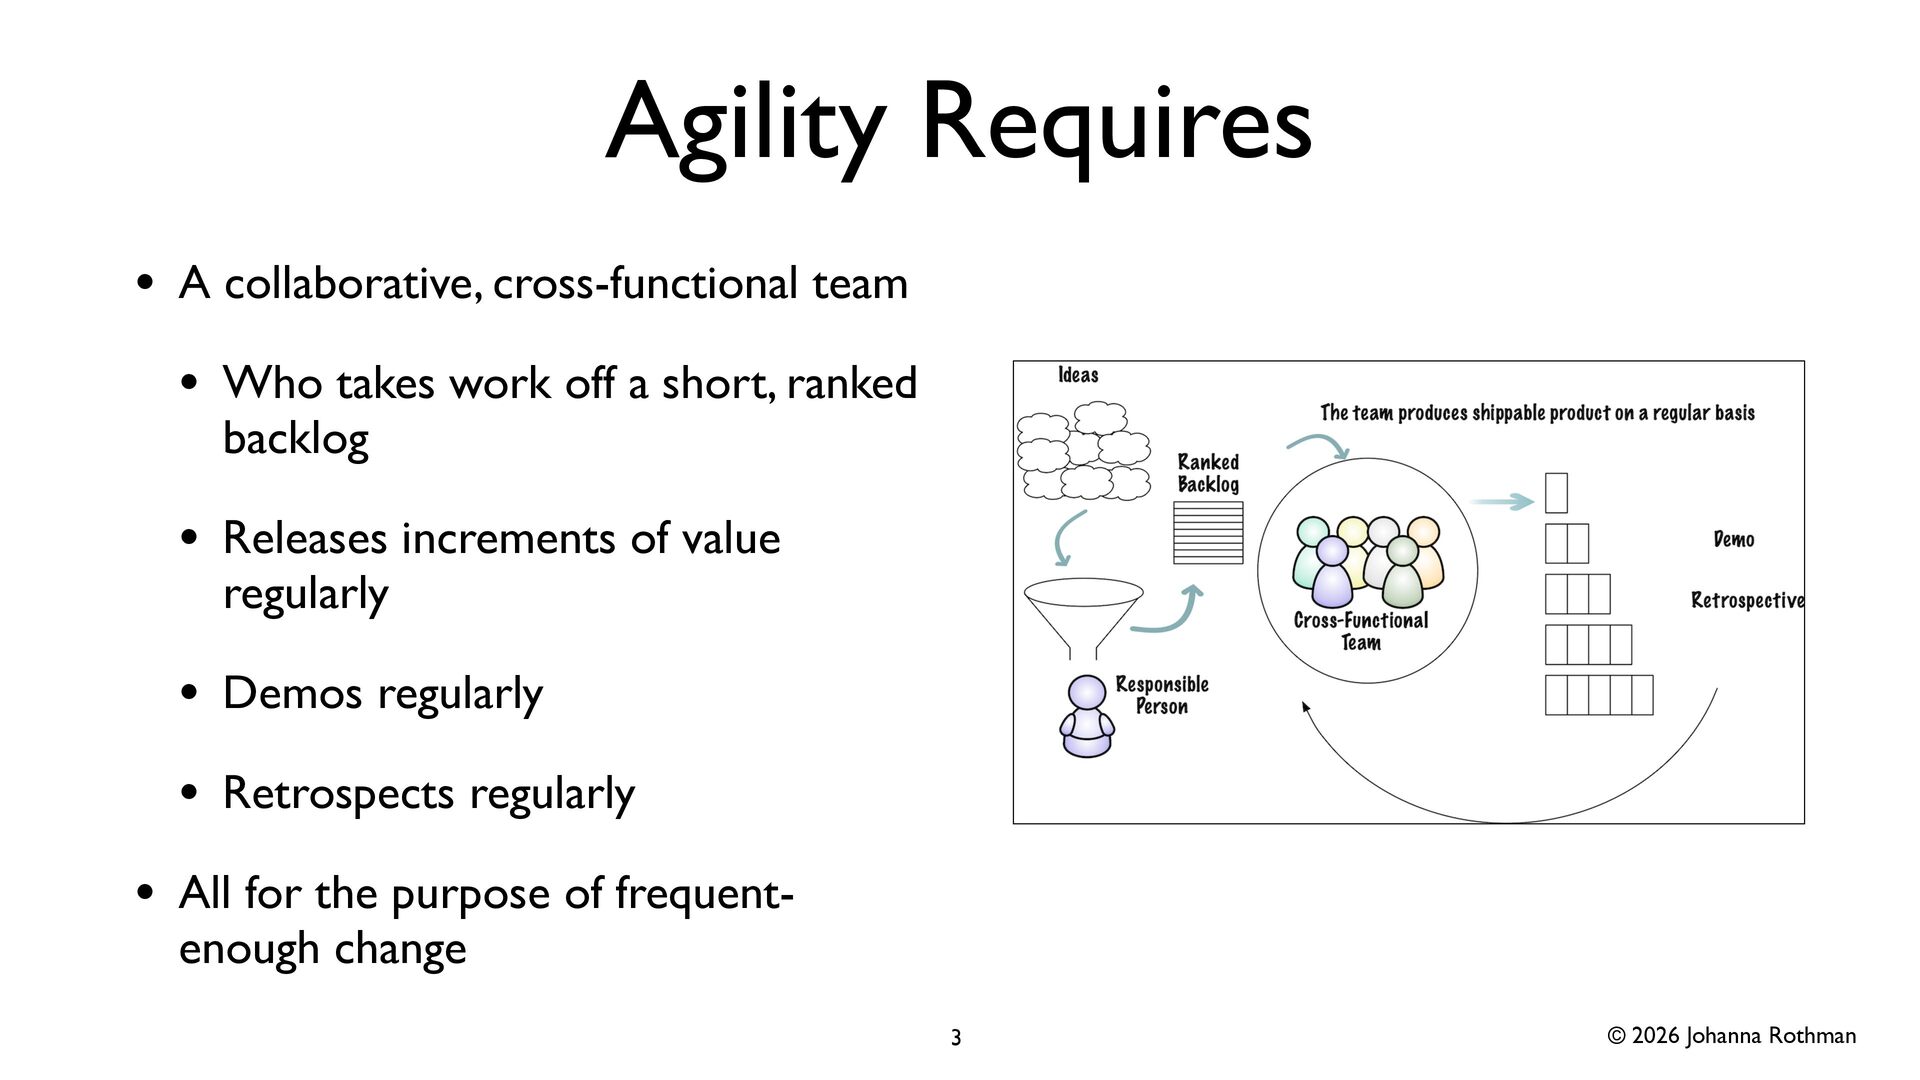
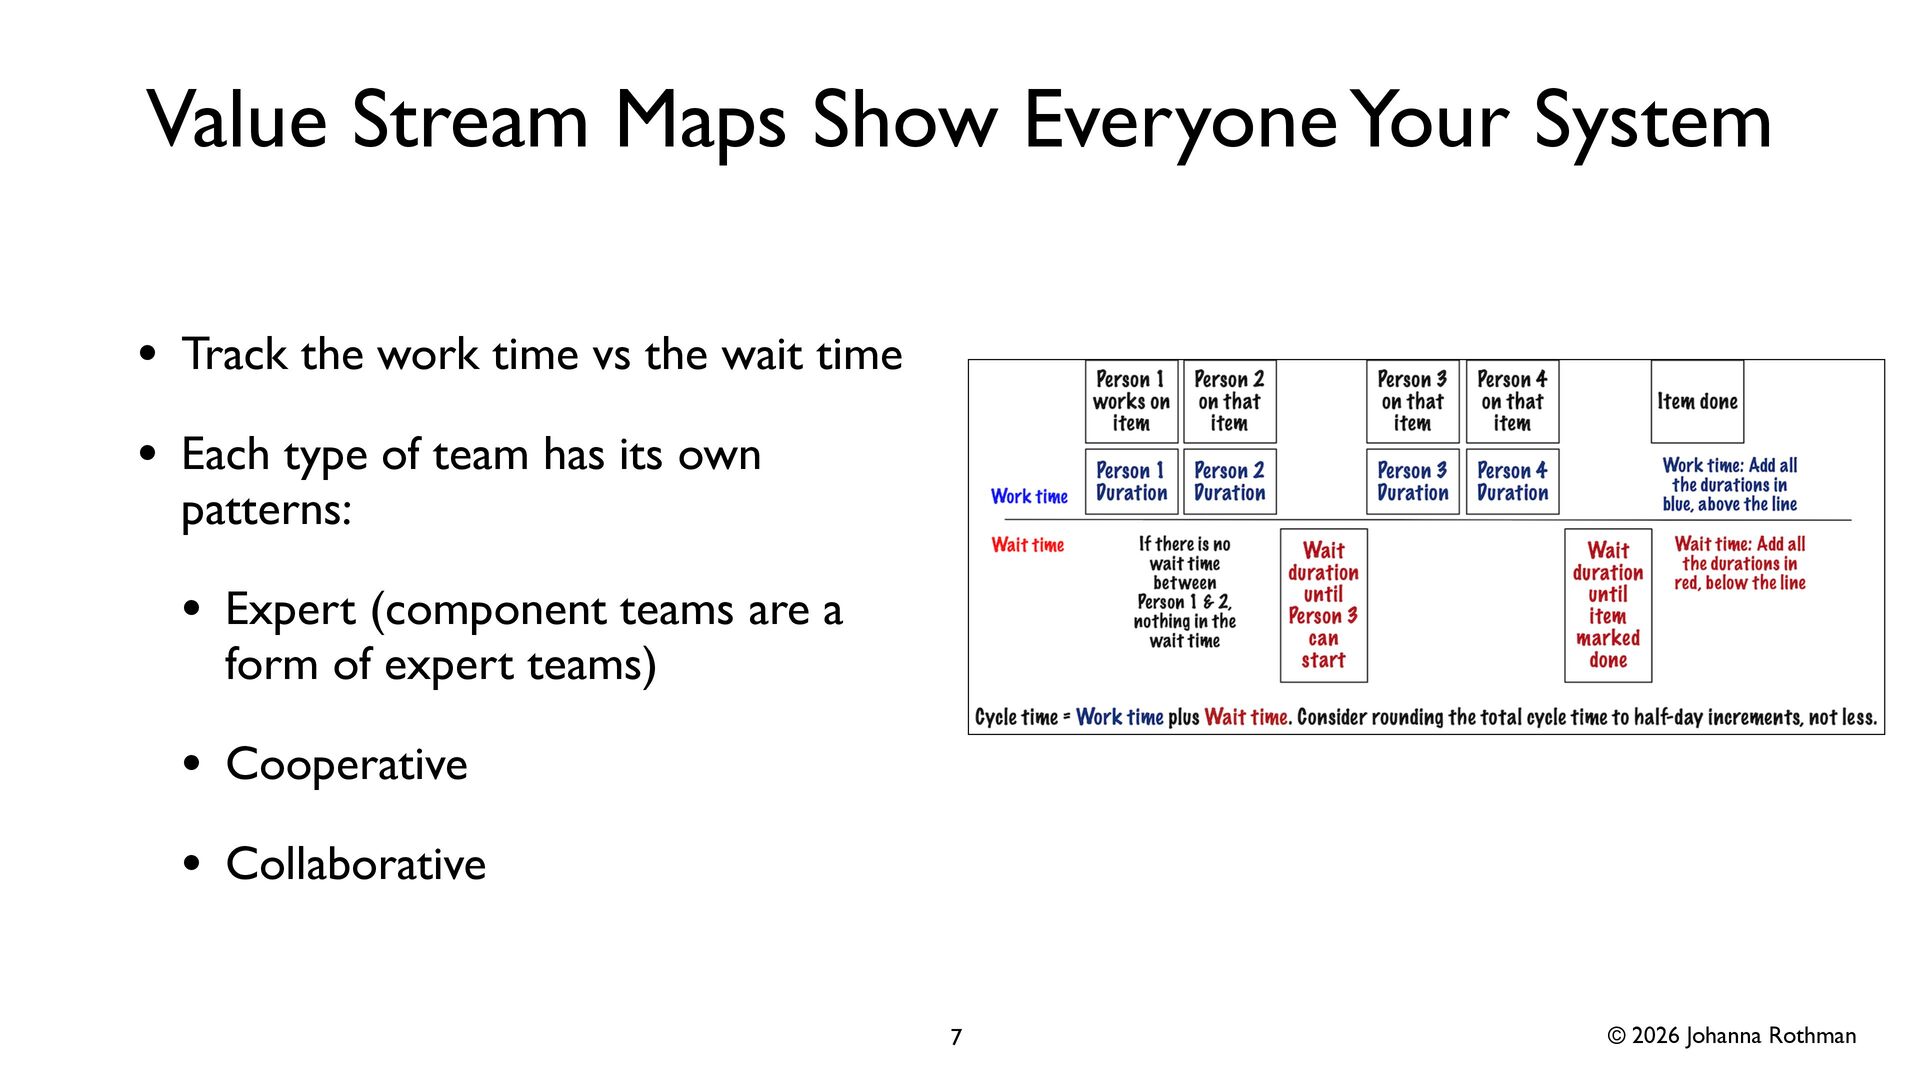
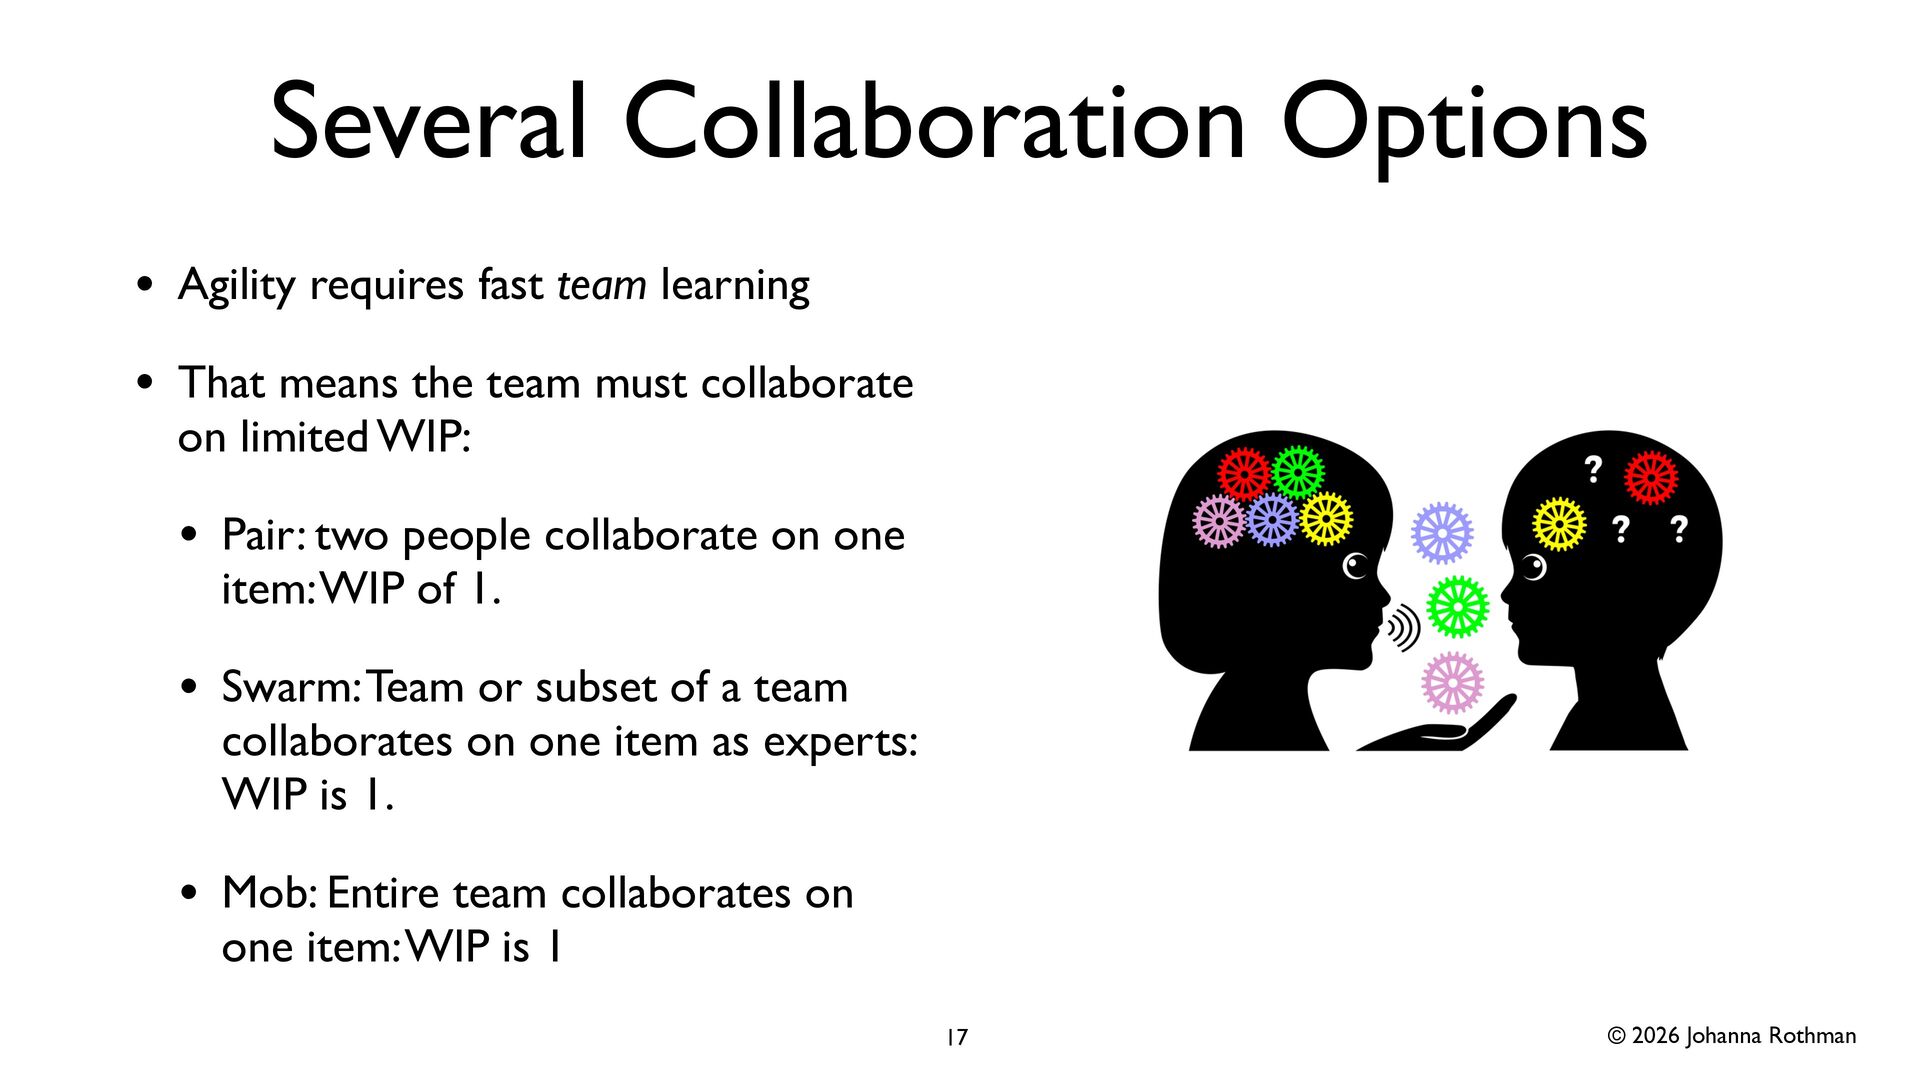
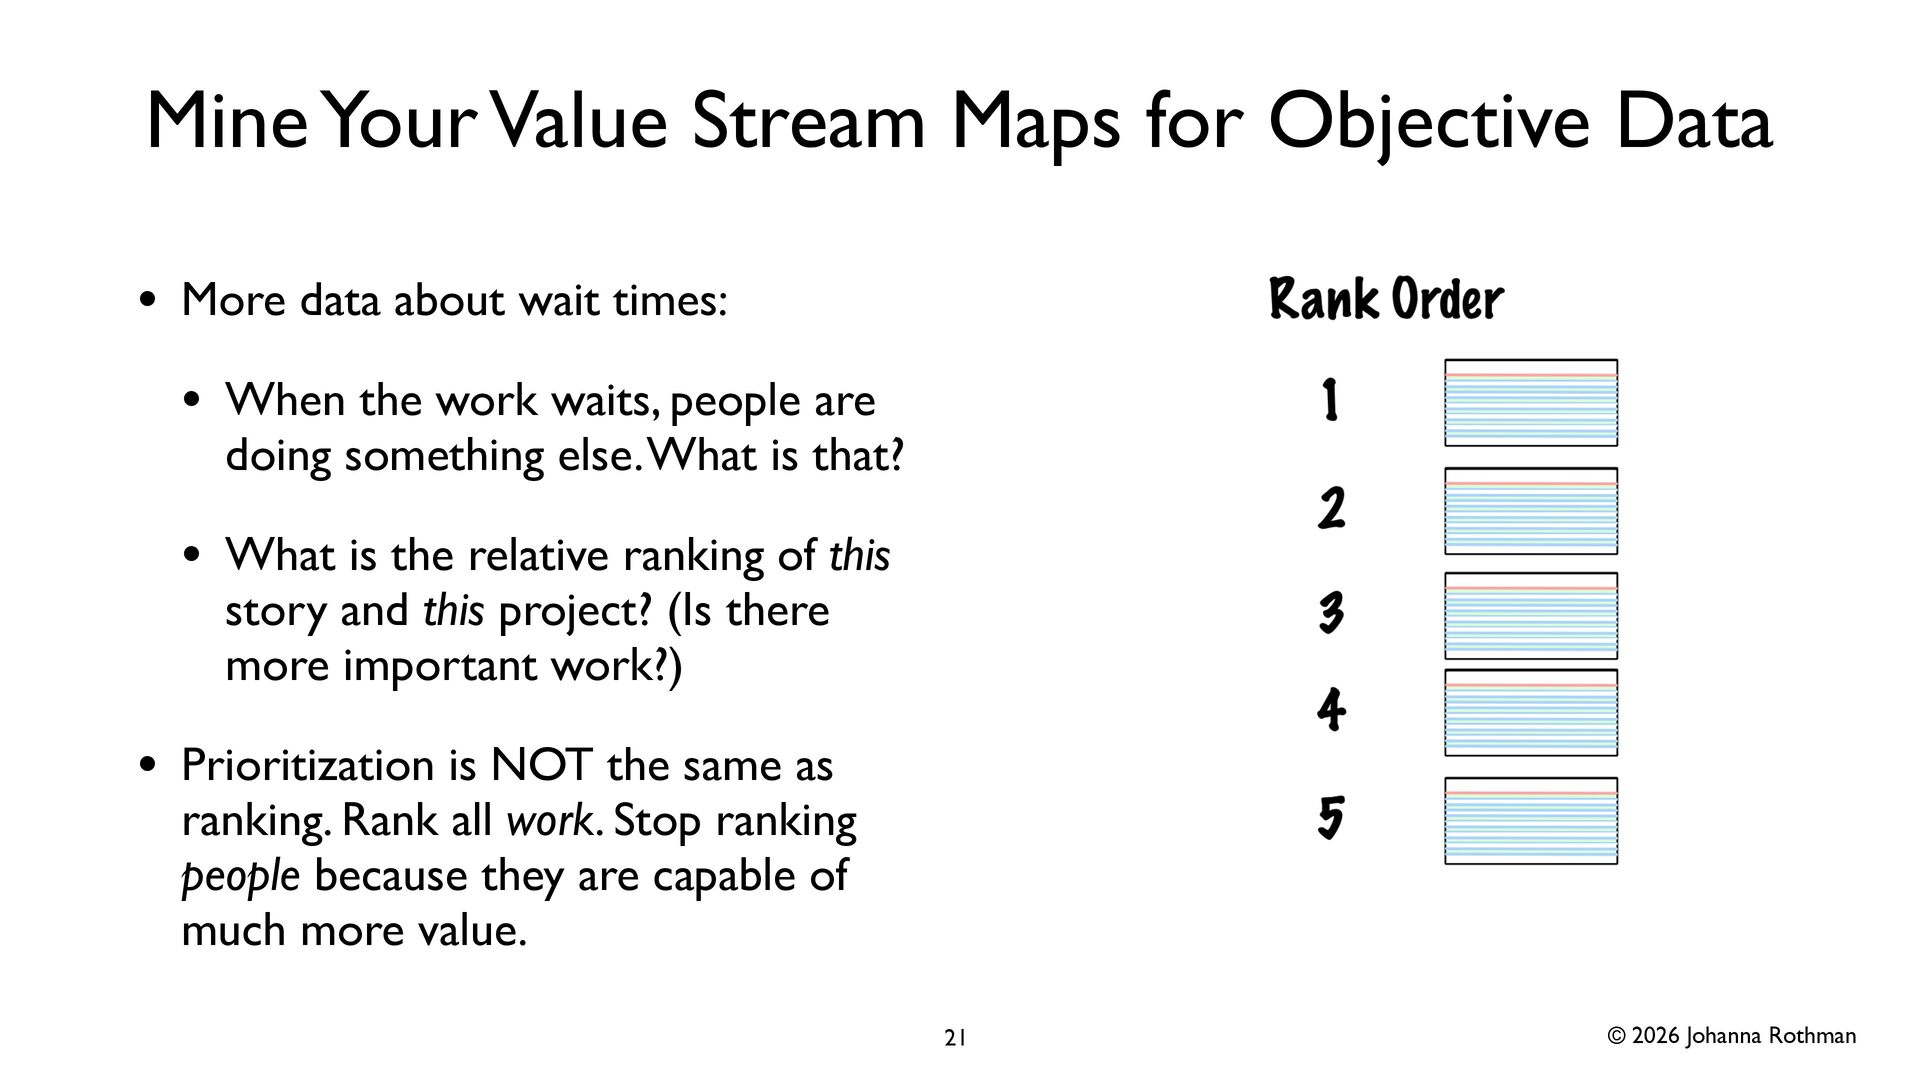
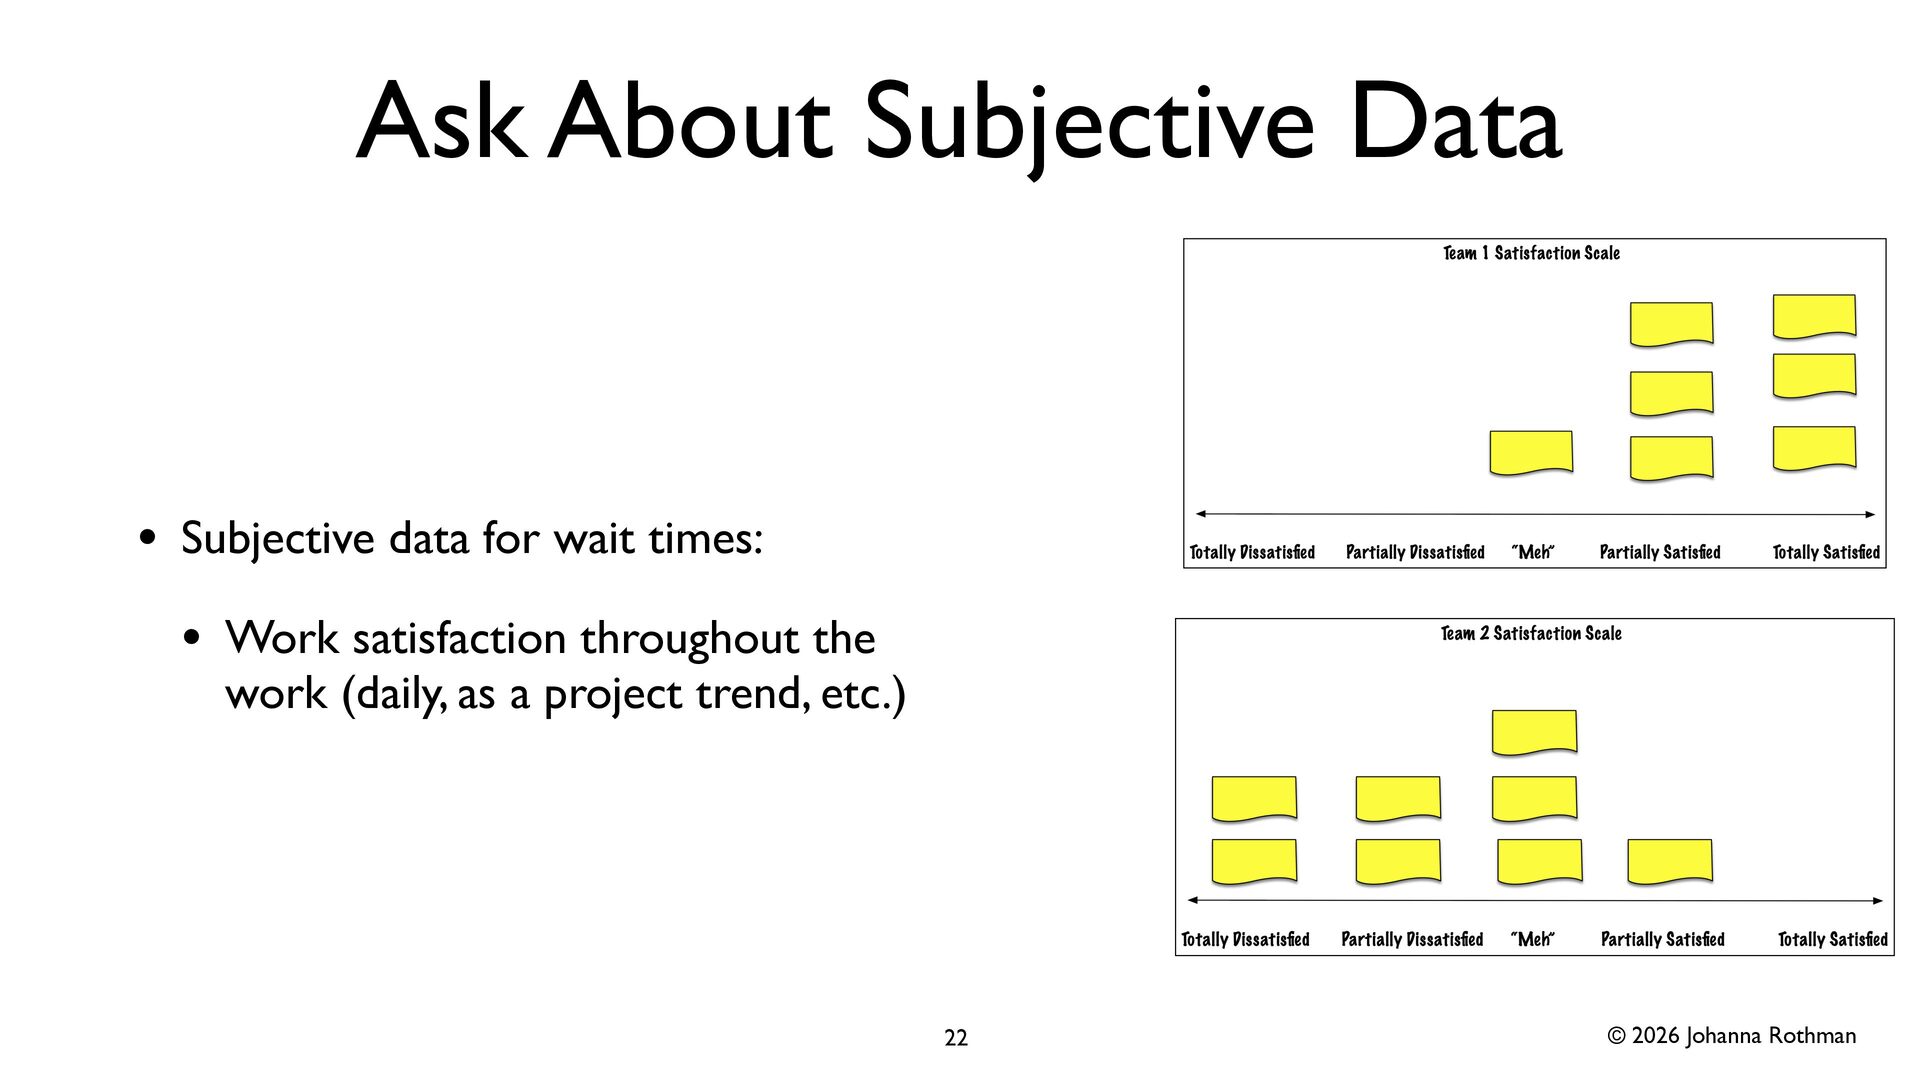
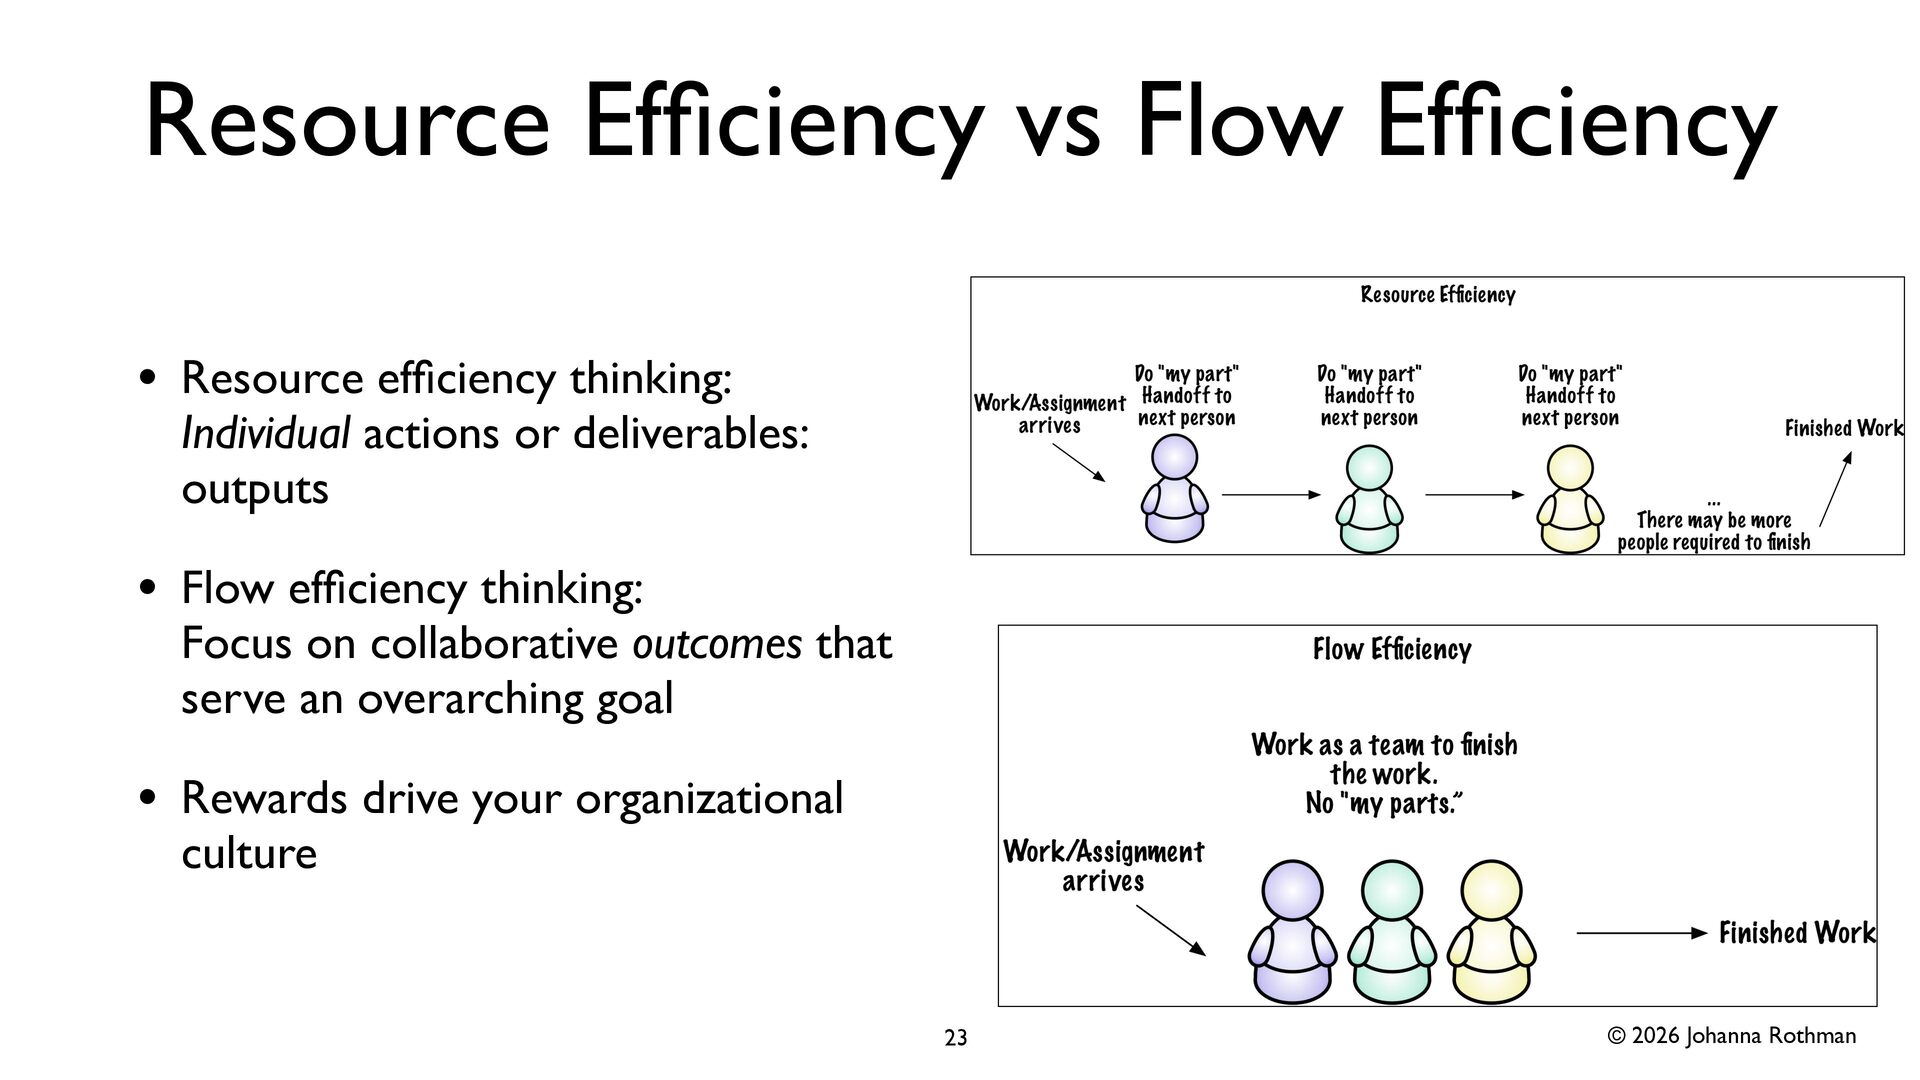
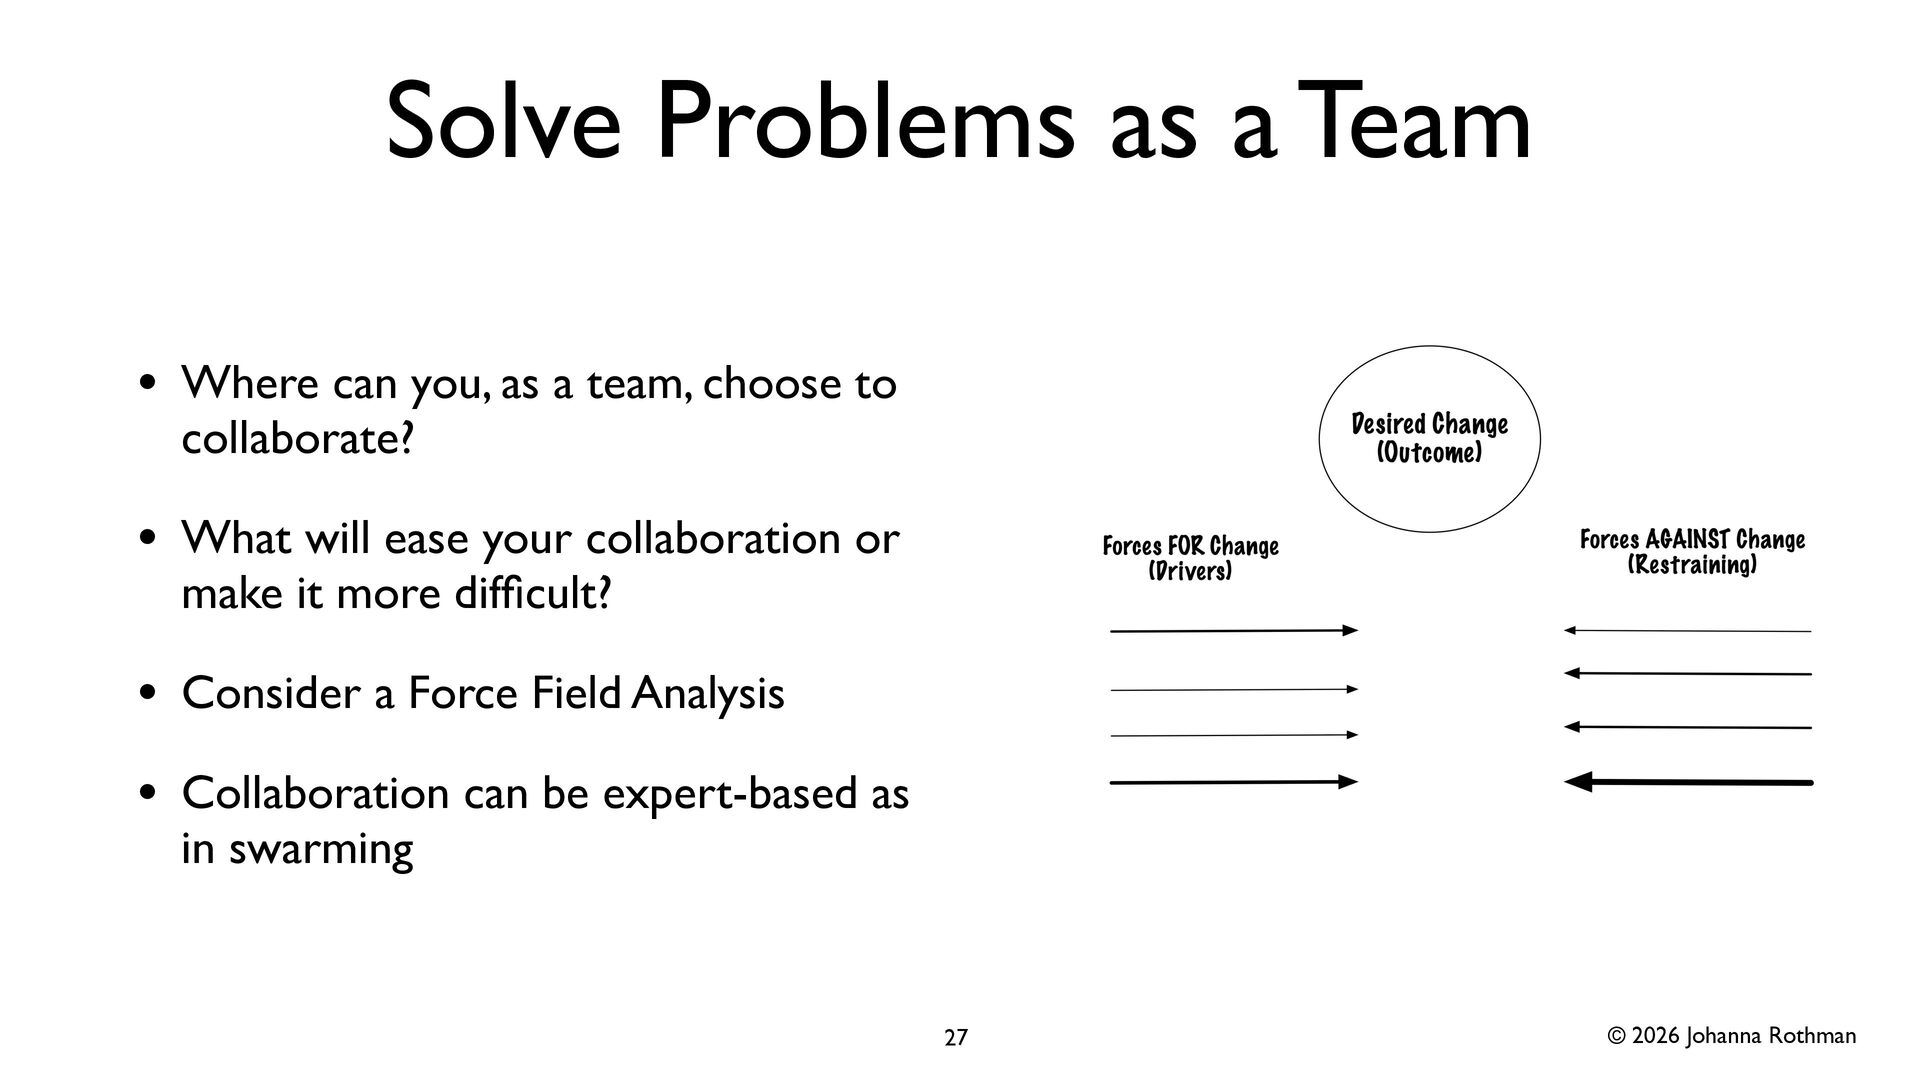
Teams have a powerful tool—the value stream map—to visualize how their work moves through their team and where the work gets stuck. Even better, that visualization helps the team learn how they work. Too many supposedly agile teams actually work as individuals. Some teams cooperate. But the most effective teams collaborate on all their work. They limit their WIP as they release more value frequently.

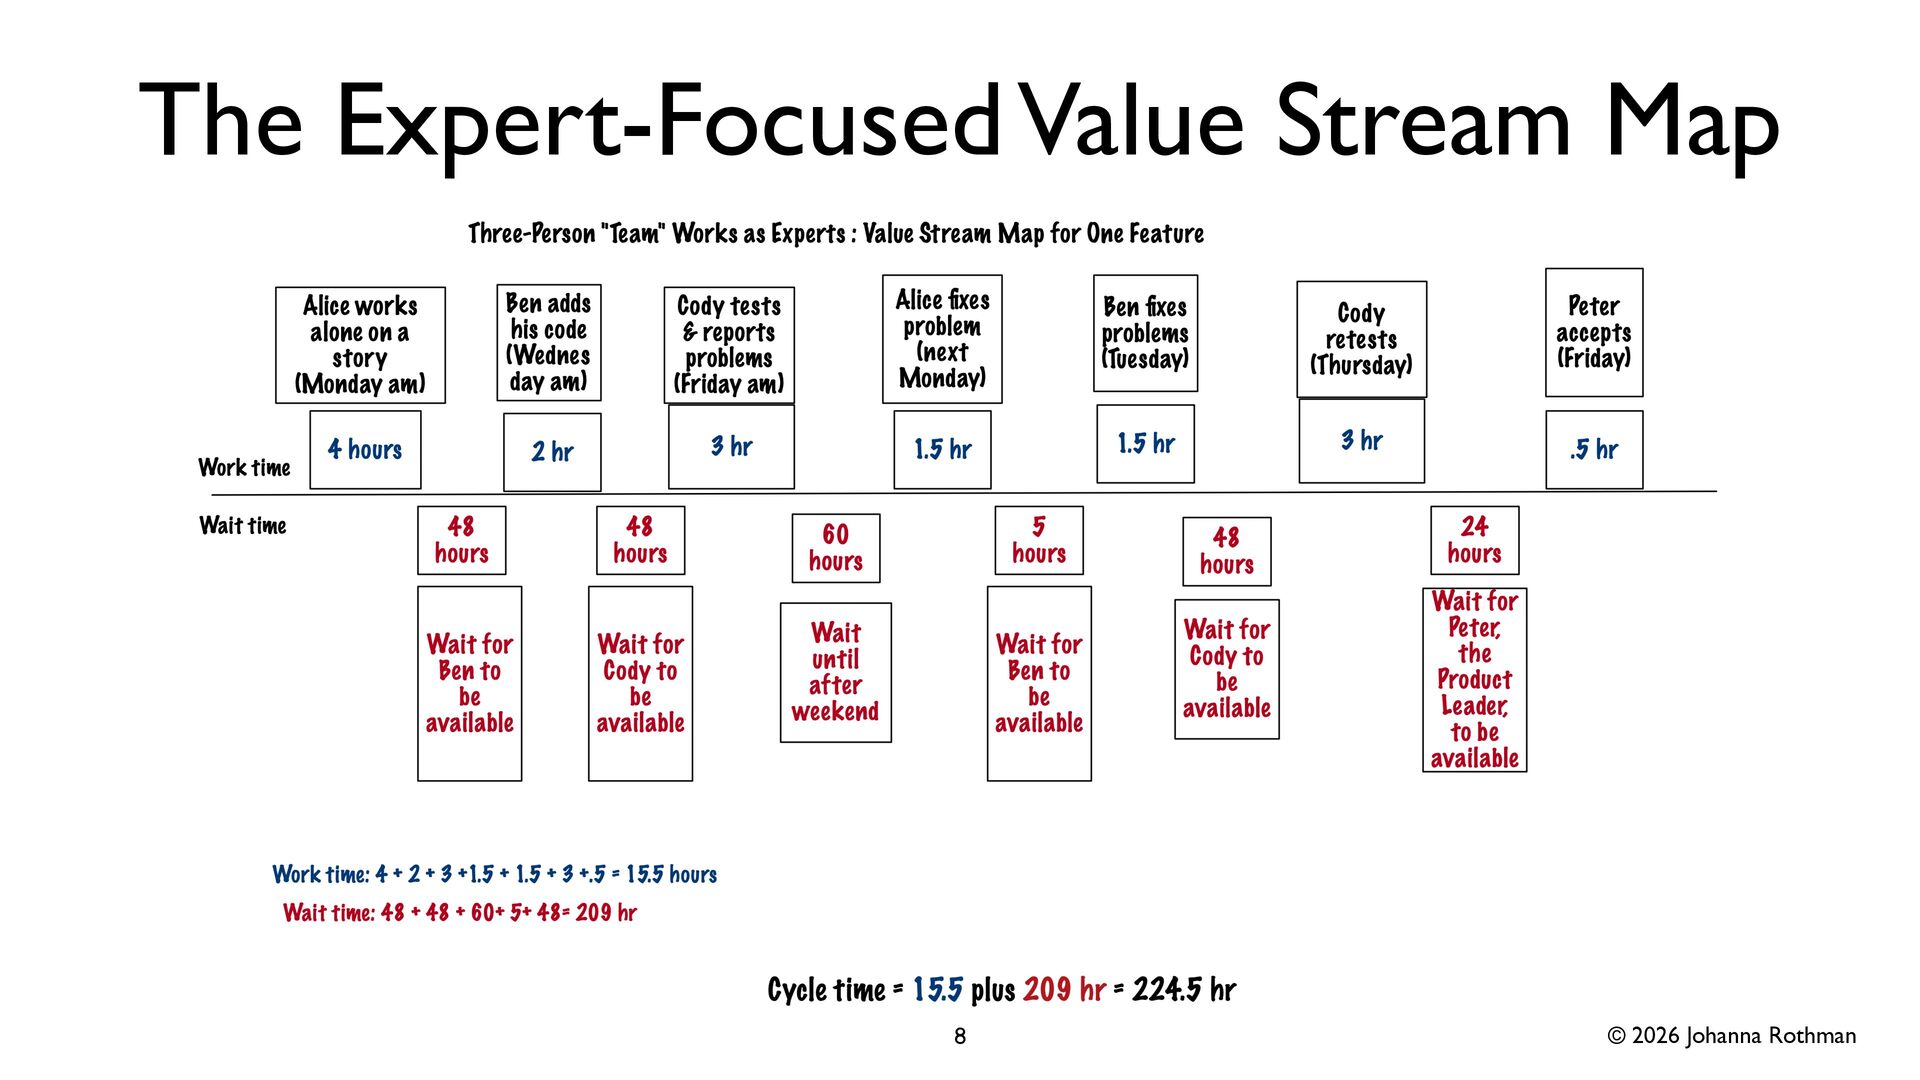
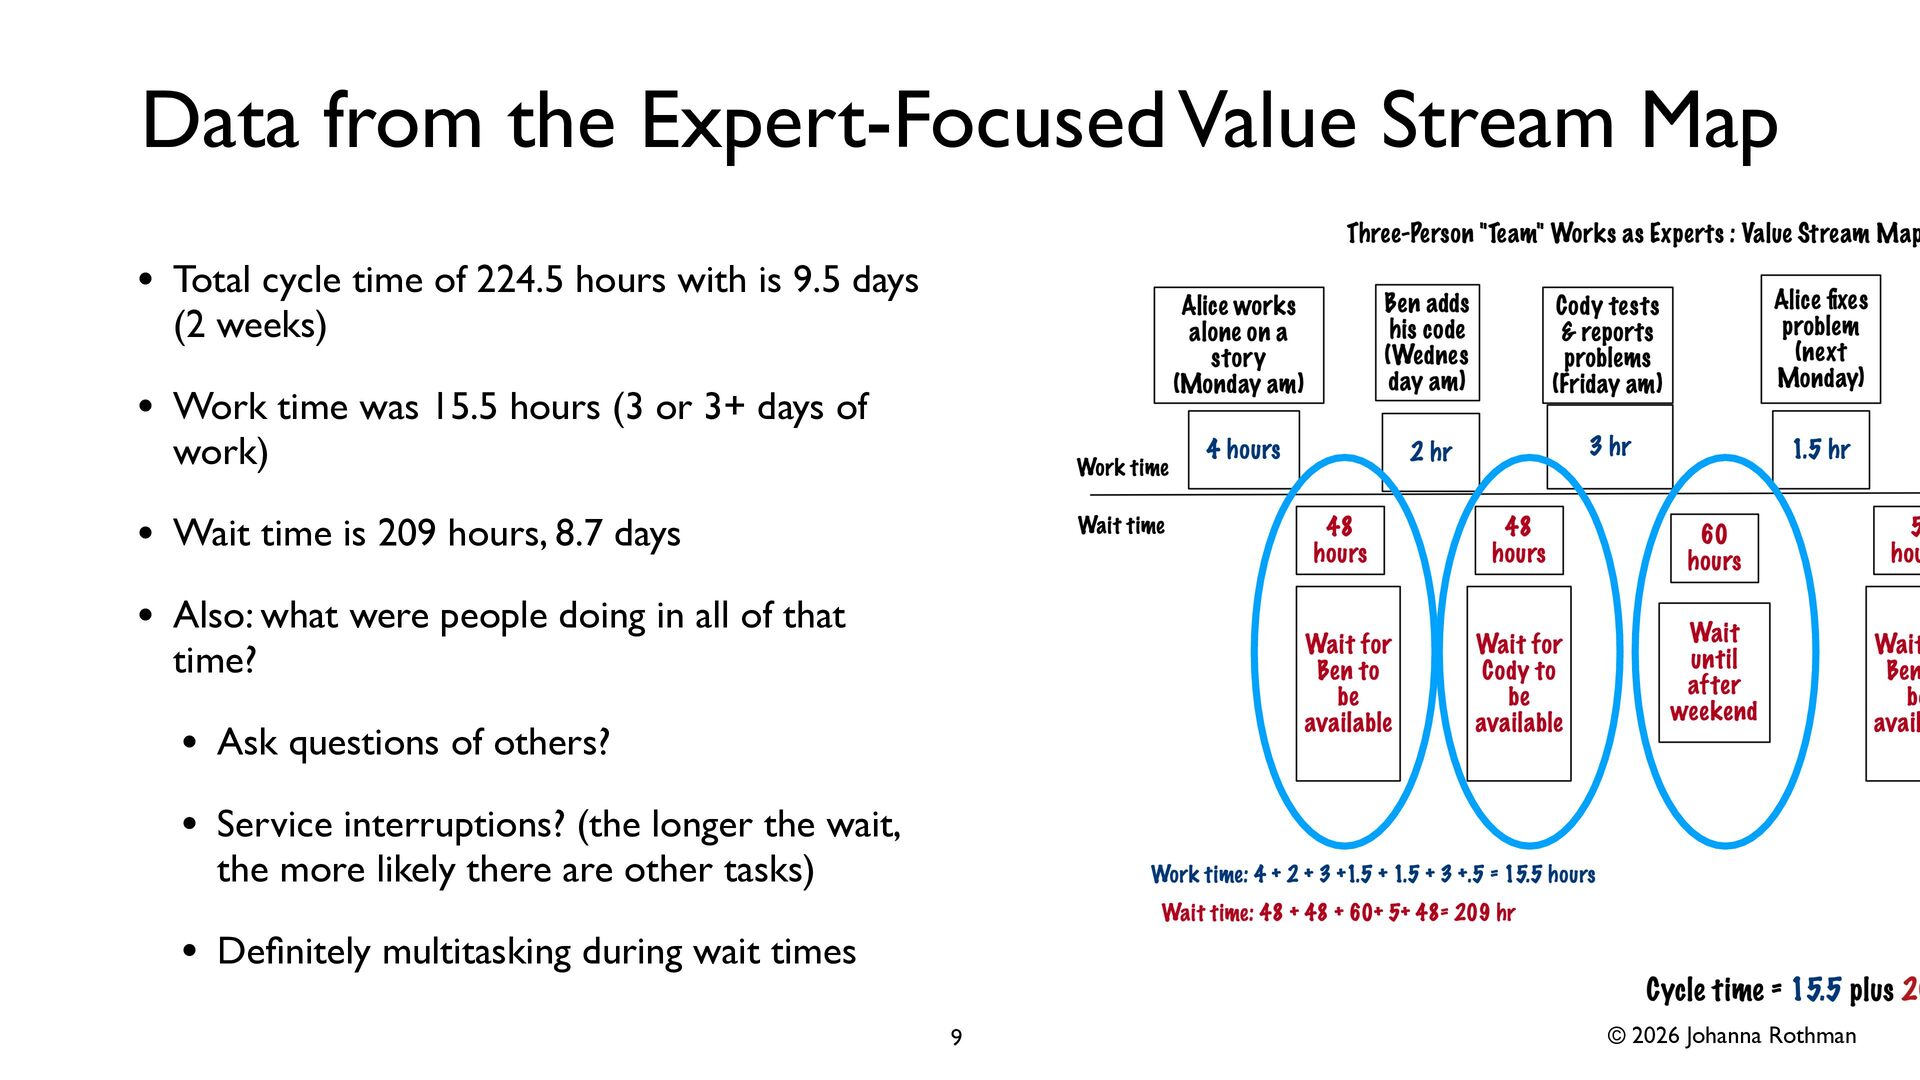
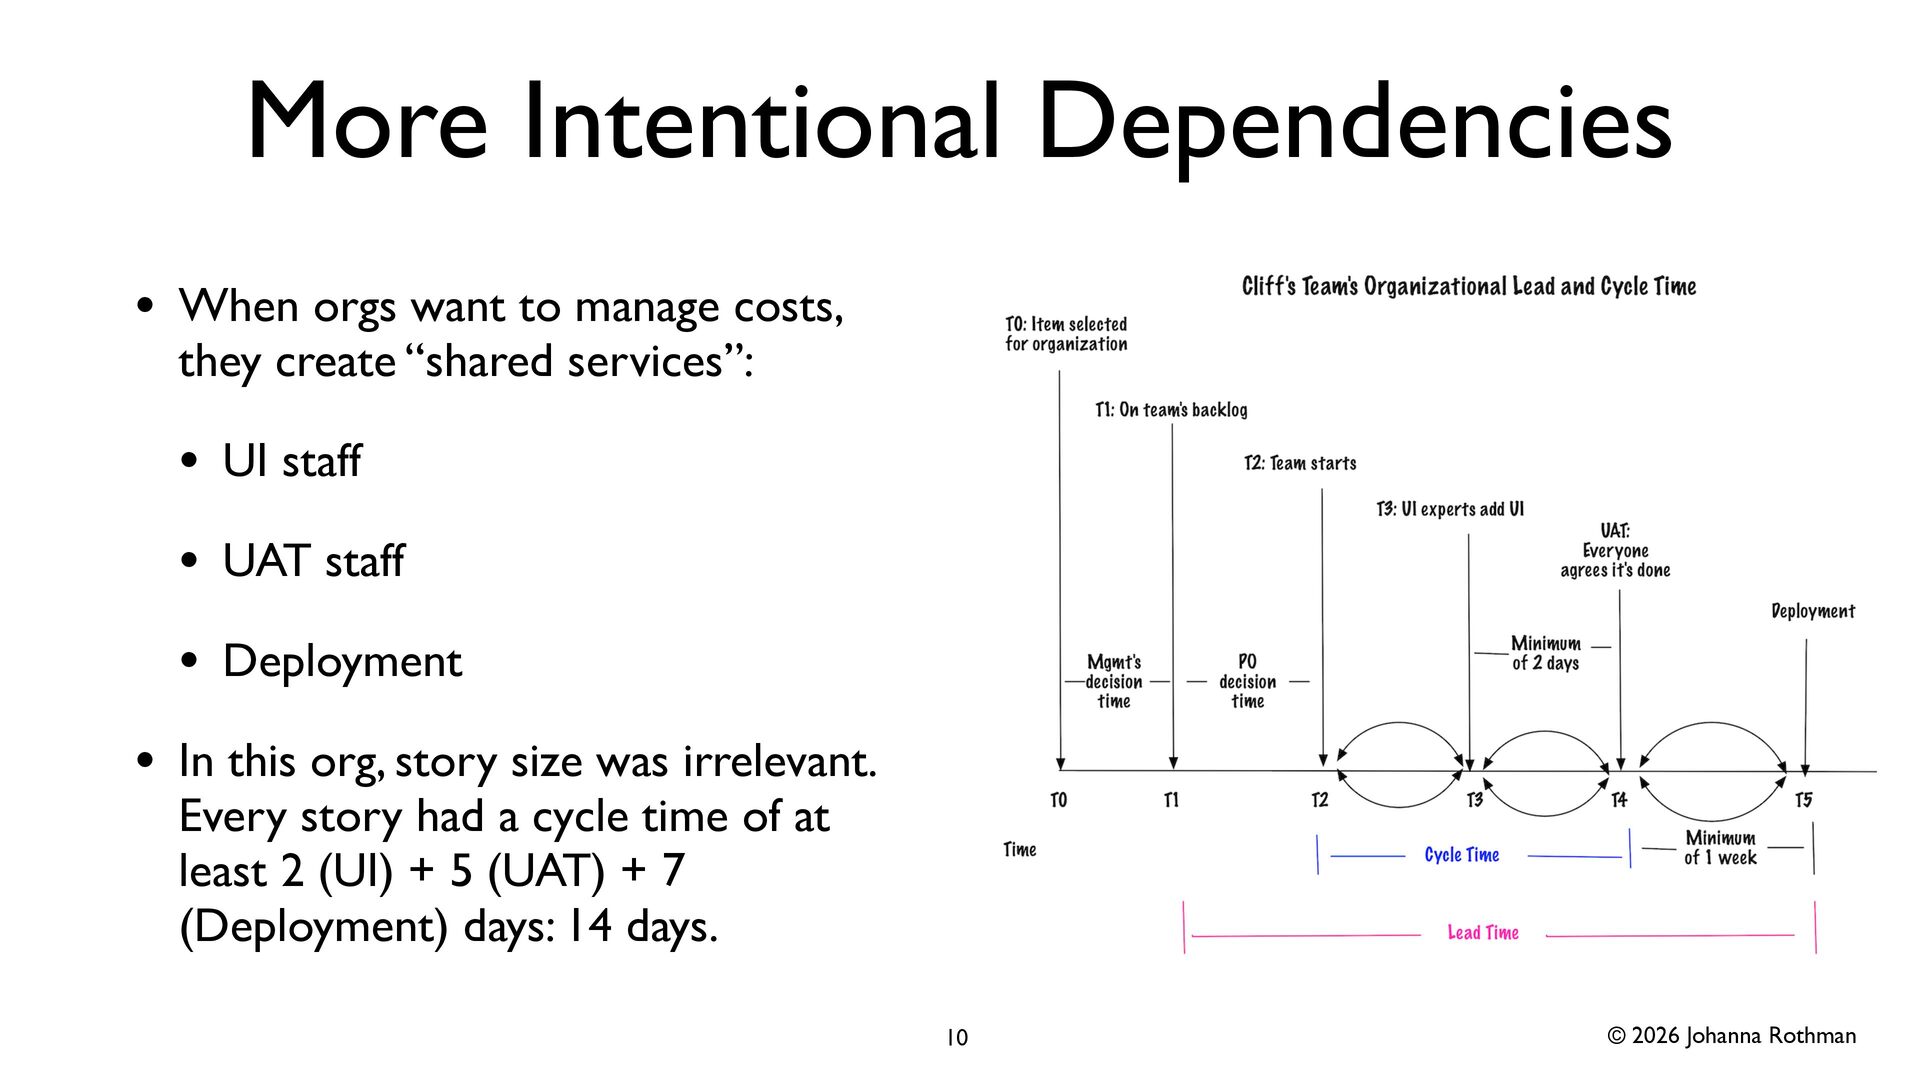
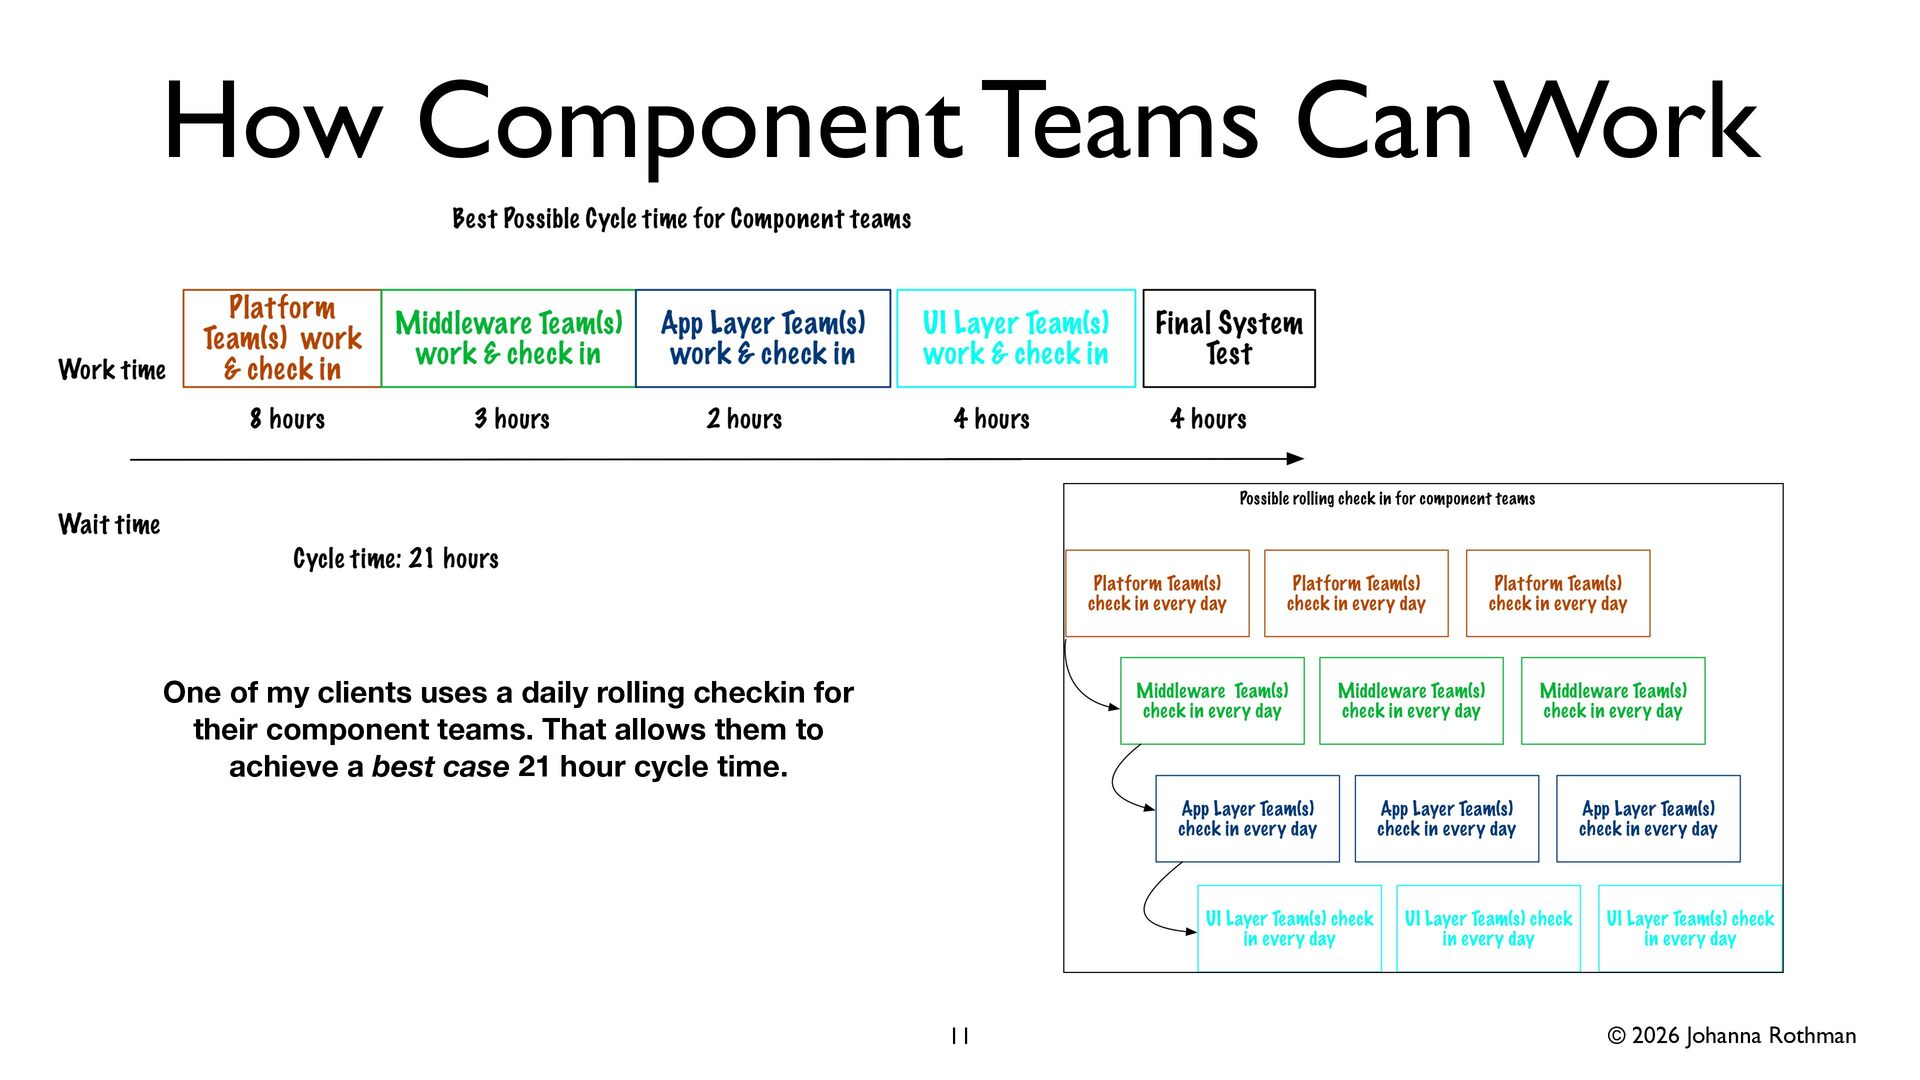
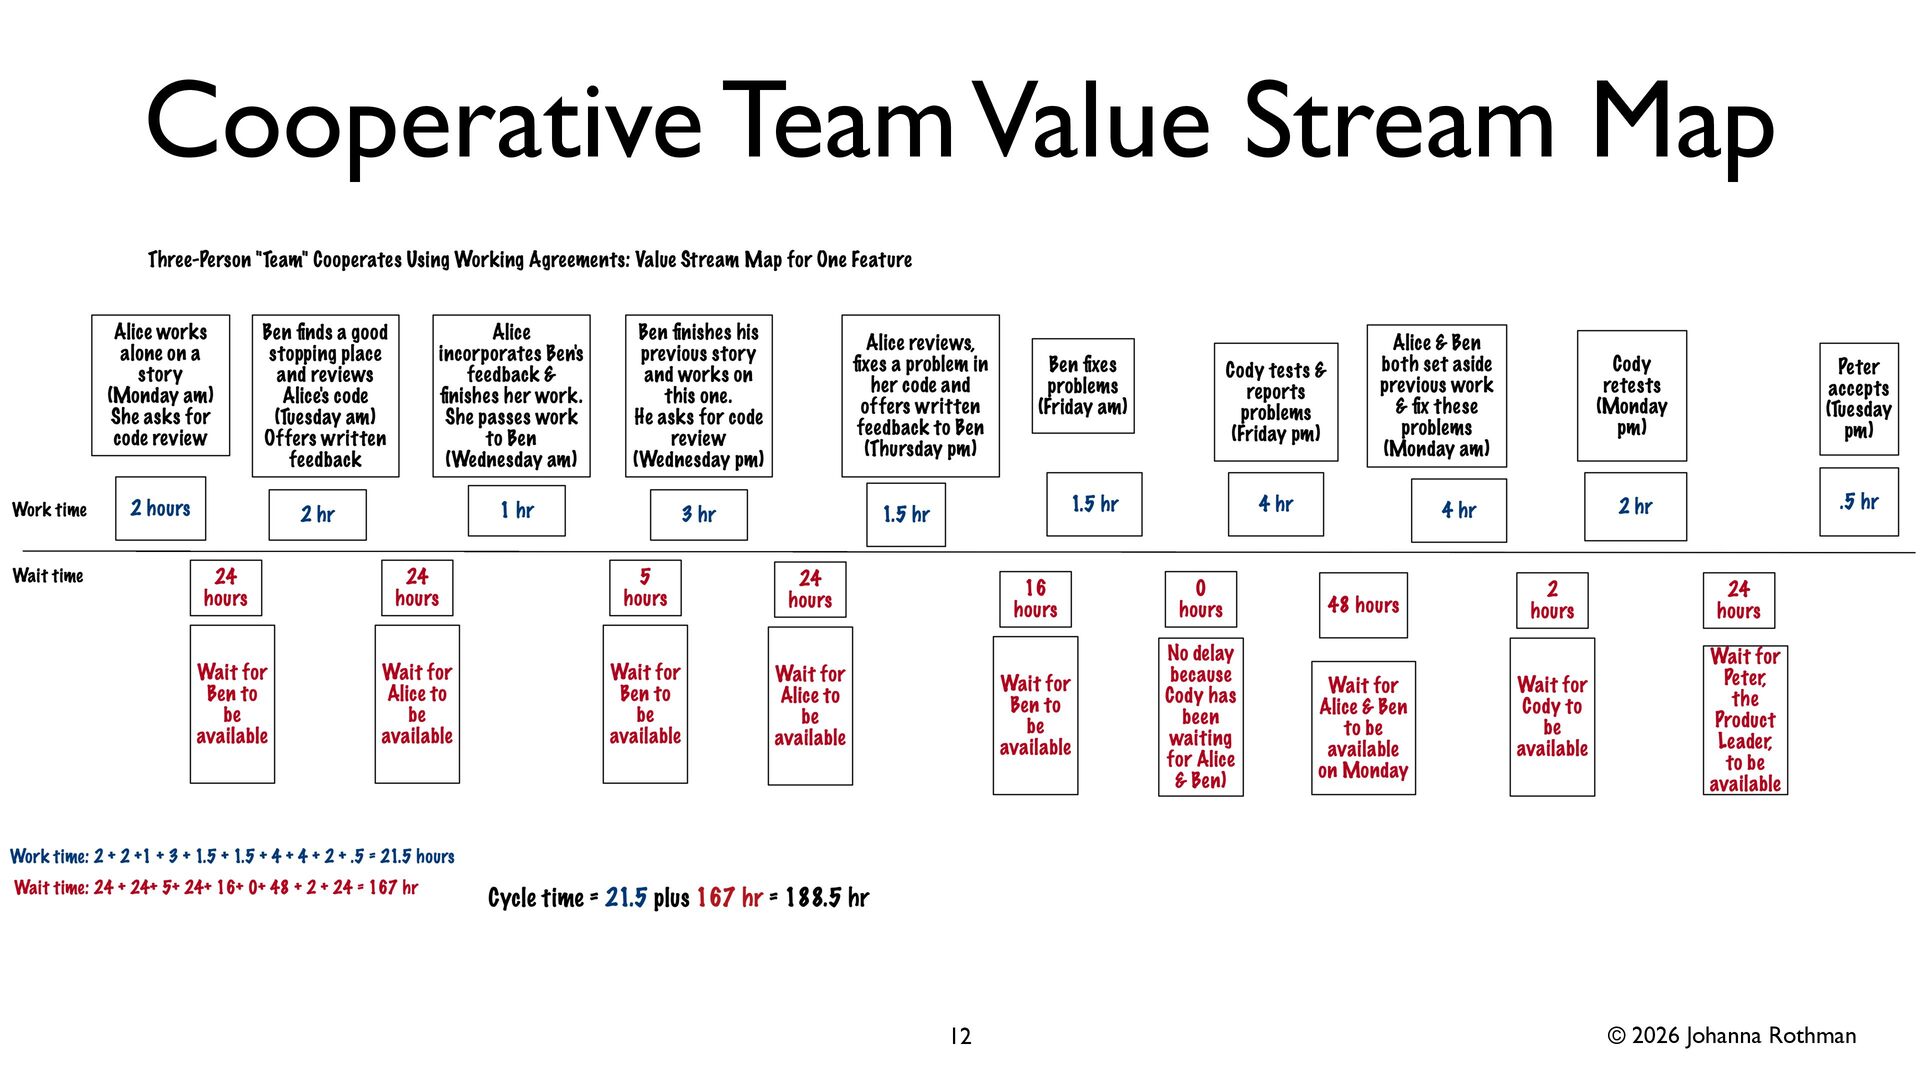
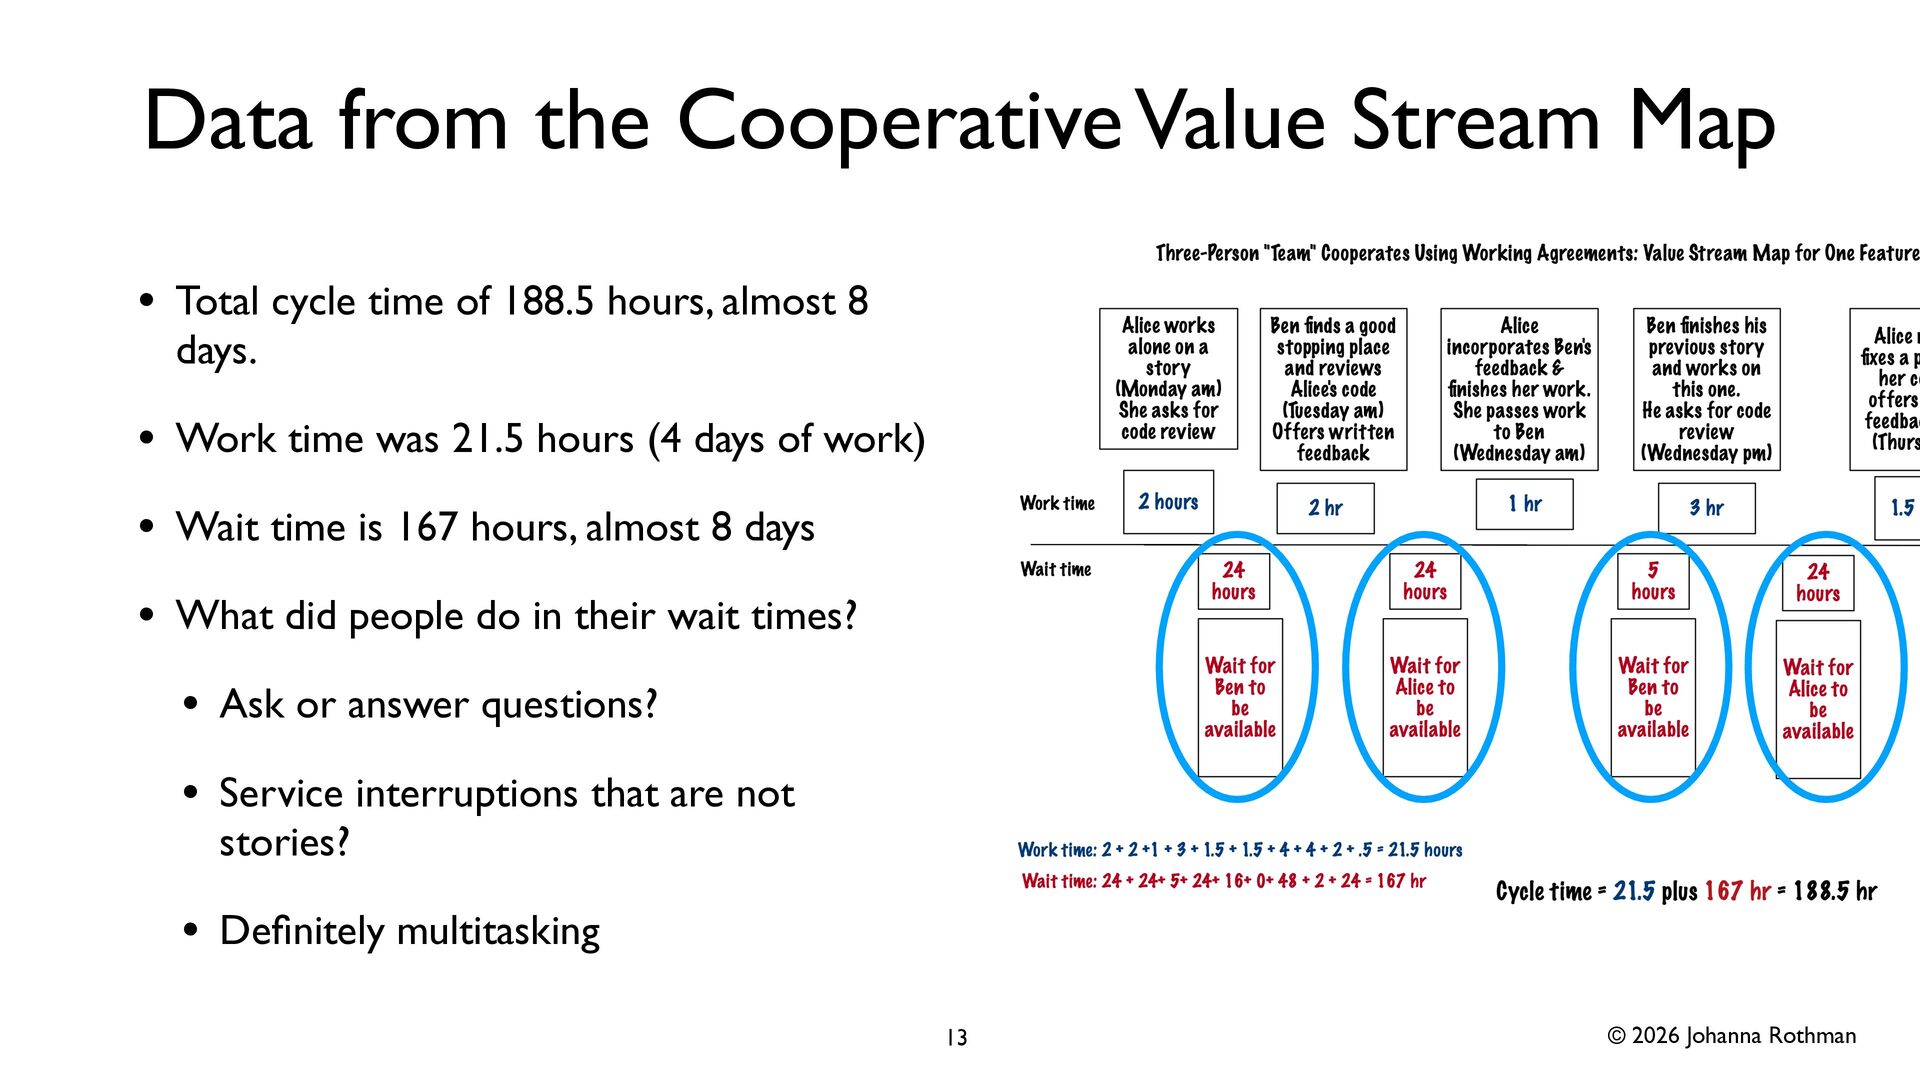
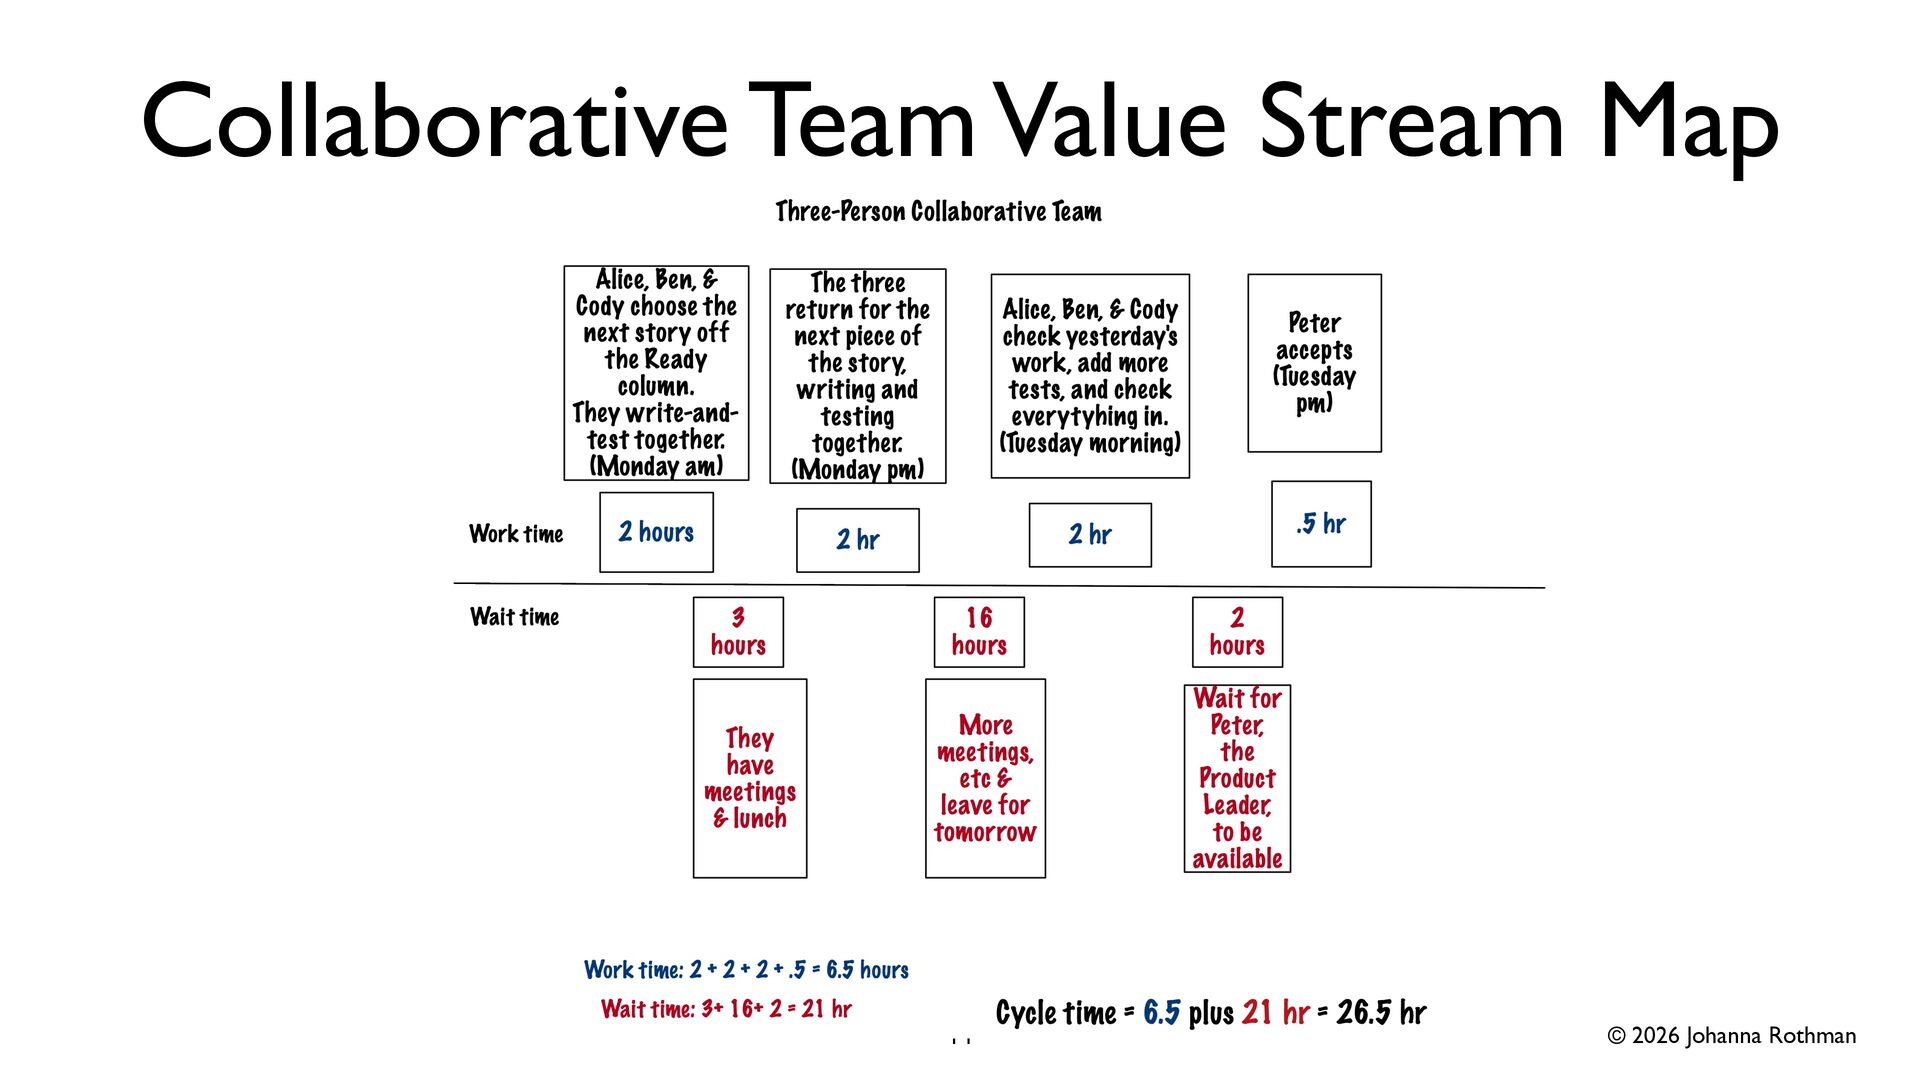
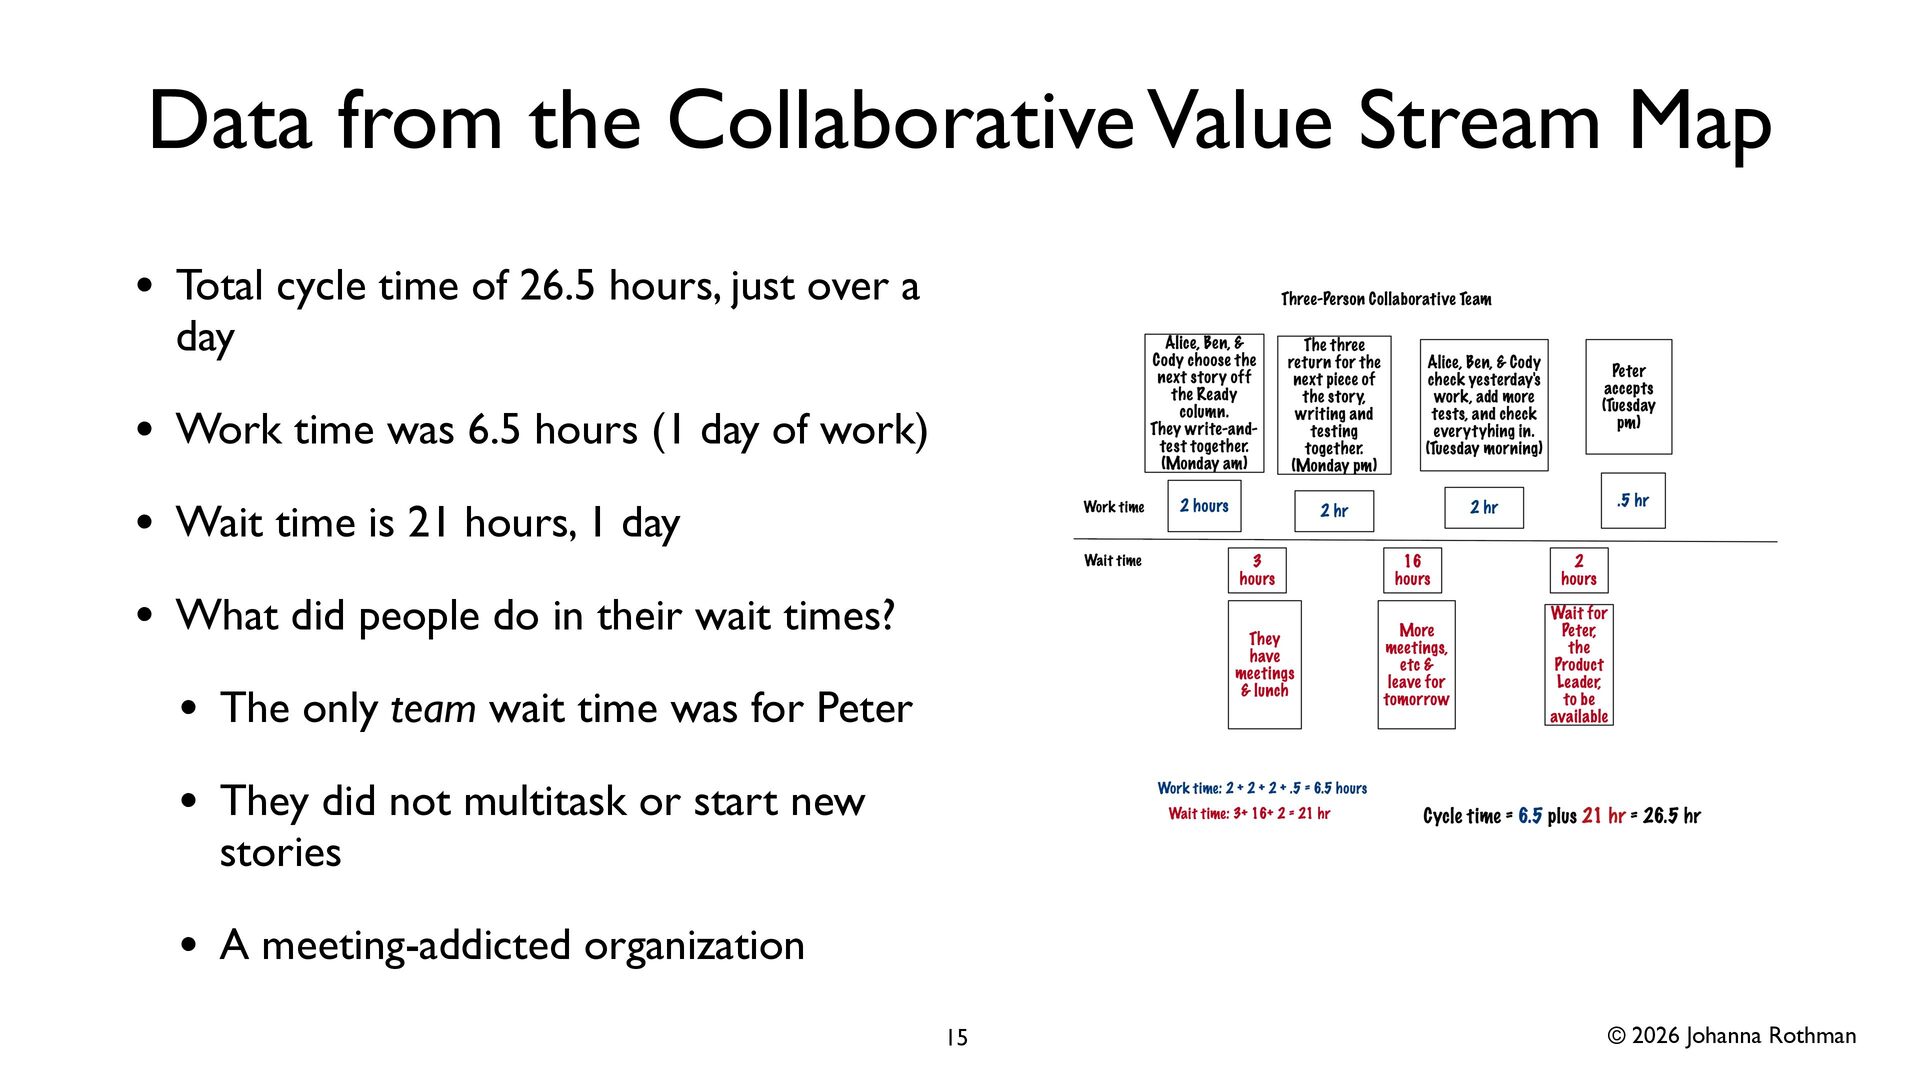
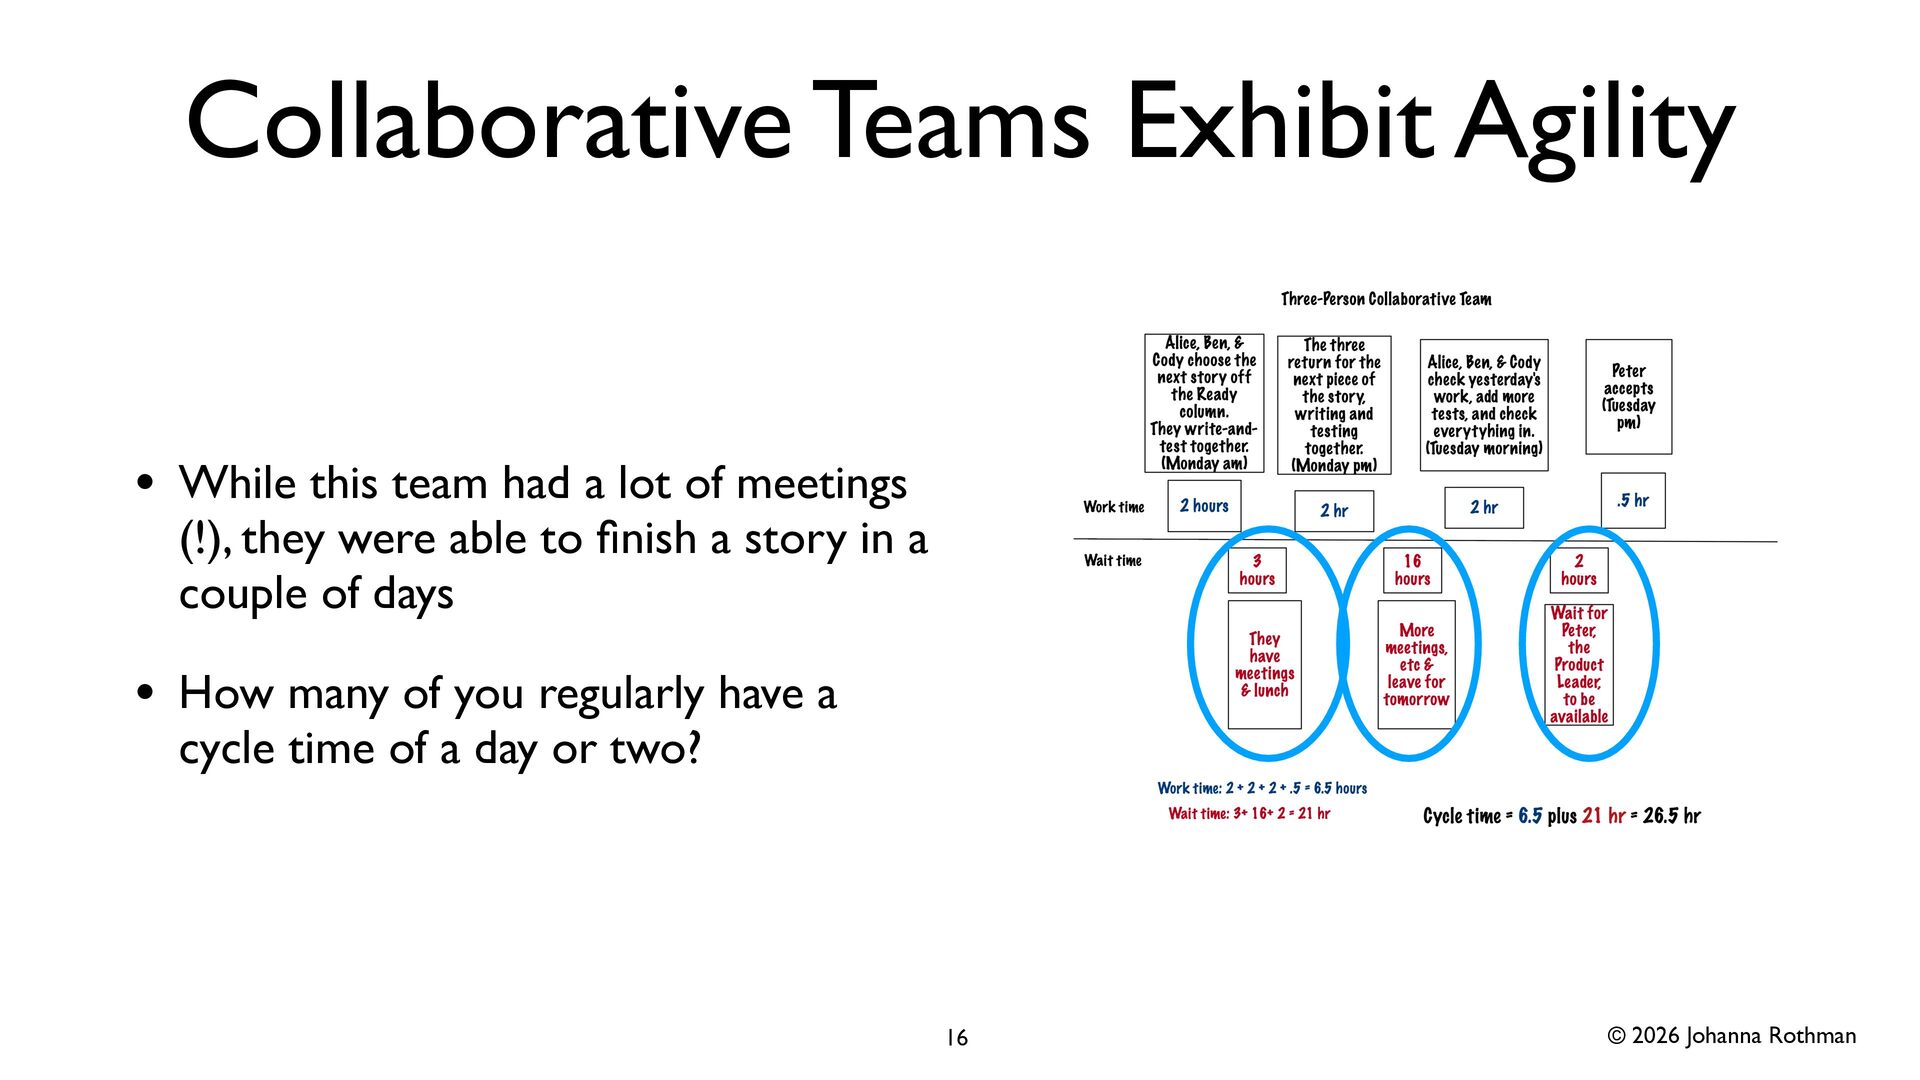
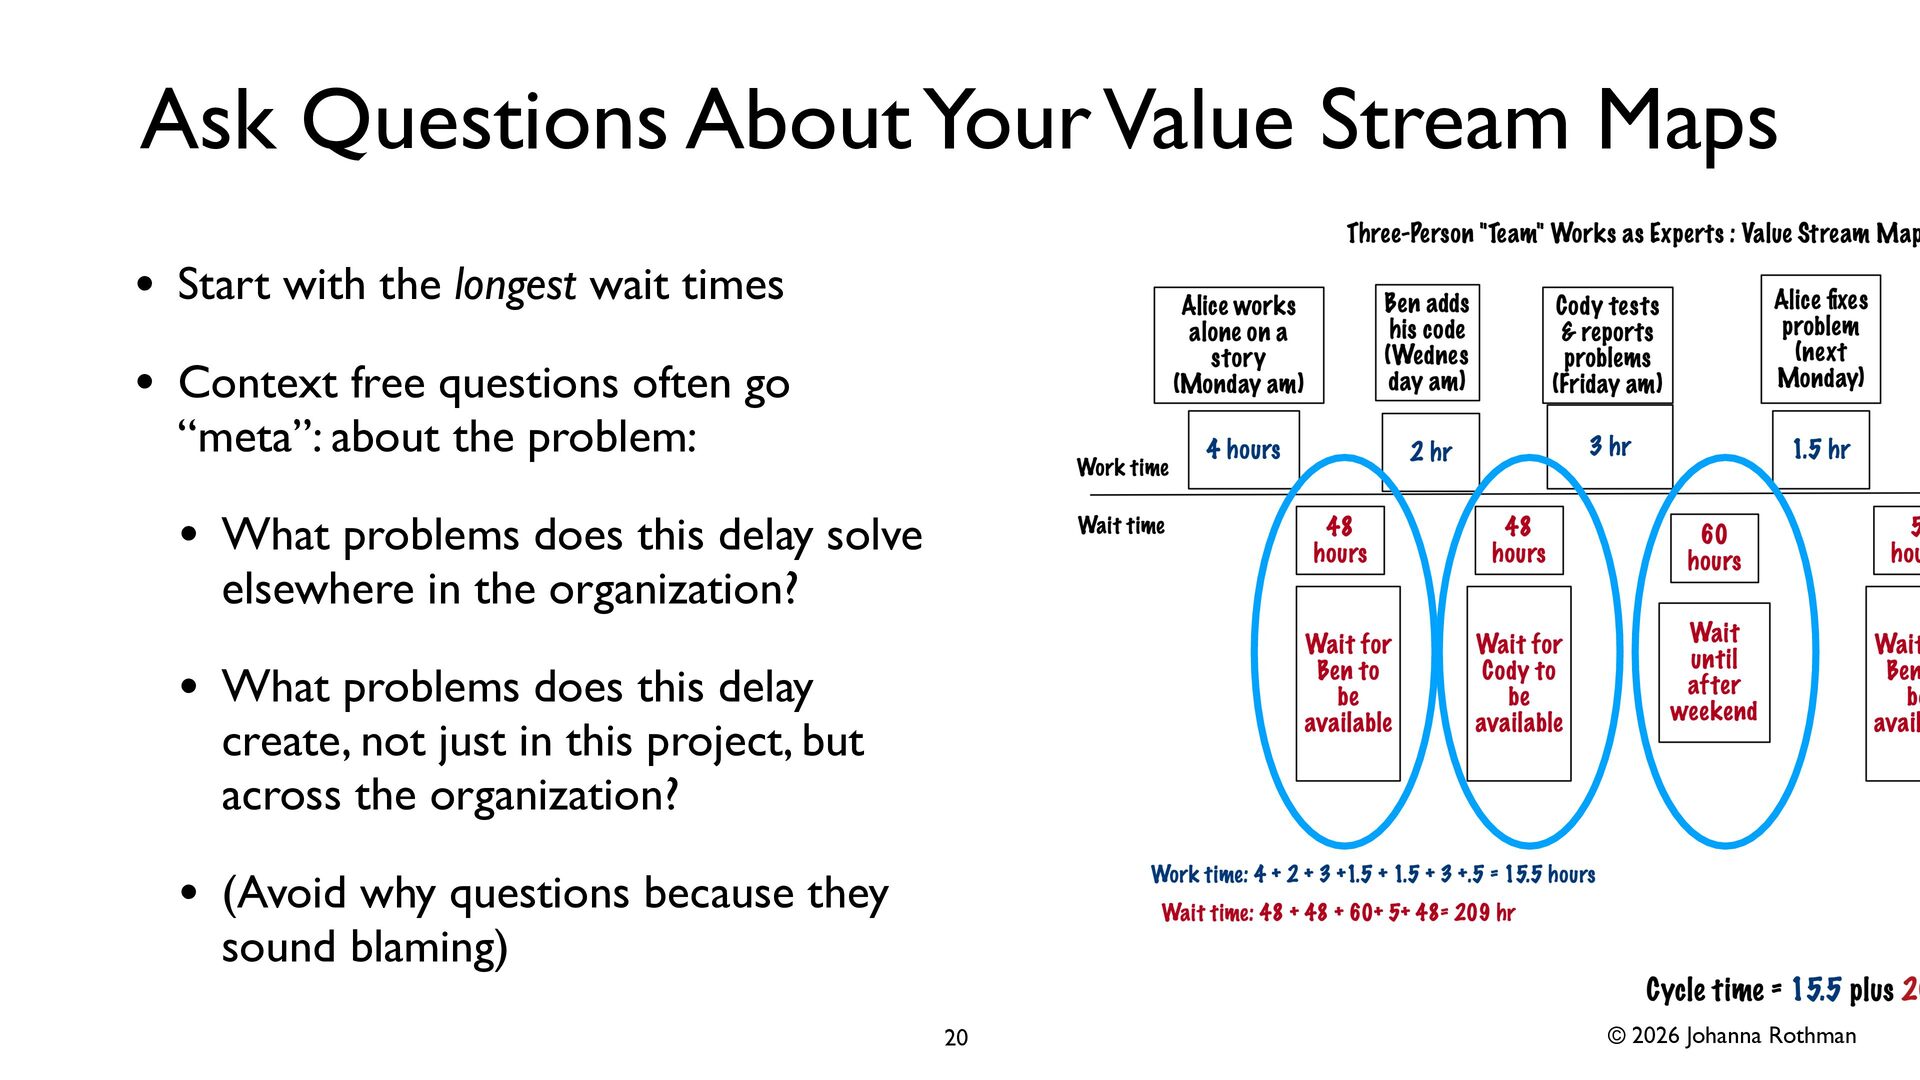
I will share at least three different value stream maps so you can see the difference between expert-based, individual-focused teams, cooperative teams, and collaborative, effective, agile teams.

Avatar for Johanna Rothman

Johanna Rothman PRO

April 09, 2026

Resources

Start here for the series of blog posts:

https://www.jrothman.com/mpd/2026/03/how-to-use-value-stream-maps-to-reinforce-agility-effectiveness-part-1/

The blog posts with more details and explanation

Johanna's Pragmatic Manager Newsletter

https://www.jrothman.com/pragmaticmanager

Johanna's email newsletter for more goodies like this.

More Decks by Johanna Rothman

Other Decks in Business

Transcript

  1. How to Use Value Stream Maps to Reinforce Agility and

    Effectiveness Johanna Rothman [email protected] www.jrothman.com
  2. © 2026 Johanna Rothman Agility Requires • A collaborative, cross-functional

    team • Who takes work off a short, ranked backlog • Releases increments of value regularly • Demos regularly • Retrospects regularly • All for the purpose of frequent- enough change 3
  3. © 2026 Johanna Rothman What I See is Not “Agile”

    • Some common problems in too many “agile” teams: • Work rolls over from sprint to sprint • Testers (or some other group) cannot fi nish “on time” • The team has to wait for an expert or shared services team to be available • The feedback loop from Ready to Demo is very long (unplanned feedback loops) 4
  4. © 2026 Johanna Rothman As a Result, Your Team Can’t

    Predict Much • Unreliable estimates (especially if you use story points) • Frustration everywhere: teams and managers • Because there is so little throughput, others ask people and teams to do more 5
  5. © 2026 Johanna Rothman Value Stream Maps Show Everyone Your

    System • Track the work time vs the wait time • Each type of team has its own patterns: • Expert (component teams are a form of expert teams) • Cooperative • Collaborative 7
  6. © 2026 Johanna Rothman Data from the Expert-Focused Value Stream

    Map • Total cycle time of 224.5 hours with is 9.5 days (2 weeks) • Work time was 15.5 hours (3 or 3+ days of work) • Wait time is 209 hours, 8.7 days • Also: what were people doing in all of that time? • Ask questions of others? • Service interruptions? (the longer the wait, the more likely there are other tasks) • De fi nitely multitasking during wait times 9
  7. © 2026 Johanna Rothman More Intentional Dependencies • When orgs

    want to manage costs, they create “shared services”: • UI staff • UAT staff • Deployment • In this org, story size was irrelevant. Every story had a cycle time of at least 2 (UI) + 5 (UAT) + 7 (Deployment) days: 14 days. 10
  8. © 2026 Johanna Rothman How Component Teams Can Work 11

    One of my clients uses a daily rolling checkin for their component teams. That allows them to achieve a best case 21 hour cycle time.
  9. © 2026 Johanna Rothman Data from the Cooperative Value Stream

    Map • Total cycle time of 188.5 hours, almost 8 days. • Work time was 21.5 hours (4 days of work) • Wait time is 167 hours, almost 8 days • What did people do in their wait times? • Ask or answer questions? • Service interruptions that are not stories? • De fi nitely multitasking 13
  10. © 2026 Johanna Rothman Data from the Collaborative Value Stream

    Map • Total cycle time of 26.5 hours, just over a day • Work time was 6.5 hours (1 day of work) • Wait time is 21 hours, 1 day • What did people do in their wait times? • The only team wait time was for Peter • They did not multitask or start new stories • A meeting-addicted organization 15
  11. © 2026 Johanna Rothman Collaborative Teams Exhibit Agility • While

    this team had a lot of meetings (!), they were able to fi nish a story in a couple of days • How many of you regularly have a cycle time of a day or two? 16
  12. © 2026 Johanna Rothman Several Collaboration Options • Agility requires

    fast team learning • That means the team must collaborate on limited WIP: • Pair: two people collaborate on one item: WIP of 1. • Swarm: Team or subset of a team collaborates on one item as experts: WIP is 1. • Mob: Entire team collaborates on one item: WIP is 1 17
  13. © 2026 Johanna Rothman What Does Management Want? • Lower

    time to release • Less investment • That’s why collaboration makes sense 18
  14. © 2026 Johanna Rothman Ask Questions About Your Value Stream

    Maps • Start with the longest wait times • Context free questions often go “meta”: about the problem: • What problems does this delay solve elsewhere in the organization? • What problems does this delay create, not just in this project, but across the organization? • (Avoid why questions because they sound blaming) 20
  15. © 2026 Johanna Rothman Mine Your Value Stream Maps for

    Objective Data • More data about wait times: • When the work waits, people are doing something else. What is that? • What is the relative ranking of this story and this project? (Is there more important work?) • Prioritization is NOT the same as ranking. Rank all work. Stop ranking people because they are capable of much more value. 21
  16. © 2026 Johanna Rothman Ask About Subjective Data • Subjective

    data for wait times: • Work satisfaction throughout the work (daily, as a project trend, etc.) 22
  17. © 2026 Johanna Rothman Resource Ef fi ciency vs Flow

    Ef fi ciency • Resource ef fi ciency thinking: Individual actions or deliverables: outputs • Flow ef fi ciency thinking: Focus on collaborative outcomes that serve an overarching goal • Rewards drive your organizational culture 23
  18. © 2026 Johanna Rothman Add More People? • Brooks’ Law

    meets Little’s Law • When people work as experts, Brooks’ Law holds (adding more people to a late project makes it later) • But when a team collaborates, WIP matters more than the number of people • That’s why collaboration time matters more than physical location for distributed teams 25 Little’s Law:
  19. © 2026 Johanna Rothman Solve Problems as a Team •

    Where can you, as a team, choose to collaborate? • What will ease your collaboration or make it more dif fi cult? • Consider a Force Field Analysis • Collaboration can be expert-based as in swarming 27
  20. © 2026 Johanna Rothman Collaboration in some way will ease

    your “too long” problems & It might be more fun! 28
  21. © 2026 Johanna Rothman All My Books (Organized) 29 Product

    Development Management Personal Development
  22. © 2026 Johanna Rothman Let’s Stay in Touch • Pragmatic

    Manager: www.jrothman.com/pragmaticmanager • Please link with me on LinkedIn: https://www.linkedin.com/in/ johannarothman/ • Start here for the blog posts: https:// www.jrothman.com/mpd/2026/03/ how-to-use-value-stream-maps-to- reinforce-agility-effectiveness-part-1/ 30