Upgrade to Pro — share decks privately, control downloads, hide ads and more …

Hunting memory ghosts

Hunting memory ghosts

Basic memory profiling in Ruby with MRI

Jose Luis Salas

June 21, 2016
Tweet

More Decks by Jose Luis Salas

Other Decks in Technology

Transcript

  1. Hunting memory ghosts
    Jose Luis Salas
    Flywire

    View Slide

  2. # whoami
    • Jose Luis Salas
    • SRE at Flywire
    • twitter: @josacar
    • github: josacar

    View Slide

  3. What’s a memory leak
    A memory leak is a type of resource leak that occurs
    when a computer program incorrectly manages memory
    allocations in such a way that memory which is no longer
    needed is not released.
    Source: Wikipedia

    View Slide

  4. Leaking memory in MRI
    • Leaking objects in Ruby heap
    • Leaking memory in C structures

    View Slide

  5. How find C leaks
    • gdb
    • valgrind / leaks
    • pprof
    • jemalloc
    • printf in C code

    View Slide

  6. Leak in C extensions
    • eventmachine#585


    • redcarpet#516


    View Slide

  7. Leaks in Ruby code

    View Slide

  8. How find ruby leaks
    • Use `rbtrace` gem
    • Use `allocation_tracer` gem
    • Use `objspace` stdlib
    • Use gdb

    View Slide

  9. Get objects by class
    require ‘objspace’
    Thread.new do
    GC.start
    objs = Hash.new(0)
    ObjectSpace.each_object do |obj|
    objs[obj.class] += 1
    end
    obj_sorted_desc = objs.sort_by { |_,v| -v }
    top_ten = obj_sorted_desc.first(10)
    $stderr.puts top_ten
    end

    View Slide

  10. $ bundle exec rbtrace -p PID -e 'Thread.new{ GC.start;
    objs = Hash.new(0); ObjectSpace.each_object {|o|
    objs[o.class] += 1}; $stderr.puts( objs.sort_by { |
    _,v| -v }.first(5) )}'
    • String 92800
    • Array 24709
    • RubyVM::InstructionSequence 17067
    • Proc 5051
    • RubyVM::Env 5000
    • String 92562
    • Array 25042
    • RubyVM::InstructionSequence 17067
    • RubyVM::Env 5566
    • String 92675
    • Array 25388
    • RubyVM::InstructionSequence 17067
    • RubyVM::Env 5949
    • Proc 5871
    • String 92547
    • Array 26287
    • RubyVM::InstructionSequence 17067
    • RubyVM::Env 7165
    • Proc 6916

    View Slide

  11. Tracking allocations
    require ‘objspace'
    Thread.new do
    GC.start
    ObjectSpace.trace_object_allocations_start
    sleep 60
    GC.start
    ObjectSpace.each_object do |o|
    next unless o.class == Array
    file = ObjectSpace.allocation_sourcefile(o)
    line = ObjectSpace.allocation_sourceline(o)
    puts "#{file}:#{line}"
    end
    end

    View Slide

  12. $ bundle exec rbtrace -p 29217 -e 'Thread.new{ GC.start;
    ObjectSpace.trace_object_allocations_start; sleep 60;
    GC.start; ObjectSpace.each_object{|o| puts
    "#{ObjectSpace.allocation_sourcefile(o)}:#{ObjectSpace.all
    ocation_sourceline(o)}" if o.class == Array }}' > leak.log
    $ sort leak.log | uniq -c
    106 GEMS_ROOT/gems/redis-namespace-1.5.1/lib/redis/namespace.rb:289
    120 GEMS_ROOT/gems/redis-3.2.0/lib/redis/connection/ruby.rb:52
    144 GEMS_ROOT/gems/redis-3.2.0/lib/redis/pipeline.rb:95
    180 GEMS_ROOT/gems/redis-3.2.0/lib/redis/connection/command_helper.rb:19
    509 GEMS_ROOT/gems/analytics-ruby-2.0.13/lib/segment/analytics/client.rb:348
    525 GEMS_ROOT/gems/newrelic_rpm-3.13.2.302/lib/new_relic/agent/transaction_state.rb:37
    526 GEMS_ROOT/gems/newrelic_rpm-3.13.2.302/lib/new_relic/agent/traced_method_stack.rb:23
    1377 GEMS_ROOT/gems/analytics-ruby-2.0.13/lib/segment/analytics/worker.rb:29

    View Slide

  13. Finding suspicious
    23 def initialize(queue, write_key, options = {})
    24 symbolize_keys! options
    25 @queue = queue
    26 @write_key = write_key
    27 @batch_size = options[:batch_size] || Queue::BATCH_SIZE
    28 @on_error = options[:on_error] || Proc.new { |status, error| }
    29 @batch = []
    30 @lock = Mutex.new
    31 end

    View Slide

  14. Dumping the heap
    require 'objspace'
    GC.start
    file = File.open('heap.json','w')
    ObjectSpace.dump_all(output: file)
    {"address":"0x7fae9590c1d0", "type":"ARRAY",
    "length":0, "memsize":40, "flags":
    {"wb_protected":true, "old":true,
    "long_lived":true, "marked":true}}

    View Slide

  15. How a fix looks like

    View Slide

  16. Simple example
    1 require 'rbtrace'
    2
    3 $stdout.sync = true
    4 $stderr.sync = true
    5
    6 puts $$
    7
    8 class Worker
    9 def initialize
    10 @leak = 'wadus'
    11 end
    12
    13 def create_worker
    14 Thread.new do
    15 puts Thread.current.object_id
    16 loop do
    17 sleep 60
    18 end
    19 end
    20 end
    21 end
    22
    23 loop do
    24 Worker.new.create_worker
    25 sleep 1
    26 end

    View Slide

  17. Finding the leak
    $ sort leak.log | uniq -c
    31645 :
    30 :0
    15511 eval:1
    14 leak.rb:10

    View Slide

  18. Analysing snippets
    require 'segment'
    GC.start
    100_000.times do
    Segment::Analytics.new({write_key: 'KEY'})
    end
    GC.start
    objs = Hash.new(0)
    ObjectSpace.each_object do |o|
    objs[o.class] += 1
    end
    puts(objs.sort_by { |_,v| -v }.first(10))

    View Slide

  19. Objects in heap
    Proc 200389
    RubyVM::Env 200324
    Mutex 200009
    String 146403
    Array 120428
    Hash 102510
    Thread::Queue 100000
    Segment::Analytics::Worker 100000
    Segment::Analytics::Client 100000
    Gem::Requirement 5543

    View Slide

  20. Measuring allocations
    require 'peertransfer/segment'
    require 'allocation_tracer'
    PeertransferSegment.configure do |config|
    config.write_key = 'YOUR_WRITE_KEY'
    end
    ObjectSpace::AllocationTracer.trace do
    50_000.times do |i|
    event = { user_id: 123, traits: { email: '[email protected]' }
    PeertransferSegment.identify(event)
    end
    end
    p allocated: ObjectSpace::AllocationTracer.allocated_count_table
    p freed: ObjectSpace::AllocationTracer.freed_count_table

    View Slide

  21. Allocated vs freed
    {:allocated=>{:T_NONE=>0, :T_OBJECT=>42, :T_CLASS=>0, :T_MO
    DULE=>0, :T_FLOAT=>0, :T_STRING=>1307744, :T_REGEXP=>0, :
    T_ARRAY=>651051, :T_HASH=>350051, :T_STRUCT=>1, :T_BIGNU
    M=>0, :T_FILE=>3, :T_DATA=>50087, :T_MATCH=>14, :T_COMPLEX
    =>0, :T_RATIONAL=>0, :unknown=>0, :T_NIL=>0, :T_TRUE=>0, :T_F
    ALSE=>0, :T_SYMBOL=>0, :T_FIXNUM=>0, :T_UNDEF=>0, :T_NOD
    E=>200045, :T_ICLASS=>0, :T_ZOMBIE=>0}}
    {:freed=>{:T_NONE=>0, :T_OBJECT=>4504, :T_CLASS=>0, :T_MOD
    ULE=>0, :T_FLOAT=>0, :T_STRING=>1228426, :T_REGEXP=>7, :T_
    ARRAY=>630727, :T_HASH=>292873, :T_STRUCT=>904, :T_BIGNU
    M=>0, :T_FILE=>40, :T_DATA=>48635, :T_MATCH=>268, :T_COMPL
    EX=>0, :T_RATIONAL=>0, :unknown=>0, :T_NIL=>0, :T_TRUE=>0, :
    T_FALSE=>0, :T_SYMBOL=>0, :T_FIXNUM=>0, :T_UNDEF=>0, :T_N
    ODE=>213922, :T_ICLASS=>0, :T_ZOMBIE=>0}}

    View Slide

  22. Simpler example
    require 'allocation_tracer'
    ObjectSpace::AllocationTracer.trace do
    50_000.times do |i|
    a = i.to_s
    end
    end
    p allocated: ObjectSpace::AllocationTracer.allocated_count_table
    p freed: ObjectSpace::AllocationTracer.freed_count_table

    View Slide

  23. Allocations vs freed
    {:allocated=>{:T_NONE=>0, :T_OBJECT=>0, :T_CLASS=>0, :T_MOD
    ULE=>0, :T_FLOAT=>0, :T_STRING=>50000, :T_REGEXP=>0, :T_AR
    RAY=>0, :T_HASH=>0, :T_STRUCT=>0, :T_BIGNUM=>0, :T_FILE=>
    0, :T_DATA=>0, :T_MATCH=>0, :T_COMPLEX=>0, :T_RATIONAL=>0
    , :unknown=>0, :T_NIL=>0, :T_TRUE=>0, :T_FALSE=>0, :T_SYMBOL
    =>0, :T_FIXNUM=>0, :T_UNDEF=>0, :T_NODE=>0, :T_ICLASS=>0, :
    T_ZOMBIE=>0}}
    {:freed=>{:T_NONE=>0, :T_OBJECT=>4072, :T_CLASS=>0, :T_MOD
    ULE=>0, :T_FLOAT=>0, :T_STRING=>7784, :T_REGEXP=>0, :T_AR
    RAY=>22762, :T_HASH=>1033, :T_STRUCT=>2419, :T_BIGNUM=>0
    , :T_FILE=>2, :T_DATA=>1812, :T_MATCH=>10, :T_COMPLEX=>0, :T
    _RATIONAL=>0, :unknown=>0, :T_NIL=>0, :T_TRUE=>0, :T_FALSE=
    >0, :T_SYMBOL=>0, :T_FIXNUM=>0, :T_UNDEF=>0, :T_NODE=>10
    255, :T_ICLASS=>0, :T_ZOMBIE=>0}}

    View Slide

  24. Extra ball: Using GDB
    $ gdb -p PID
    gdb> p rb_eval_string("GC.start")
    gdb> p rb_eval_string("$all_objs = Hash.new(0)”)
    gdb> p rb_eval_string("ObjectSpace.each_object {|o| $all_objs[o.class] += 1}")
    gdb> p rb_eval_string("$stderr.puts($all_objs.inspect)")
    gdb> p rb_eval_string("GC.start")
    gdb> p rb_eval_string("$string_objs = Hash.new(0)”)
    gdb> p rb_eval_string("ObjectSpace.each_object(String) {|o| $string_objs[o] += 1}")
    gdb> p rb_eval_string("$stderr.puts($string_objs.inspect)")
    gdb> p rb_eval_string("$stderr.puts($string_objs.size)")
    gdb> p rb_eval_string("$max = 0")
    gdb> p rb_eval_string("$max_key = ''")
    gdb> p rb_eval_string("$string_objs.each { |k,v| $max_key = k if v > $max }")

    View Slide

  25. {Module=>504, Array=>34775, String=>428082, Hash=>24444, RubyVM::InstructionSequence=>11903,
    Regexp=>988, Class=>1341, Range=>179, Gem::Version=>251, Gem::Requirement=>237,
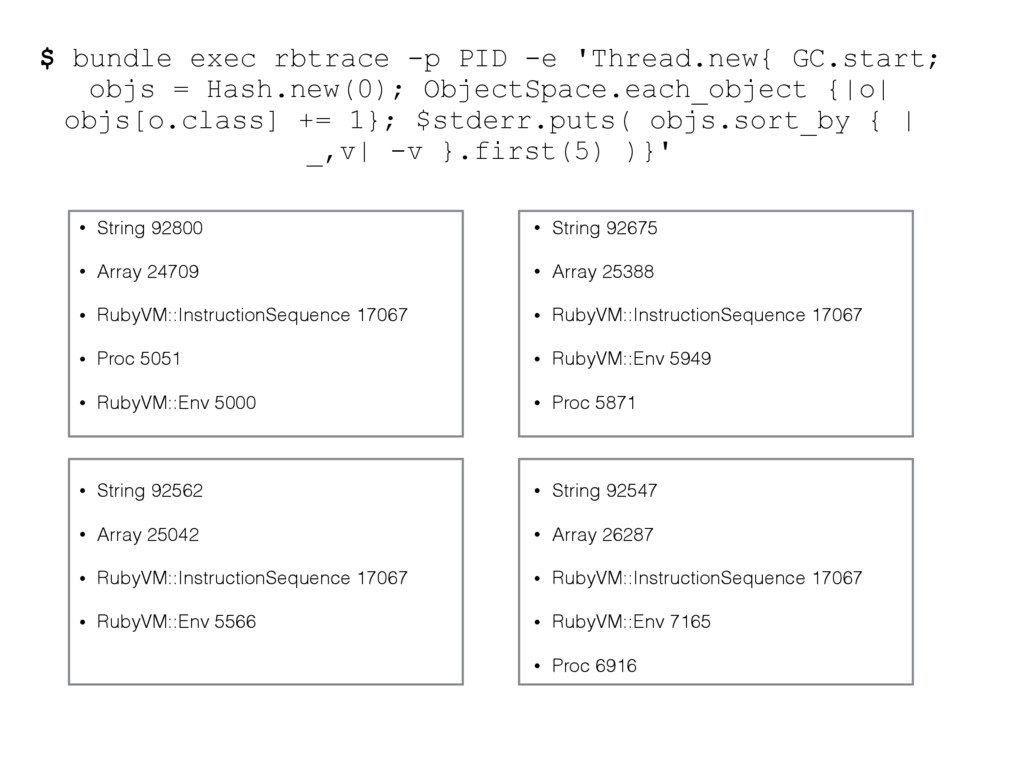
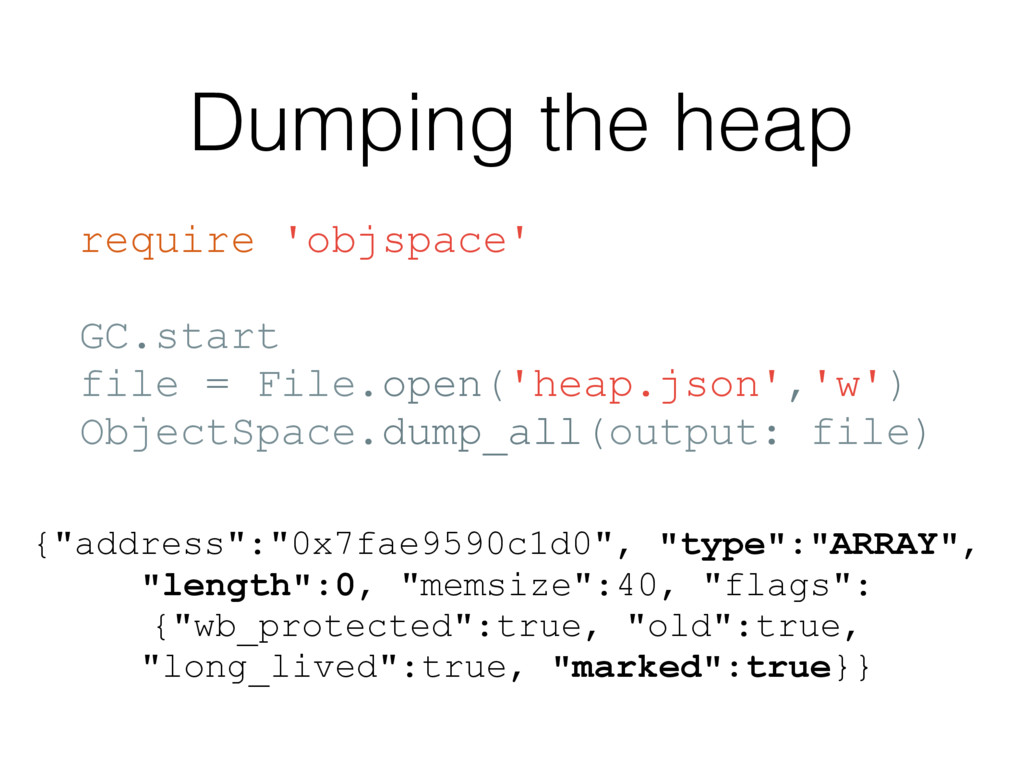
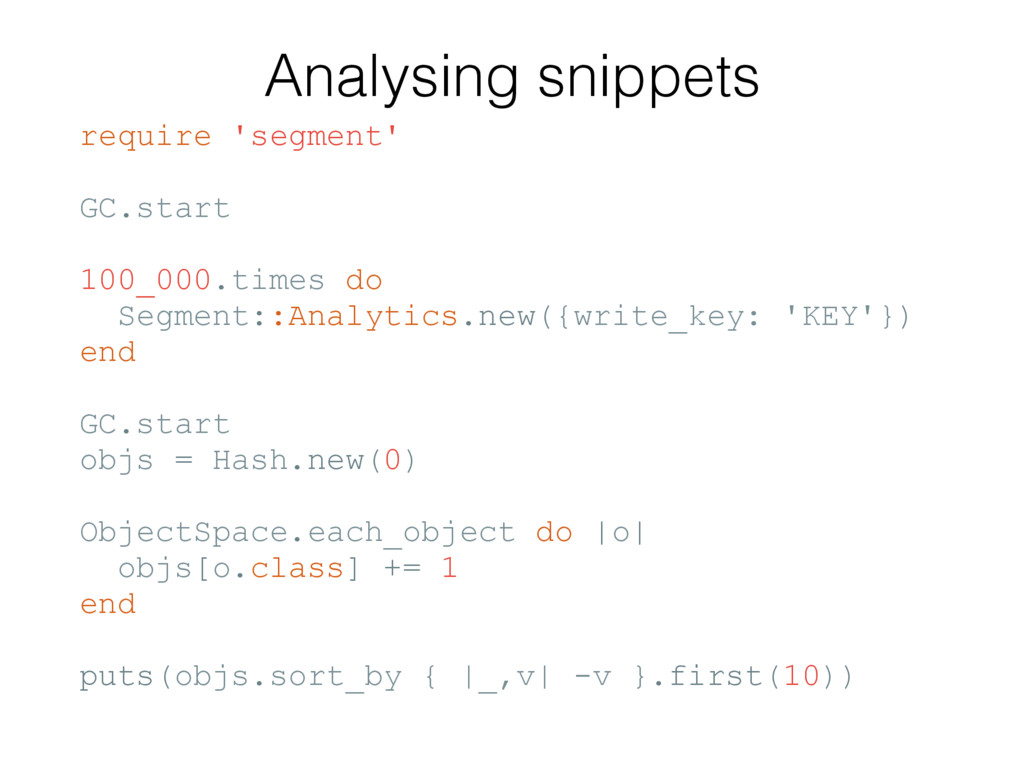
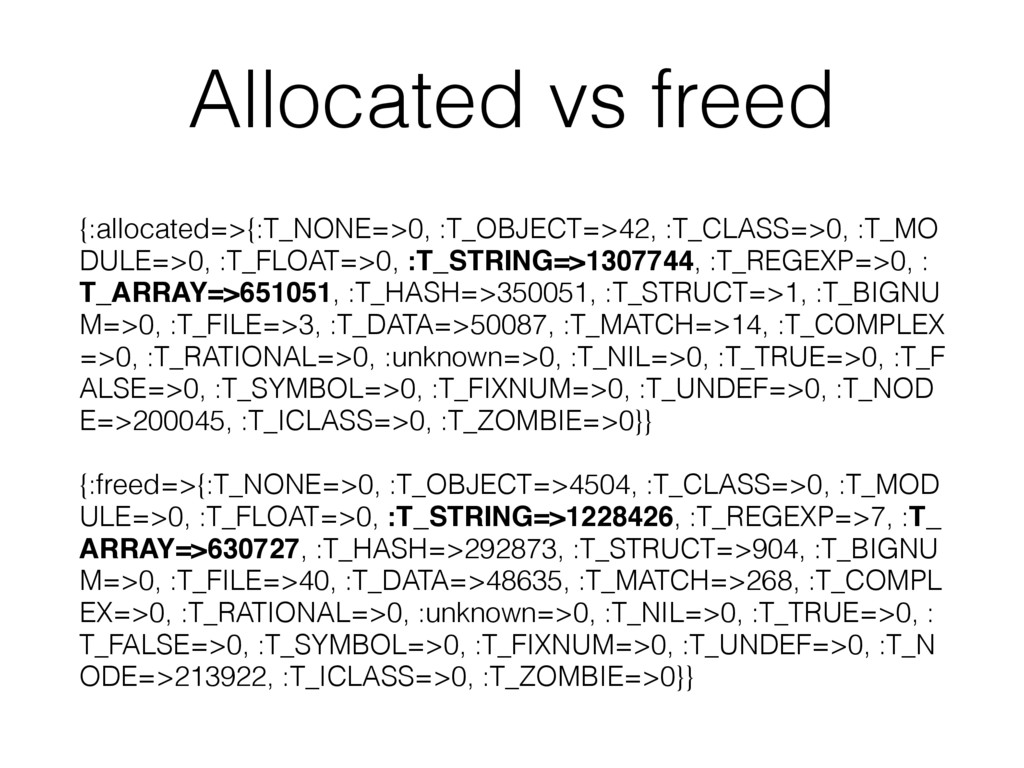
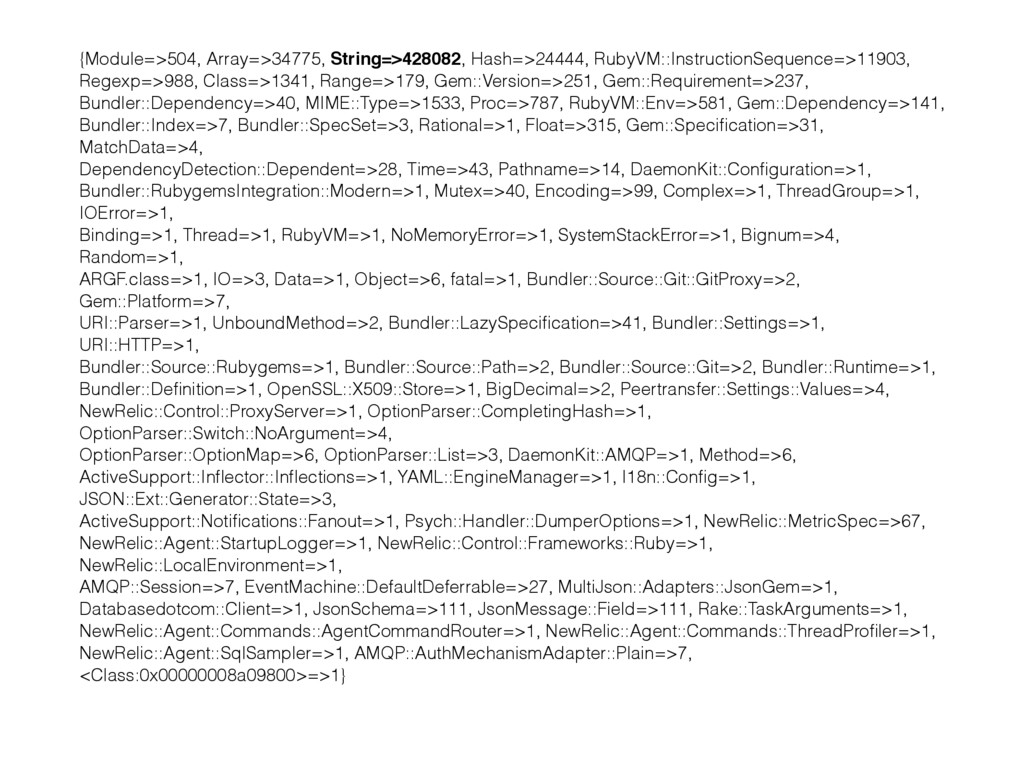
    Bundler::Dependency=>40, MIME::Type=>1533, Proc=>787, RubyVM::Env=>581, Gem::Dependency=>141,
    Bundler::Index=>7, Bundler::SpecSet=>3, Rational=>1, Float=>315, Gem::Specification=>31,
    MatchData=>4,
    DependencyDetection::Dependent=>28, Time=>43, Pathname=>14, DaemonKit::Configuration=>1,
    Bundler::RubygemsIntegration::Modern=>1, Mutex=>40, Encoding=>99, Complex=>1, ThreadGroup=>1,
    IOError=>1,
    Binding=>1, Thread=>1, RubyVM=>1, NoMemoryError=>1, SystemStackError=>1, Bignum=>4,
    Random=>1,
    ARGF.class=>1, IO=>3, Data=>1, Object=>6, fatal=>1, Bundler::Source::Git::GitProxy=>2,
    Gem::Platform=>7,
    URI::Parser=>1, UnboundMethod=>2, Bundler::LazySpecification=>41, Bundler::Settings=>1,
    URI::HTTP=>1,
    Bundler::Source::Rubygems=>1, Bundler::Source::Path=>2, Bundler::Source::Git=>2, Bundler::Runtime=>1,
    Bundler::Definition=>1, OpenSSL::X509::Store=>1, BigDecimal=>2, Peertransfer::Settings::Values=>4,
    NewRelic::Control::ProxyServer=>1, OptionParser::CompletingHash=>1,
    OptionParser::Switch::NoArgument=>4,
    OptionParser::OptionMap=>6, OptionParser::List=>3, DaemonKit::AMQP=>1, Method=>6,
    ActiveSupport::Inflector::Inflections=>1, YAML::EngineManager=>1, I18n::Config=>1,
    JSON::Ext::Generator::State=>3,
    ActiveSupport::Notifications::Fanout=>1, Psych::Handler::DumperOptions=>1, NewRelic::MetricSpec=>67,
    NewRelic::Agent::StartupLogger=>1, NewRelic::Control::Frameworks::Ruby=>1,
    NewRelic::LocalEnvironment=>1,
    AMQP::Session=>7, EventMachine::DefaultDeferrable=>27, MultiJson::Adapters::JsonGem=>1,
    Databasedotcom::Client=>1, JsonSchema=>111, JsonMessage::Field=>111, Rake::TaskArguments=>1,
    NewRelic::Agent::Commands::AgentCommandRouter=>1, NewRelic::Agent::Commands::ThreadProfiler=>1,
    NewRelic::Agent::SqlSampler=>1, AMQP::AuthMechanismAdapter::Plain=>7,
    =>1}

    View Slide

  26. $ gdb -p PID
    gdb> p rb_eval_string("GC.start")
    gdb> p rb_eval_string("$string_objs = Hash.new 0")
    gdb> p rb_eval_string("ObjectSpace.each_object(String) {|o| $string_objs[o] += 1}")
    gdb> p rb_eval_string("$stderr.puts($string_objs.sort_by { |_,v| -v }.first(10))”)
    label 108443
    defaultValue 106919
    active 62427
    value 62356
    validFor 60974
    deprecatedAndHidden 59451
    relationshipName 59305
    name 47864
    updateable 46099
    createable 46099

    View Slide

  27. DEMO
    • In Debian jessie run ( or PIE-capable gdb version ):
    $ ruby -e 'puts $$; loop { sleep 1 }'
    • Run in another terminal:
    $ gdb -p
    (gdb) p rb_eval_string("puts $$")
    $1 = 8

    View Slide

  28. Annex
    • http://ruby-doc.org/stdlib-2.1.0/libdoc/objspace/rdoc/
    ObjectSpace.html
    • https://github.com/ko1/allocation_tracer
    • http://tmm1.net/ruby21-objspace/
    • https://github.com/tmm1/rbtrace
    • https://github.com/srawlins/allocation_stats
    • https://github.com/SamSaffron/memory_profiler
    • https://samsaffron.com/archive/2015/03/31/debugging-memory-
    leaks-in-ruby
    • http://www.be9.io/2015/09/21/memory-leak/

    View Slide