Upgrade to Pro — share decks privately, control downloads, hide ads and more …

2026 HeroConf - Joshua Slodki - The Marketer's ...

2026 HeroConf - Joshua Slodki - The Marketer's Intro to Structuring BigQuery for Data Studio

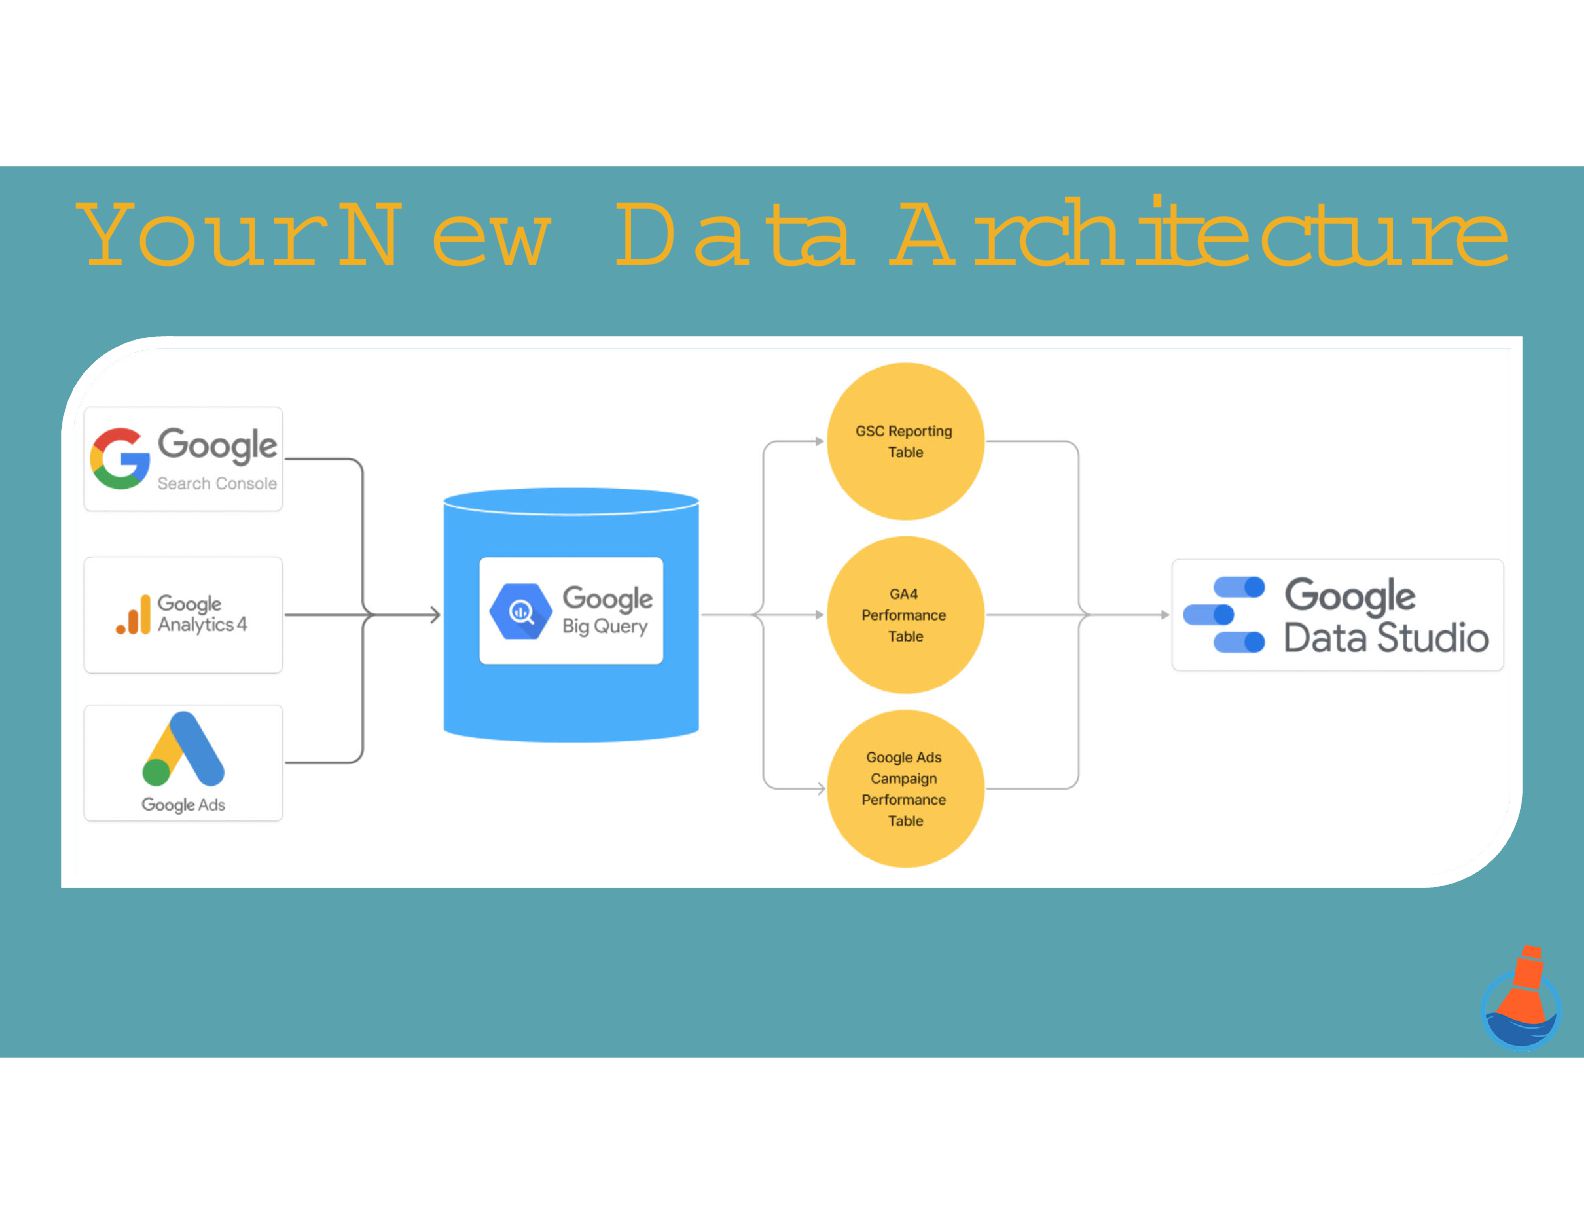
In this talk, Josh will show you how to take advantage of the Google data flowing into BigQuery to improve & enhance your Google Looker Studio reporting.

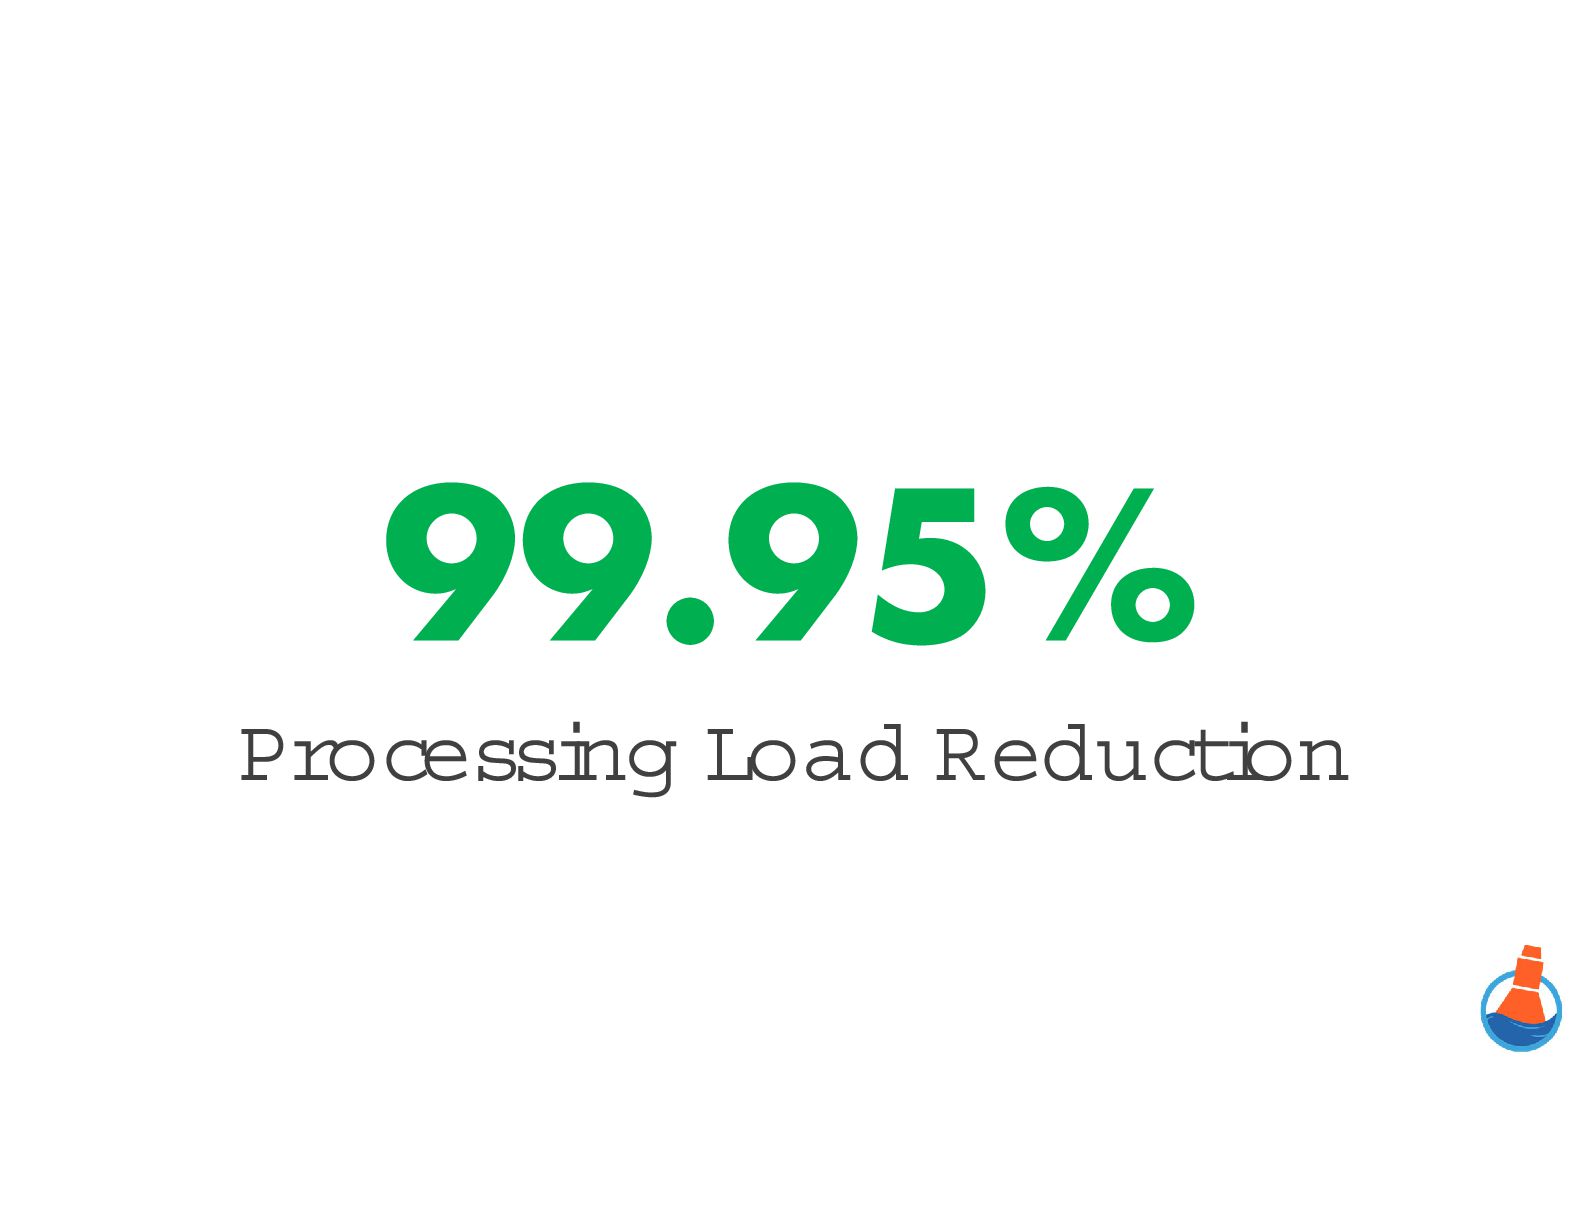
You'll learn about creating a BigQuery data structure that can replace the native connectors making your reports more efficient, reliable, while not risking expensive BigQuery processing costs.

Avatar for JoshuaSlodki

JoshuaSlodki

September 18, 2026

More Decks by JoshuaSlodki

Other Decks in Marketing & SEO

Transcript

  1. HEADSHOT HERE The Marketer's Intro to Structuring BigQuery for Data

    Studio Joshua Slodki Buoy Digital Group @joshuaslodki https://speakerdeck.com/joshuaslodki
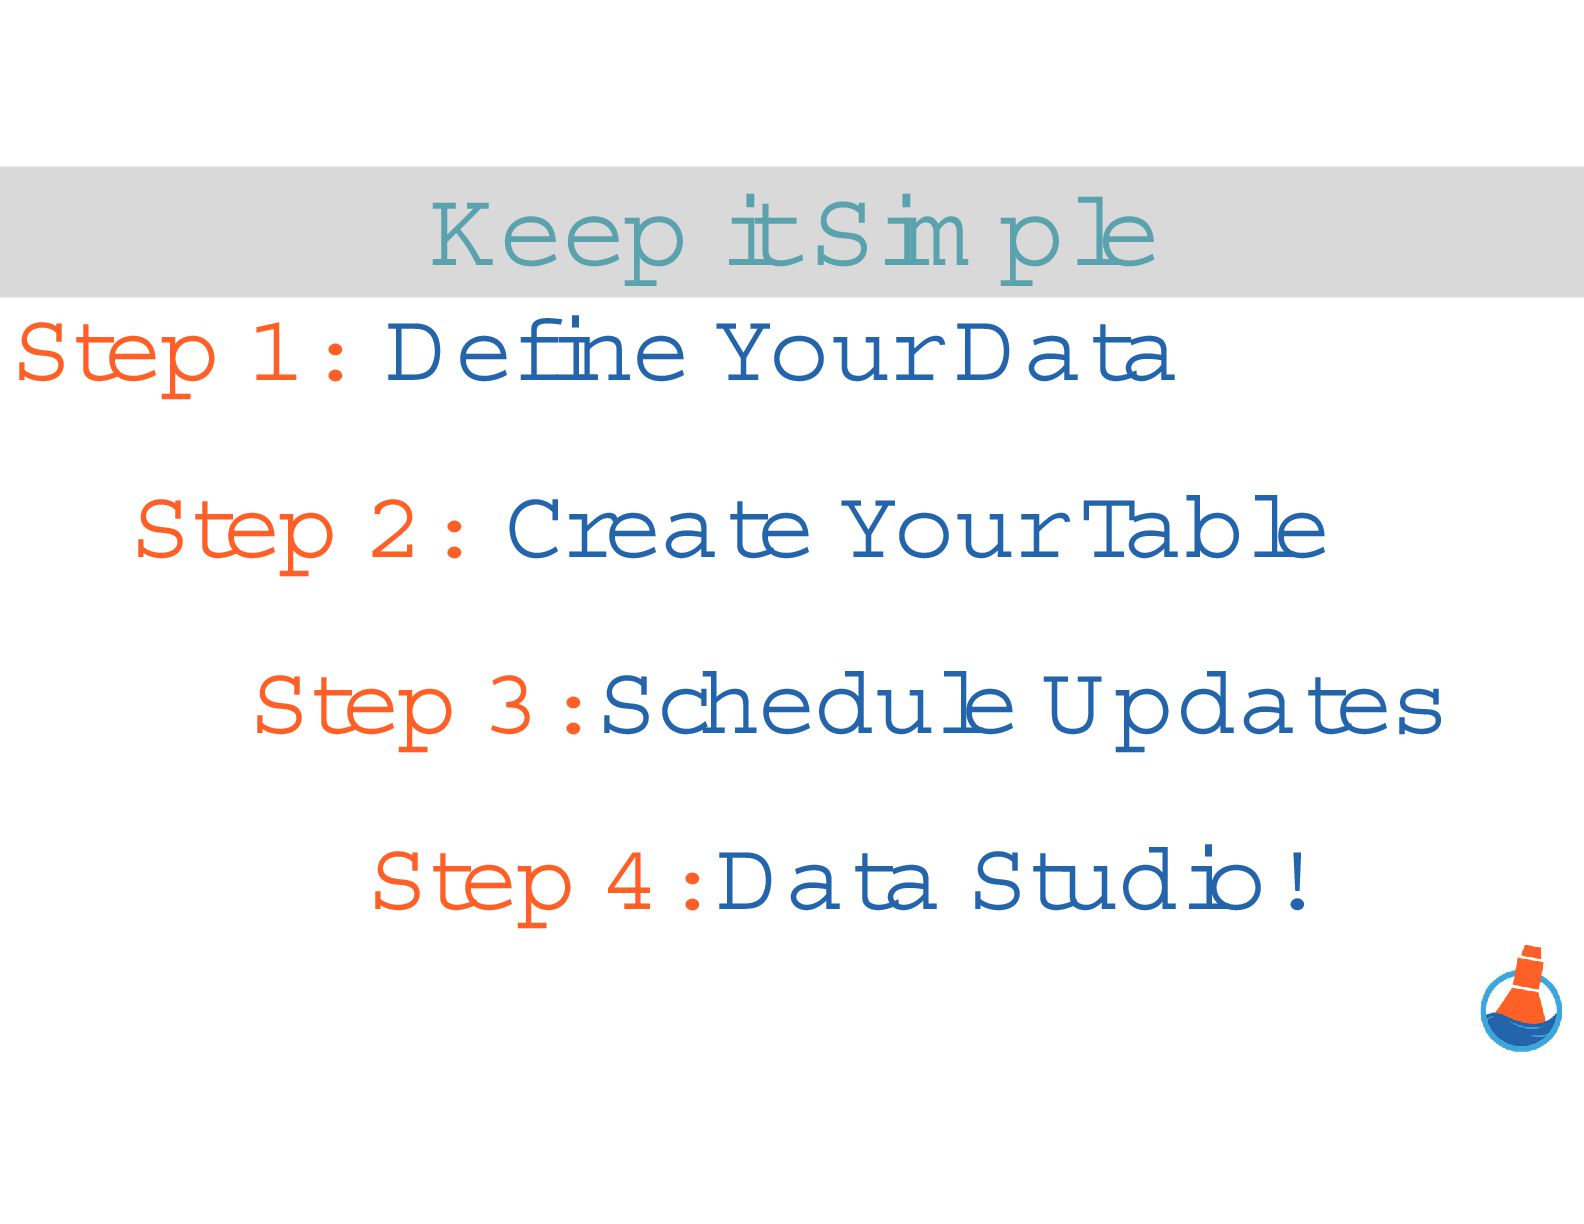
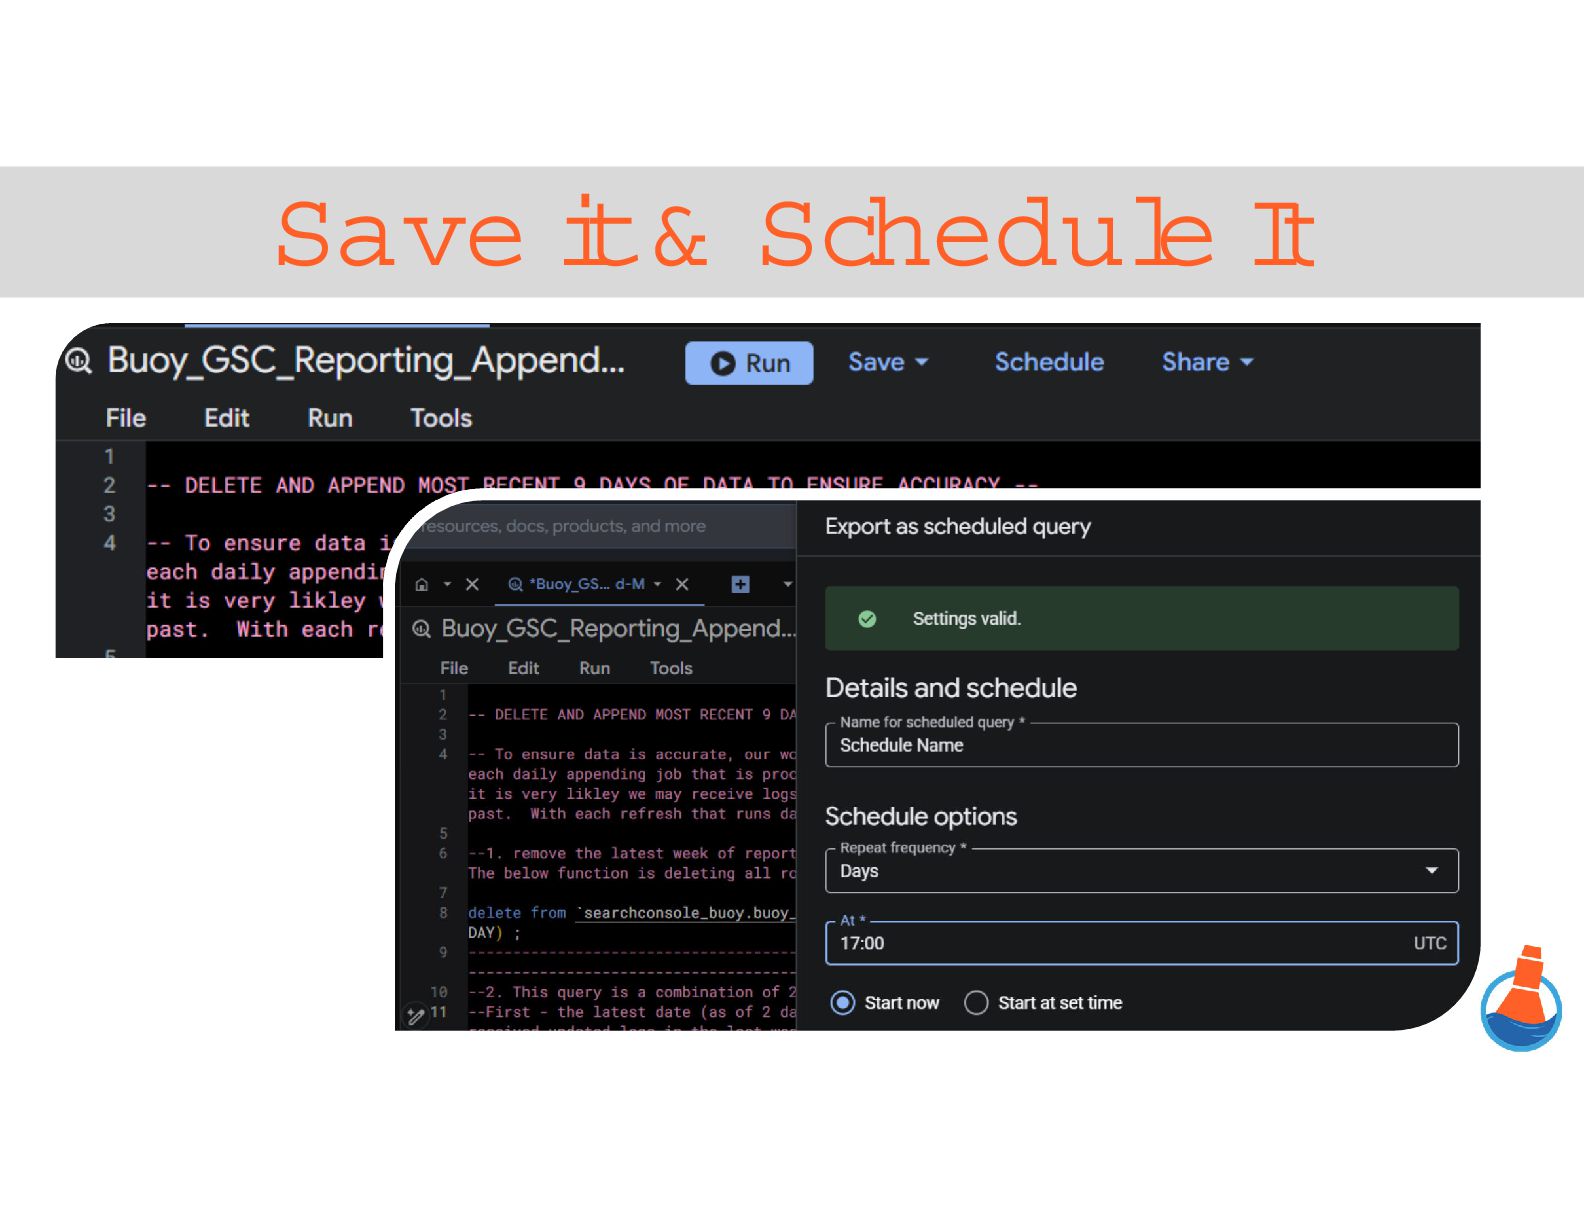
  2. Keep itSim ple Step 1: Define Your Data Step 2:

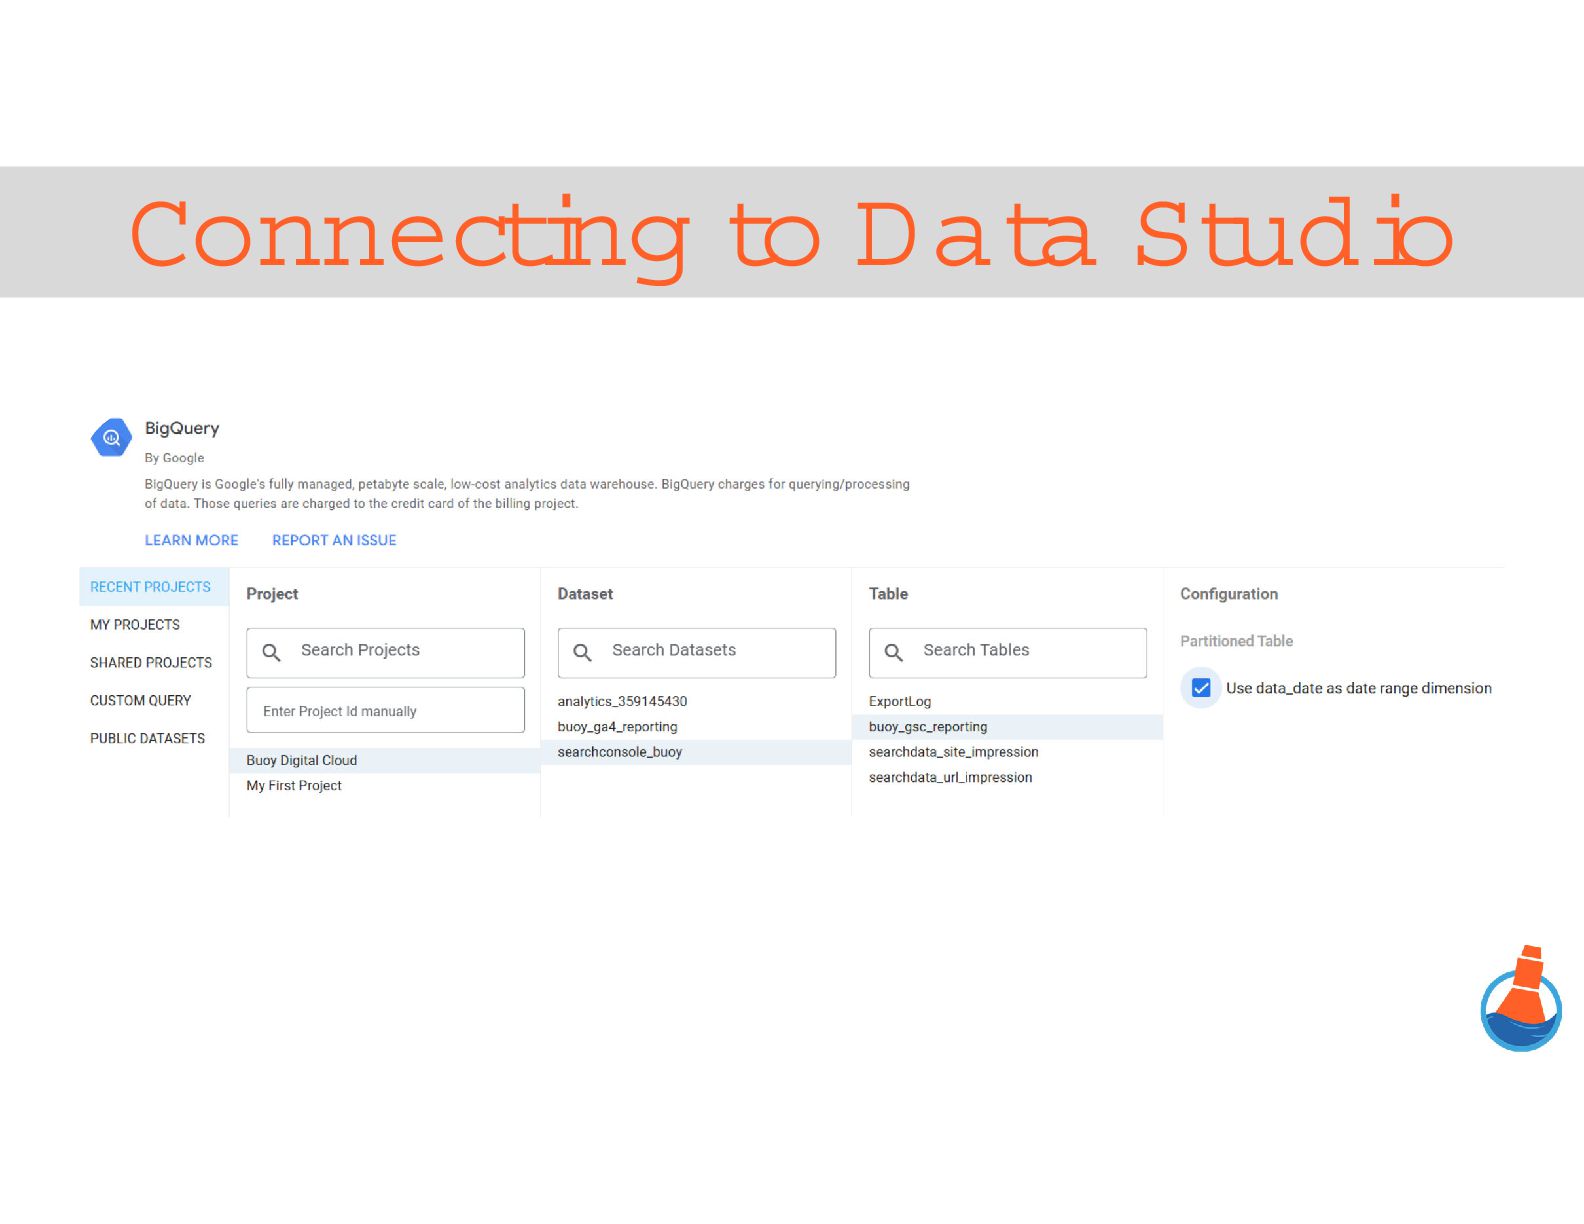
    Create Your Table Step 3:Schedule U pdates Step 4:Data Studio!
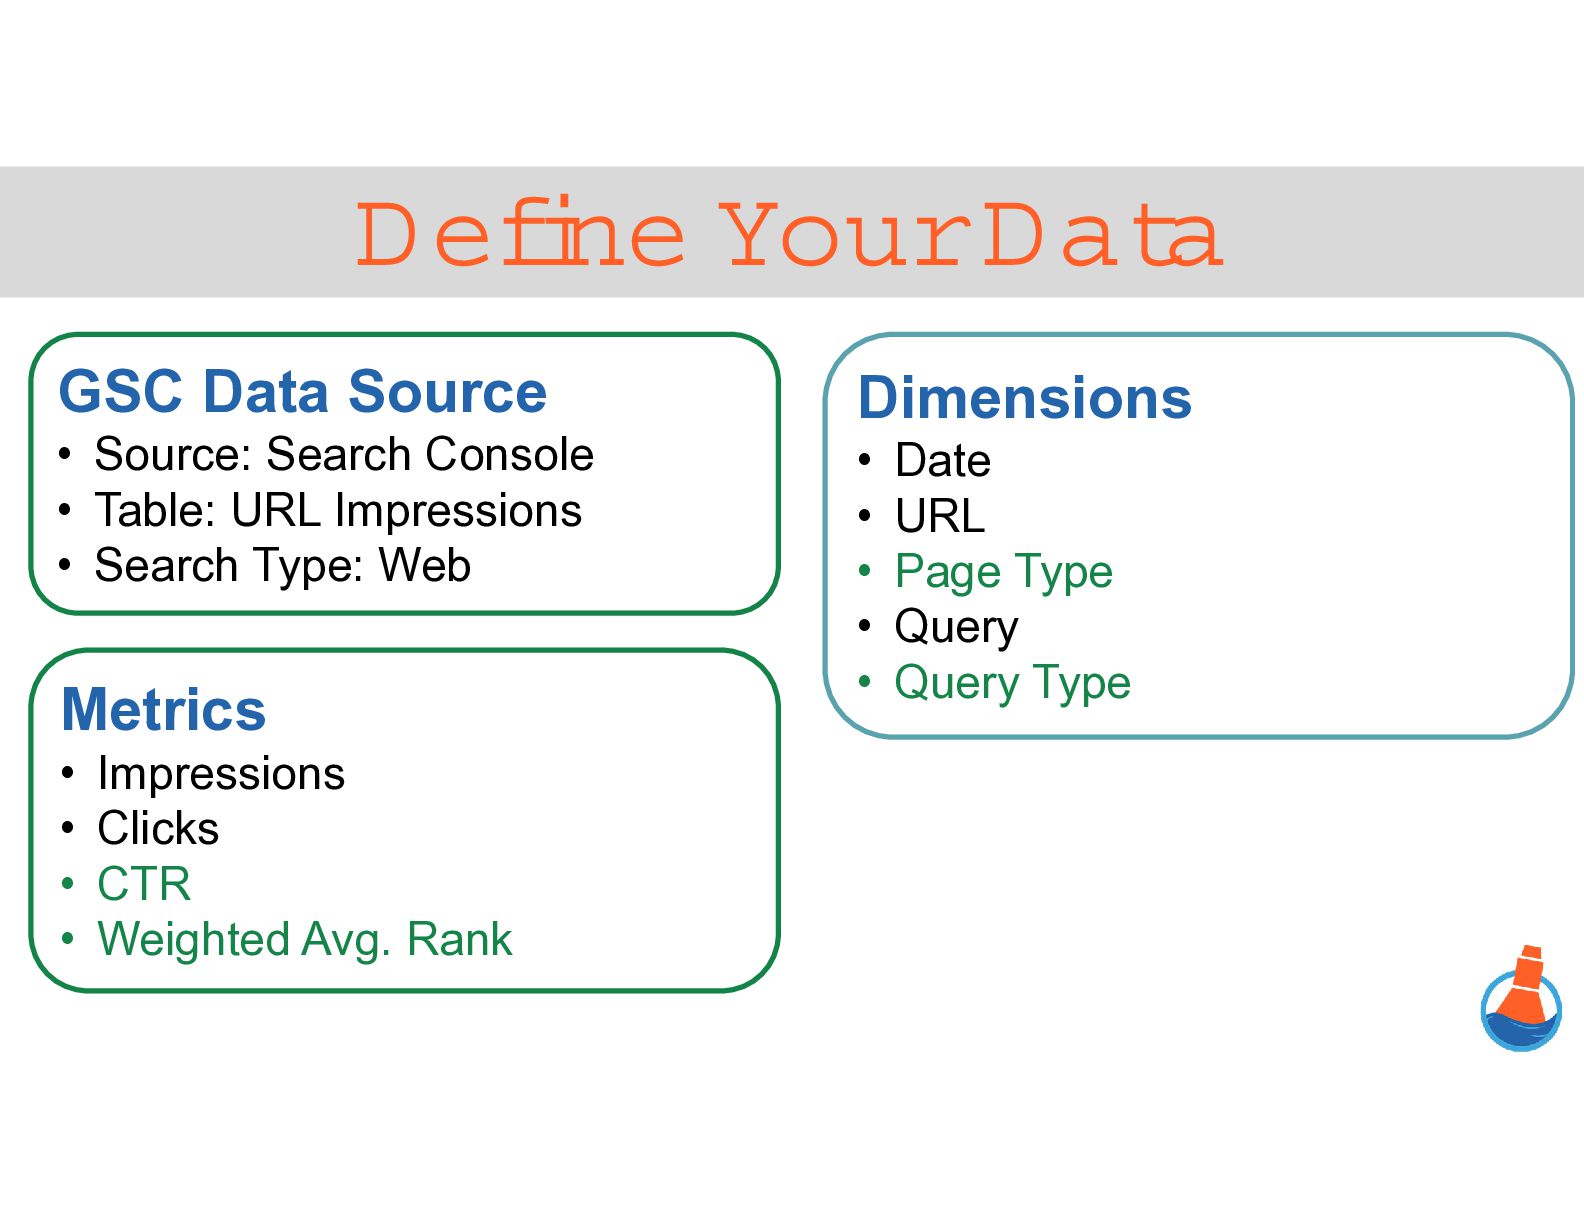
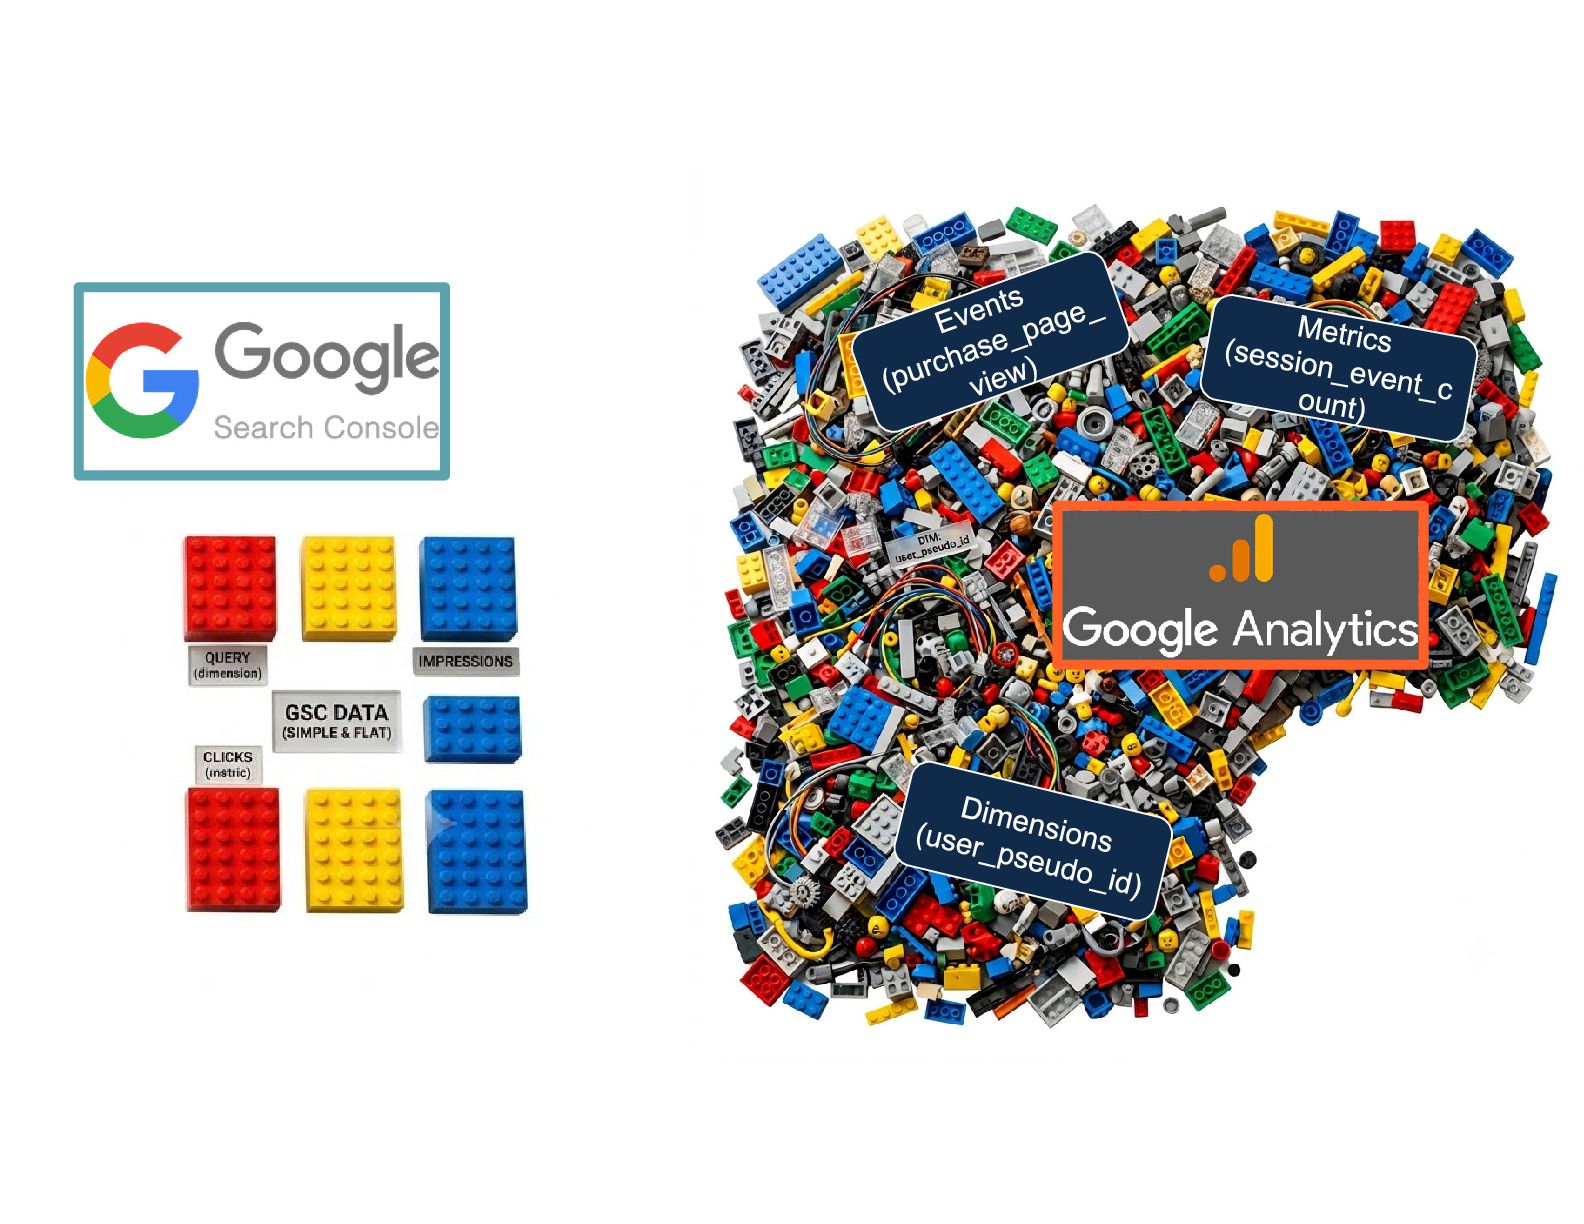
  3. Define Your Data GSC Data Source • Source: Search Console

    • Table: URL Impressions • Search Type: Web Metrics • Impressions • Clicks • CTR • Weighted Avg. Rank Dimensions • Date • URL • Page Type • Query • Query Type
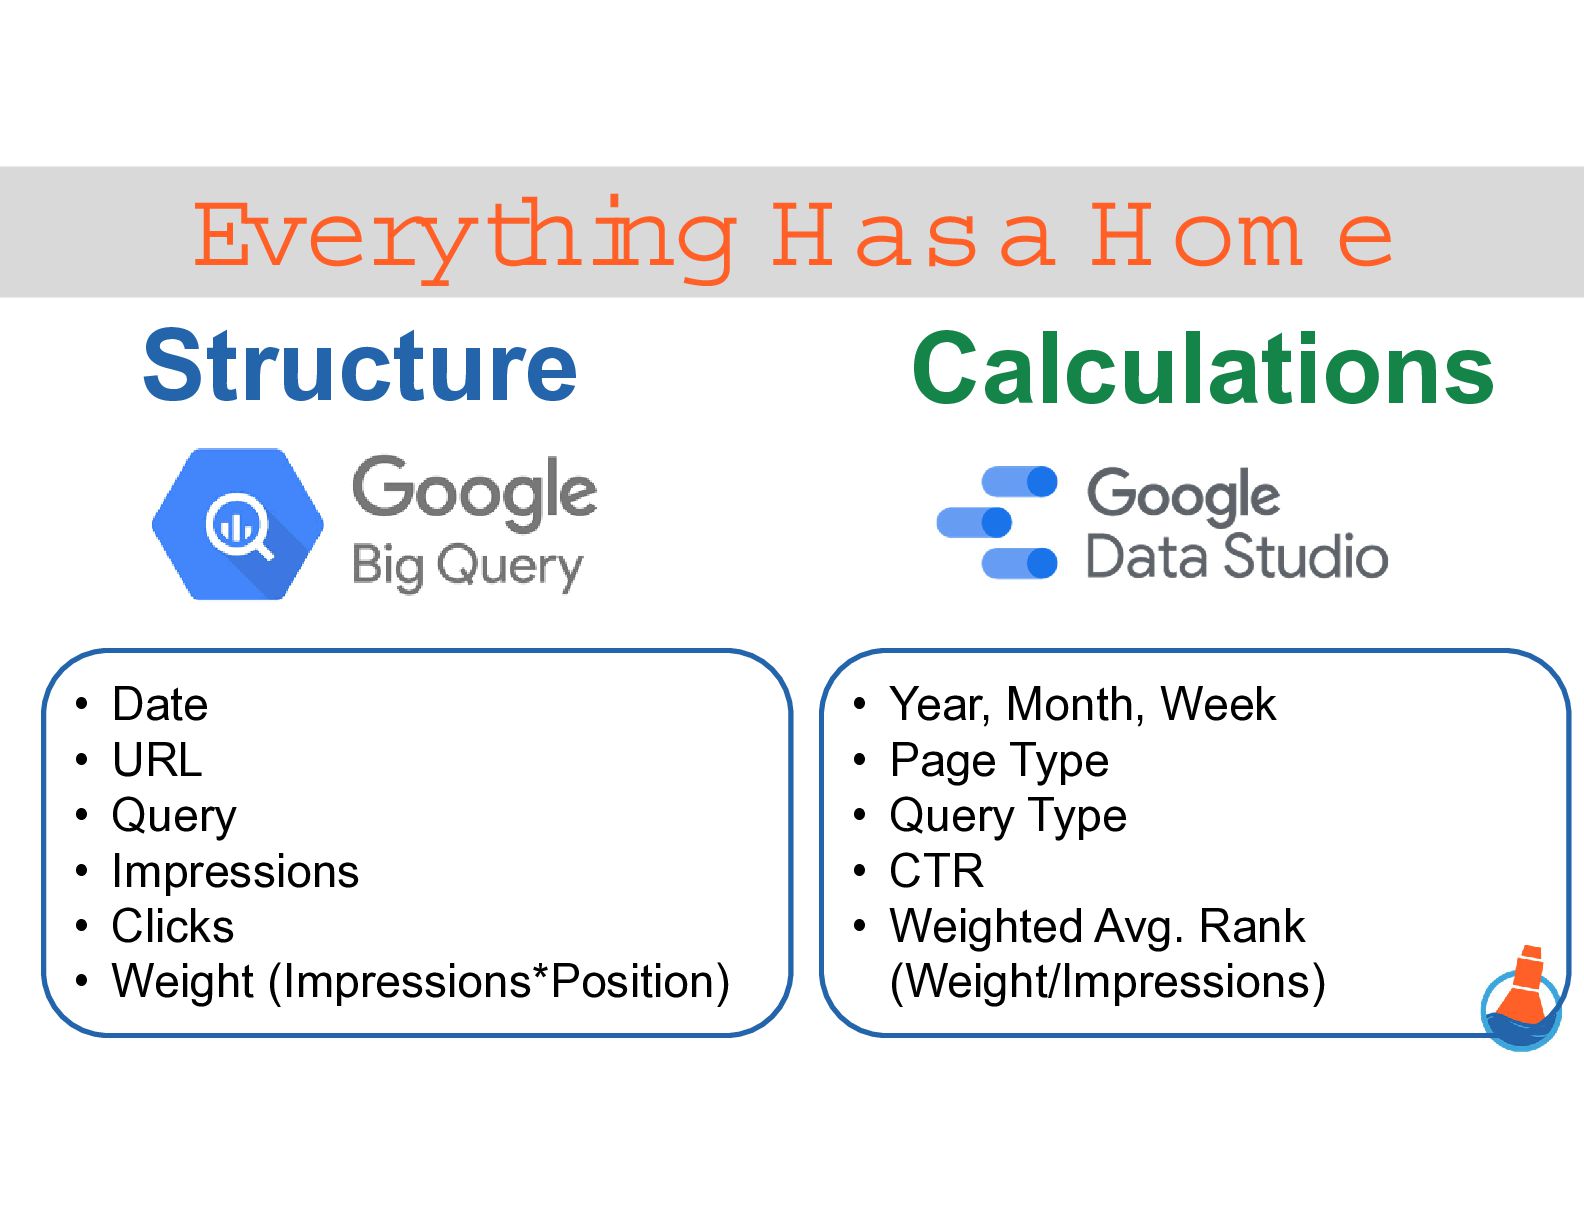
  4. Everything H as a H om e Structure • Date

    • URL • Query • Impressions • Clicks • Weight (Impressions*Position) Calculations • Year, Month, Week • Page Type • Query Type • CTR • Weighted Avg. Rank (Weight/Impressions)
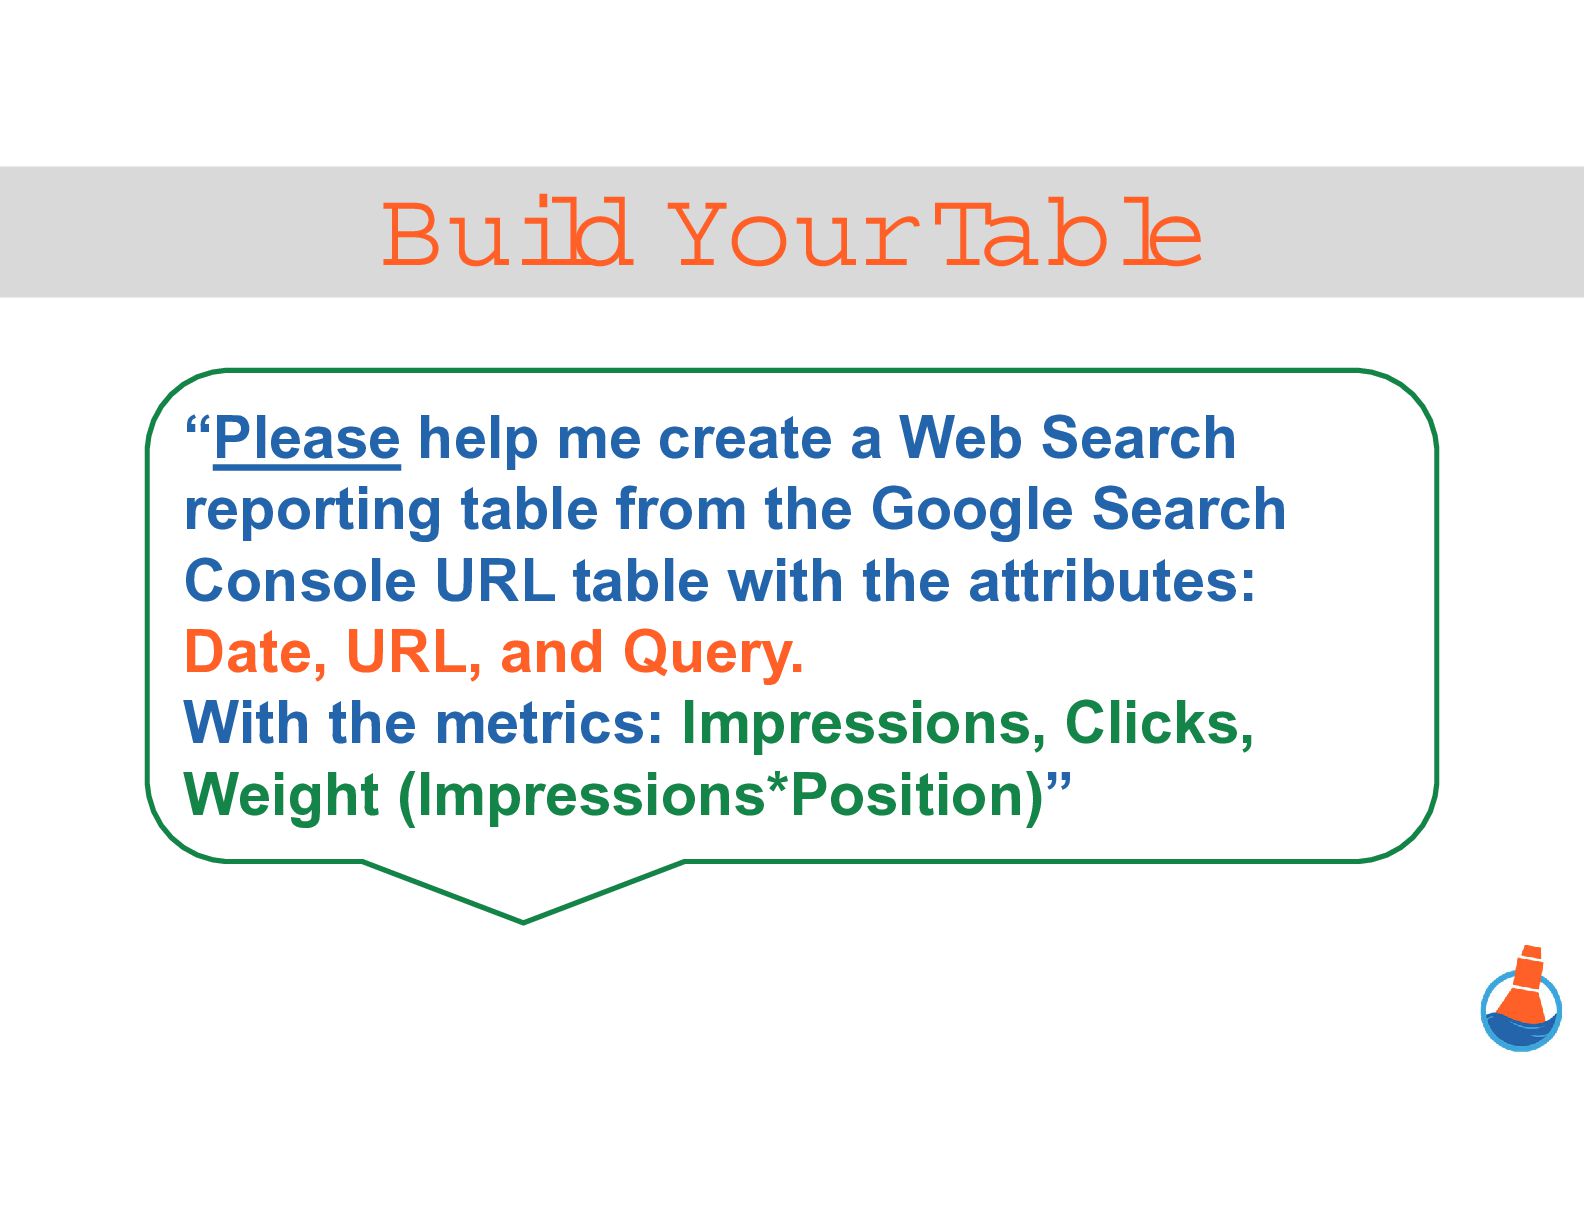
  5. Build Your Table “Please help me create a Web Search

    reporting table from the Google Search Console URL table with the attributes: Date, URL, and Query. With the metrics: Impressions, Clicks, Weight (Impressions*Position)”
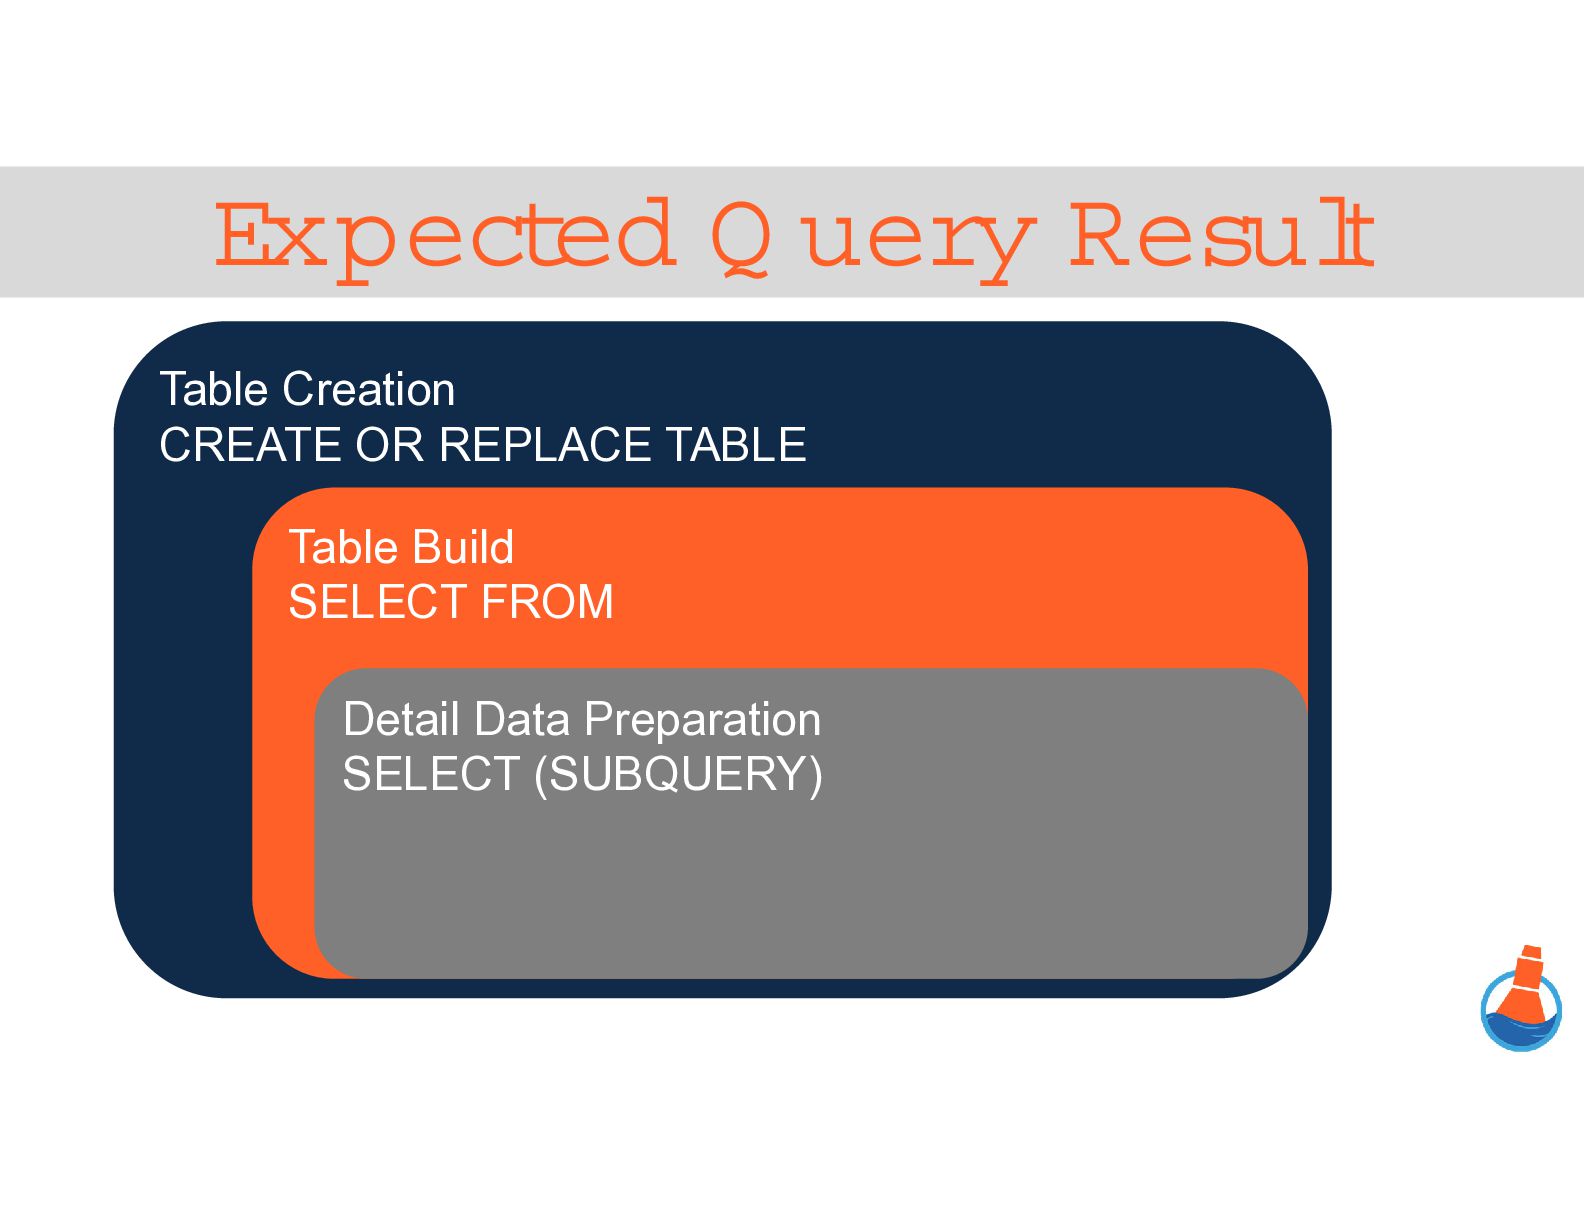
  6. Expected Q uery Result Table Creation CREATE OR REPLACE TABLE

    Table Build SELECT FROM Detail Data Preparation SELECT (SUBQUERY)
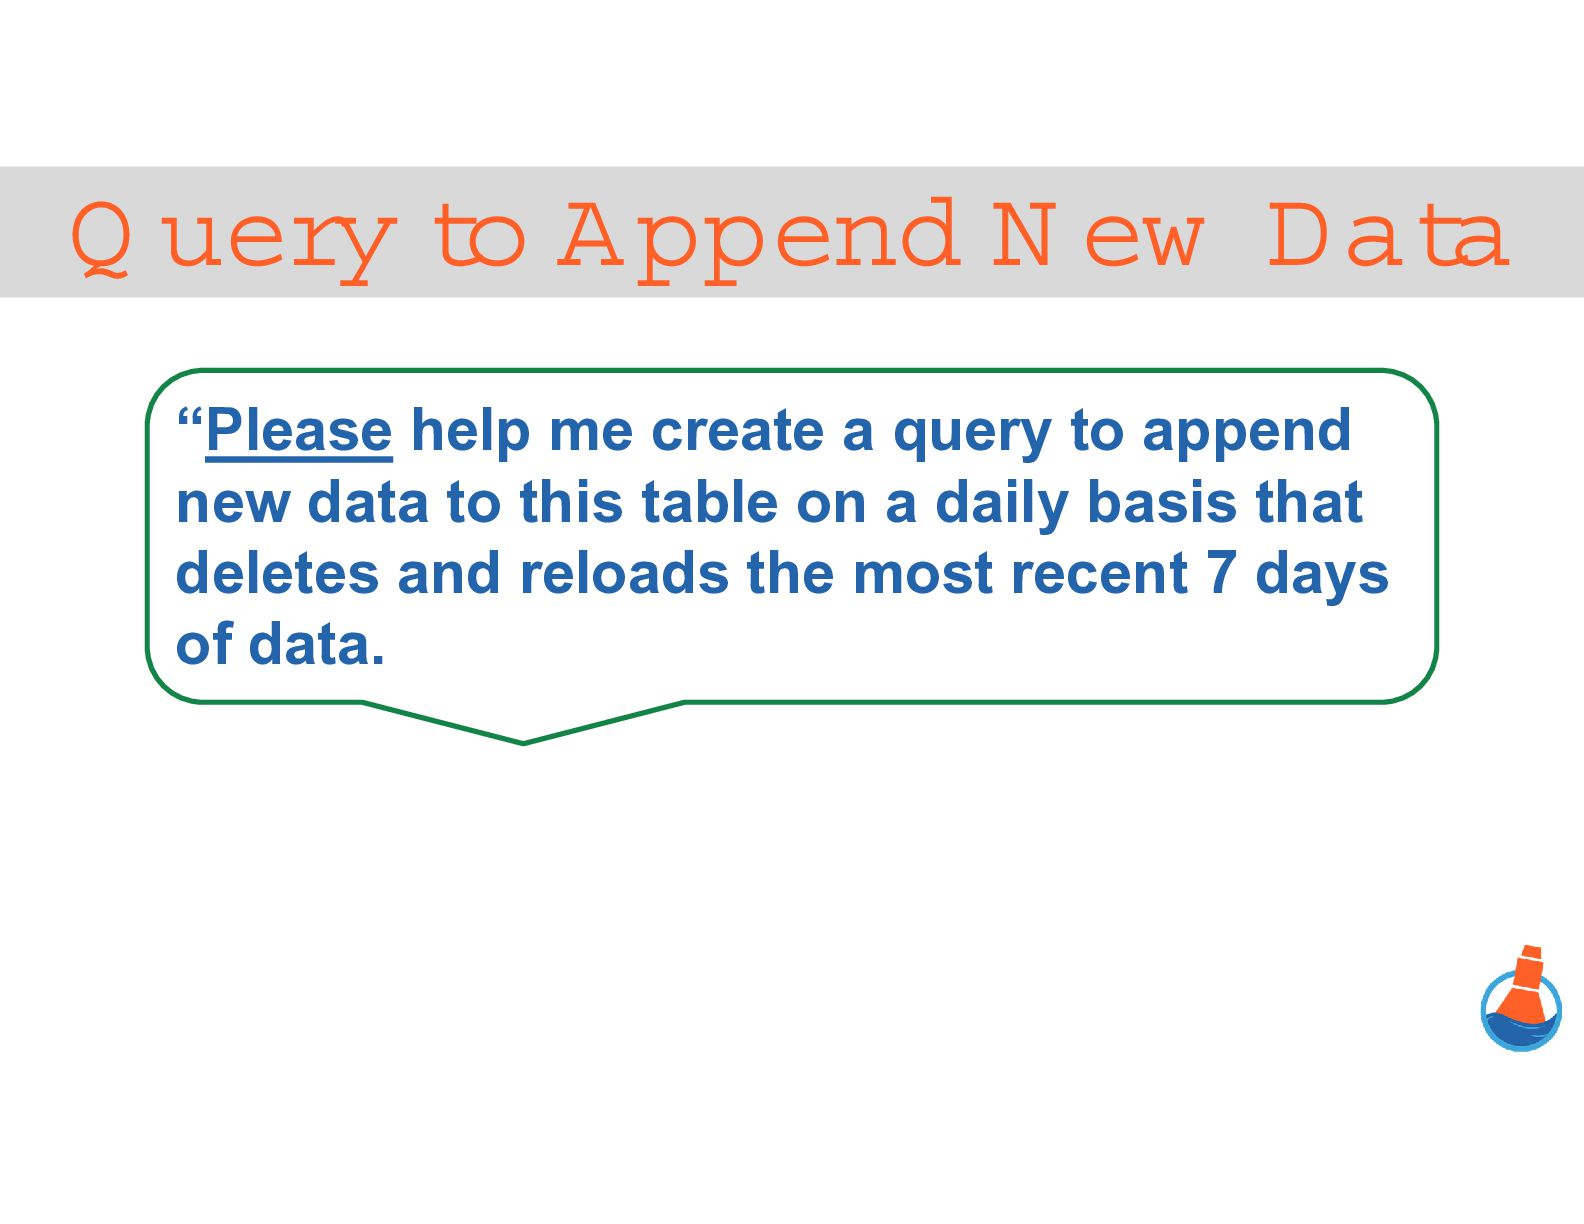
  7. Q uery to A ppend N ew Data “Please help

    me create a query to append new data to this table on a daily basis that deletes and reloads the most recent 7 days of data.
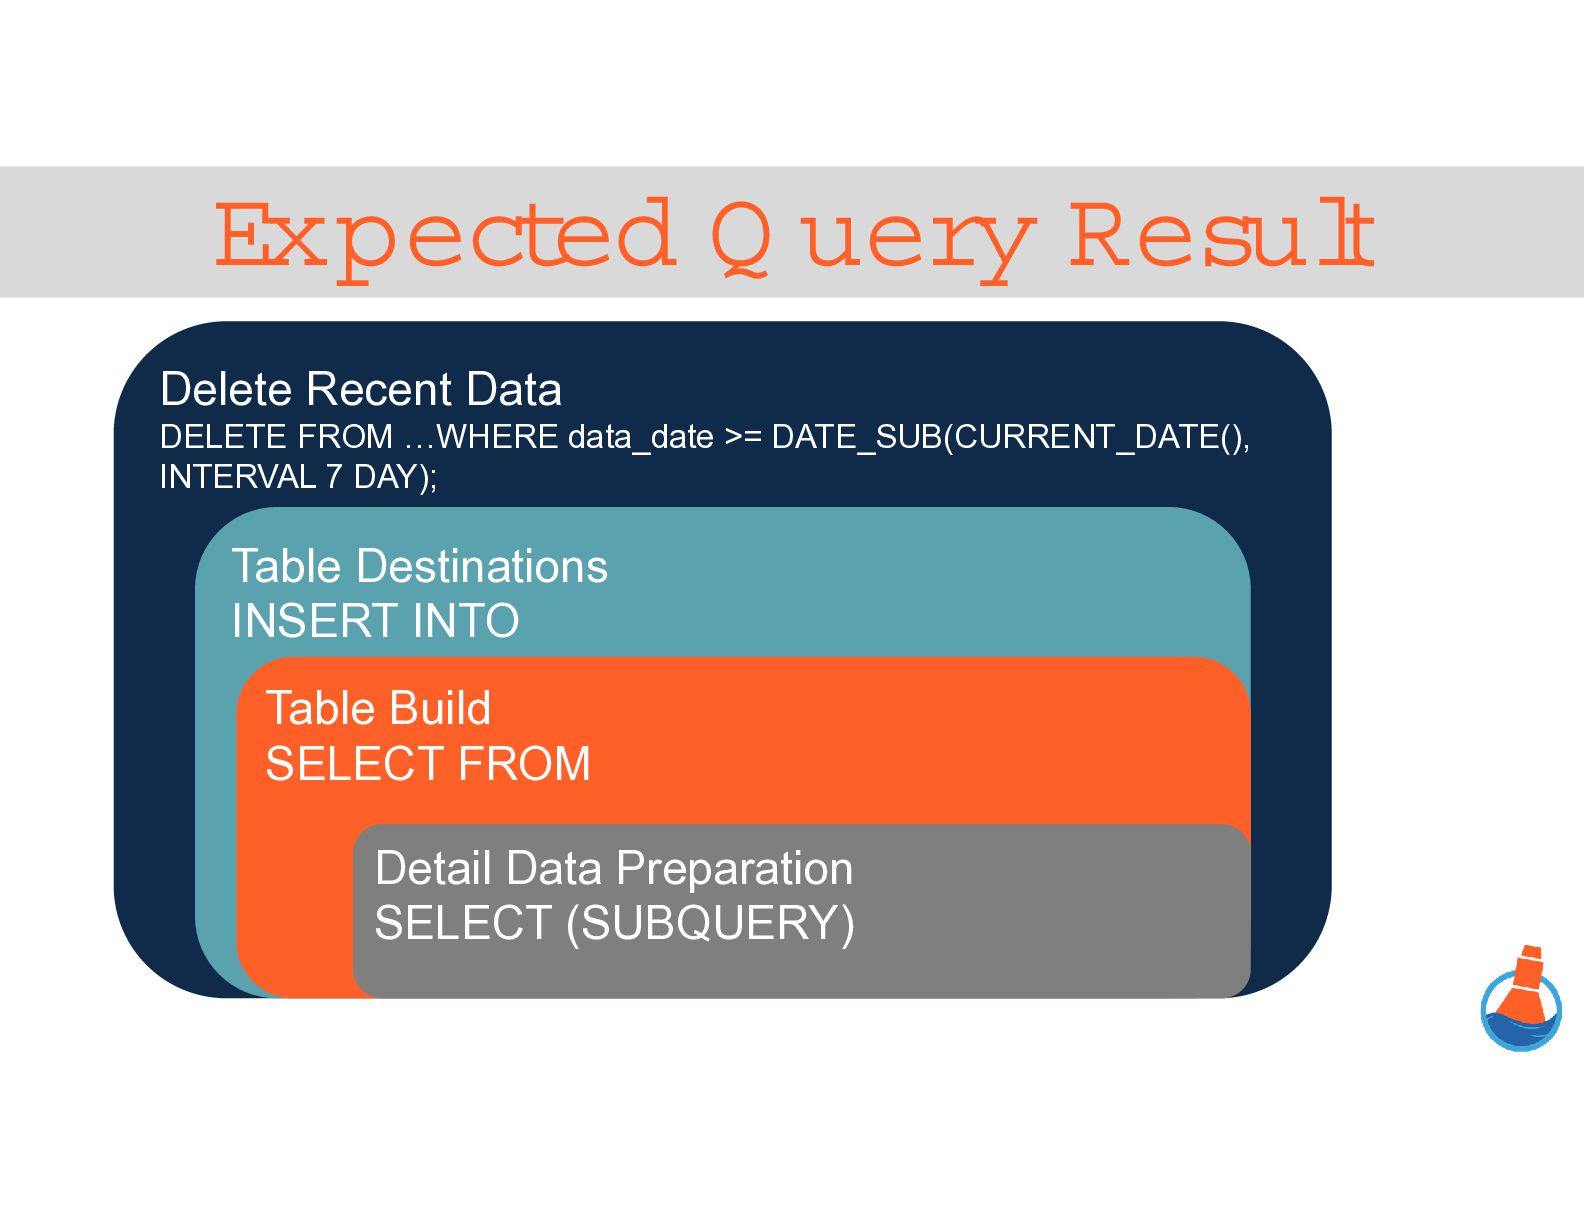
  8. Expected Q uery Result Delete Recent Data DELETE FROM …WHERE

    data_date >= DATE_SUB(CURRENT_DATE(), INTERVAL 7 DAY); Table Destinations INSERT INTO Table Build SELECT FROM Detail Data Preparation SELECT (SUBQUERY)
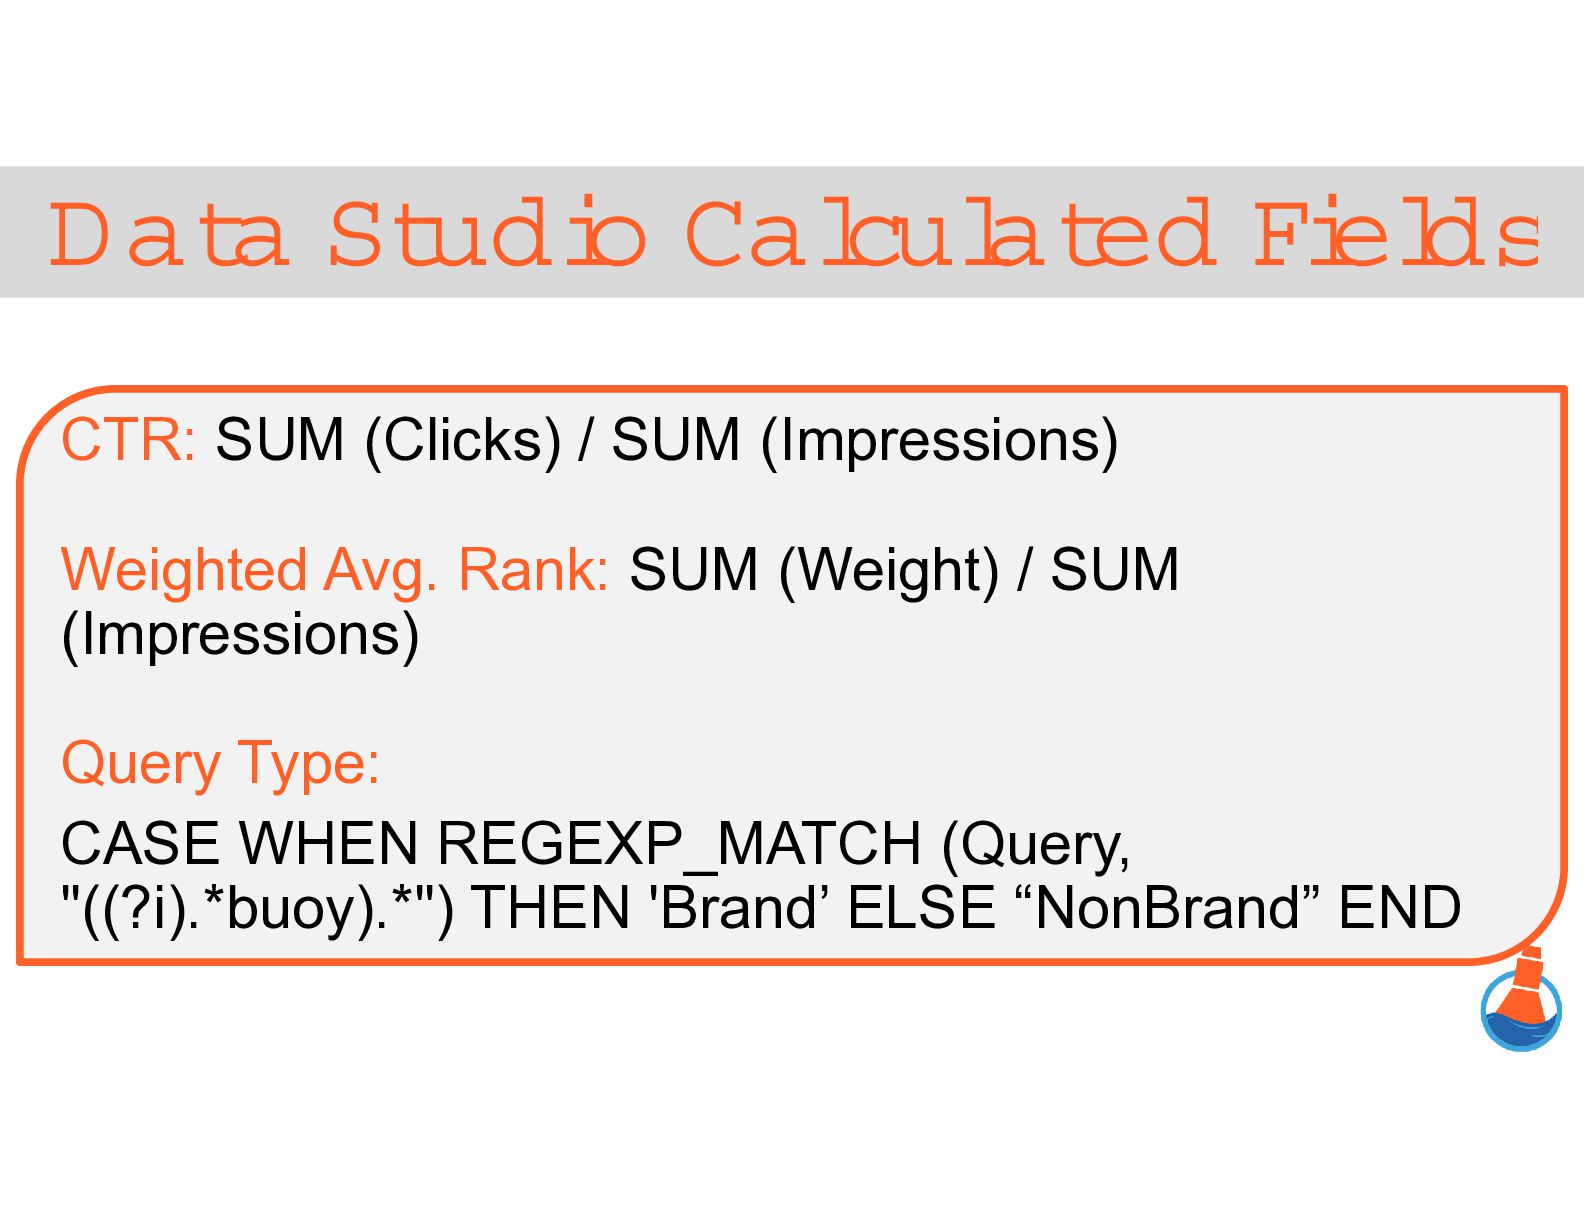
  9. Data Studio Calculated Fields CTR: SUM (Clicks) / SUM (Impressions)

    Weighted Avg. Rank: SUM (Weight) / SUM (Impressions) Query Type: CASE WHEN REGEXP_MATCH (Query, "((?i).*buoy).*") THEN 'Brand’ ELSE “NonBrand” END
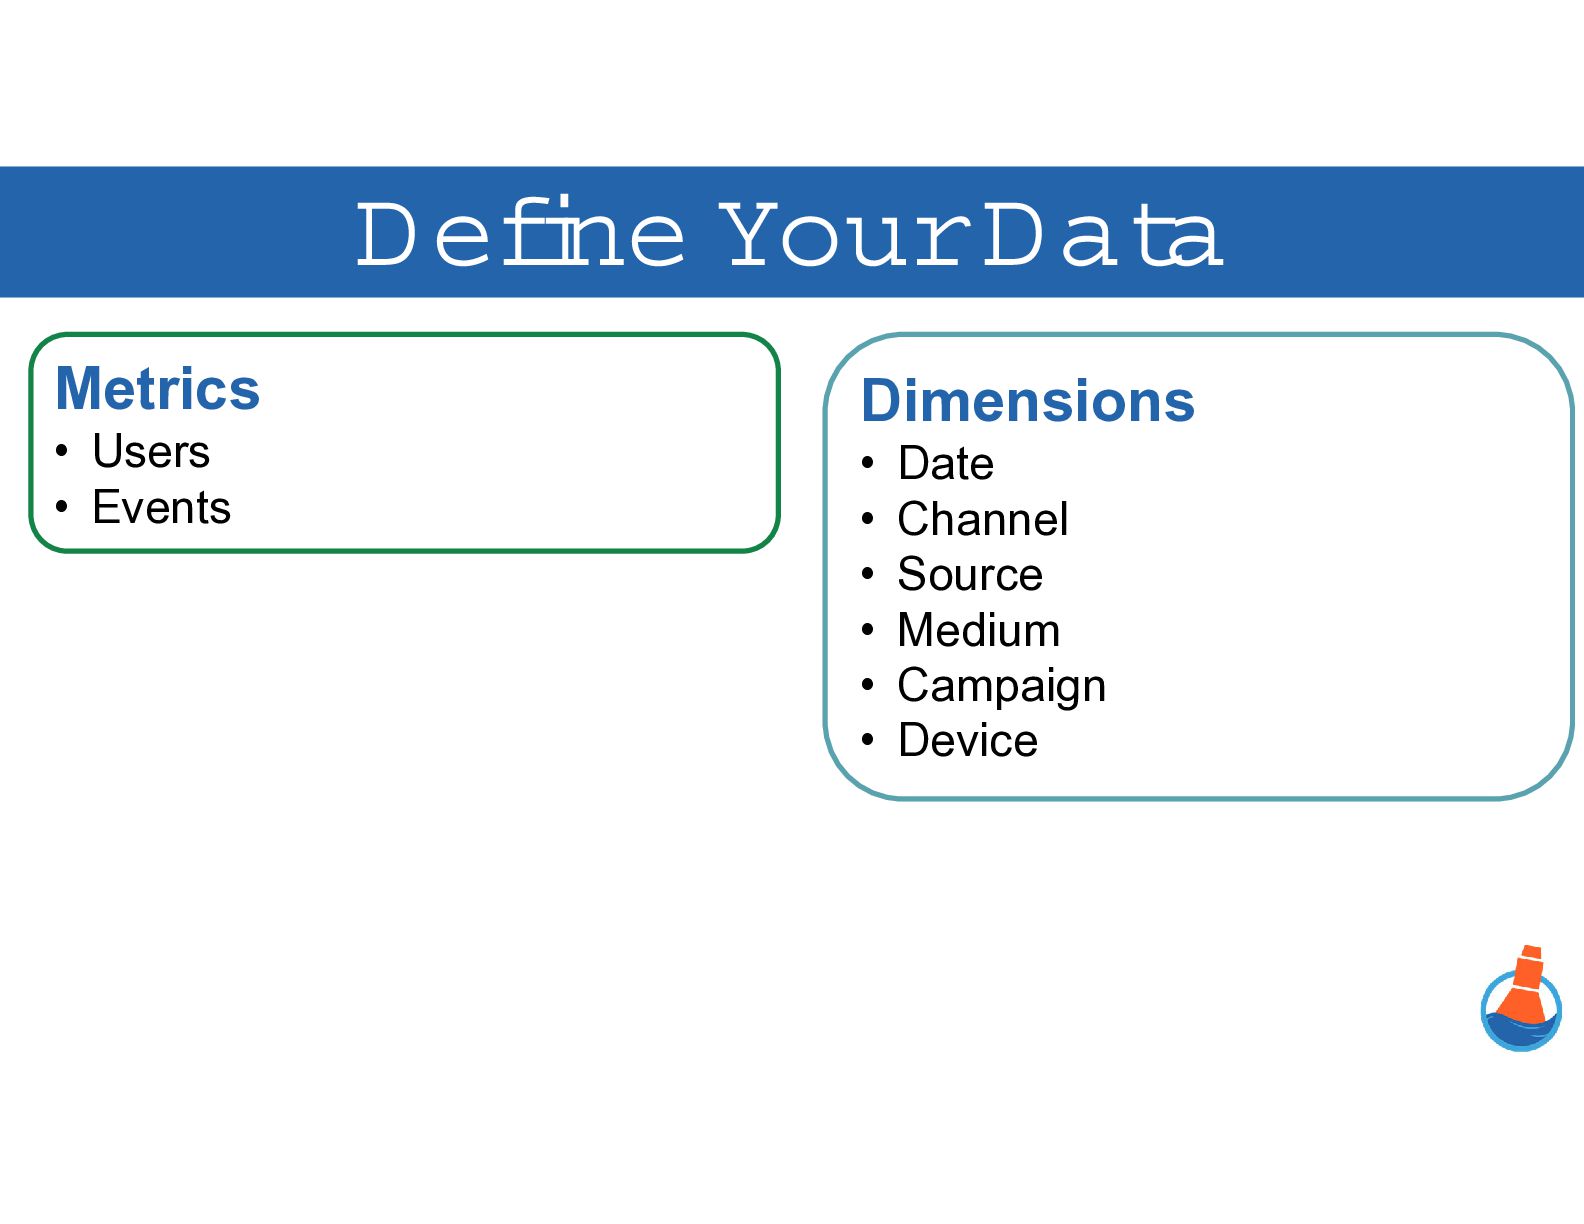
  10. Define Your Data Metrics • Users • Events Dimensions •

    Date • Channel • Source • Medium • Campaign • Device
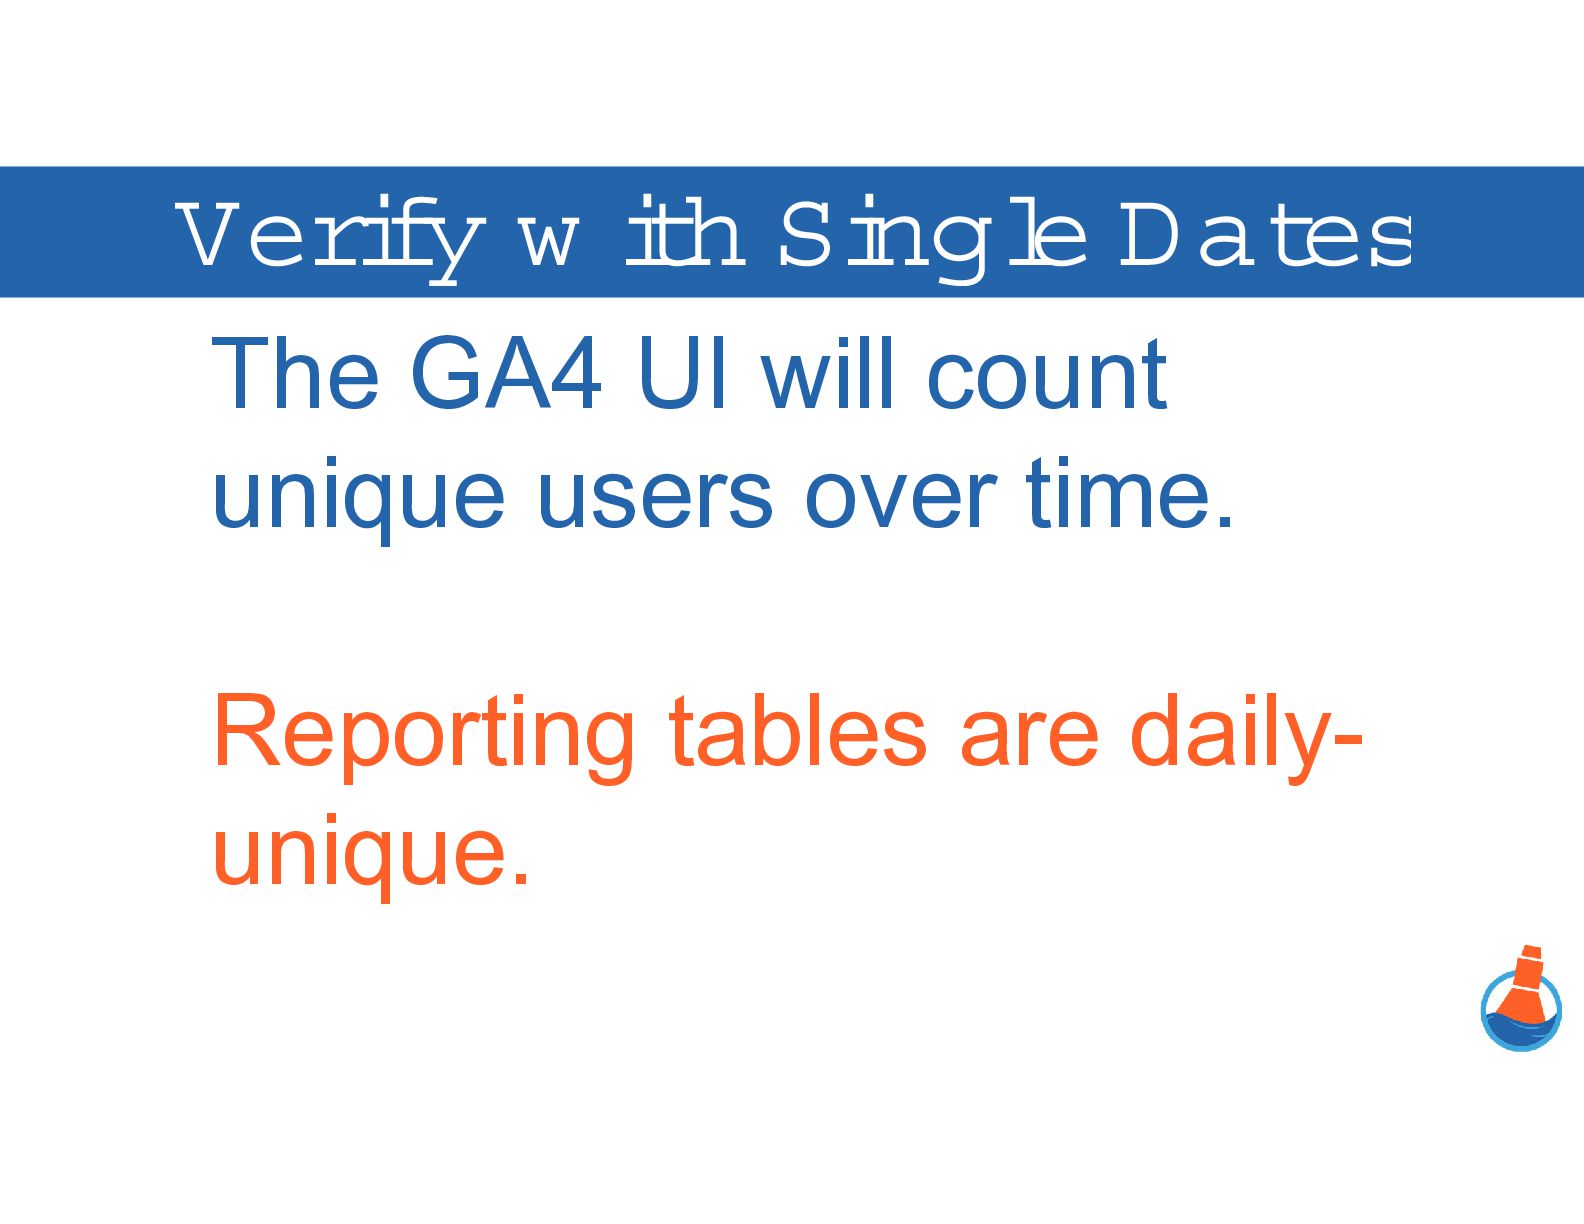
  11. Verify w ith Single Dates The GA4 UI will count

    unique users over time. Reporting tables are dailyunique.
  12. Key Takeaways: 1. You (and AI) Can Do This! 2.

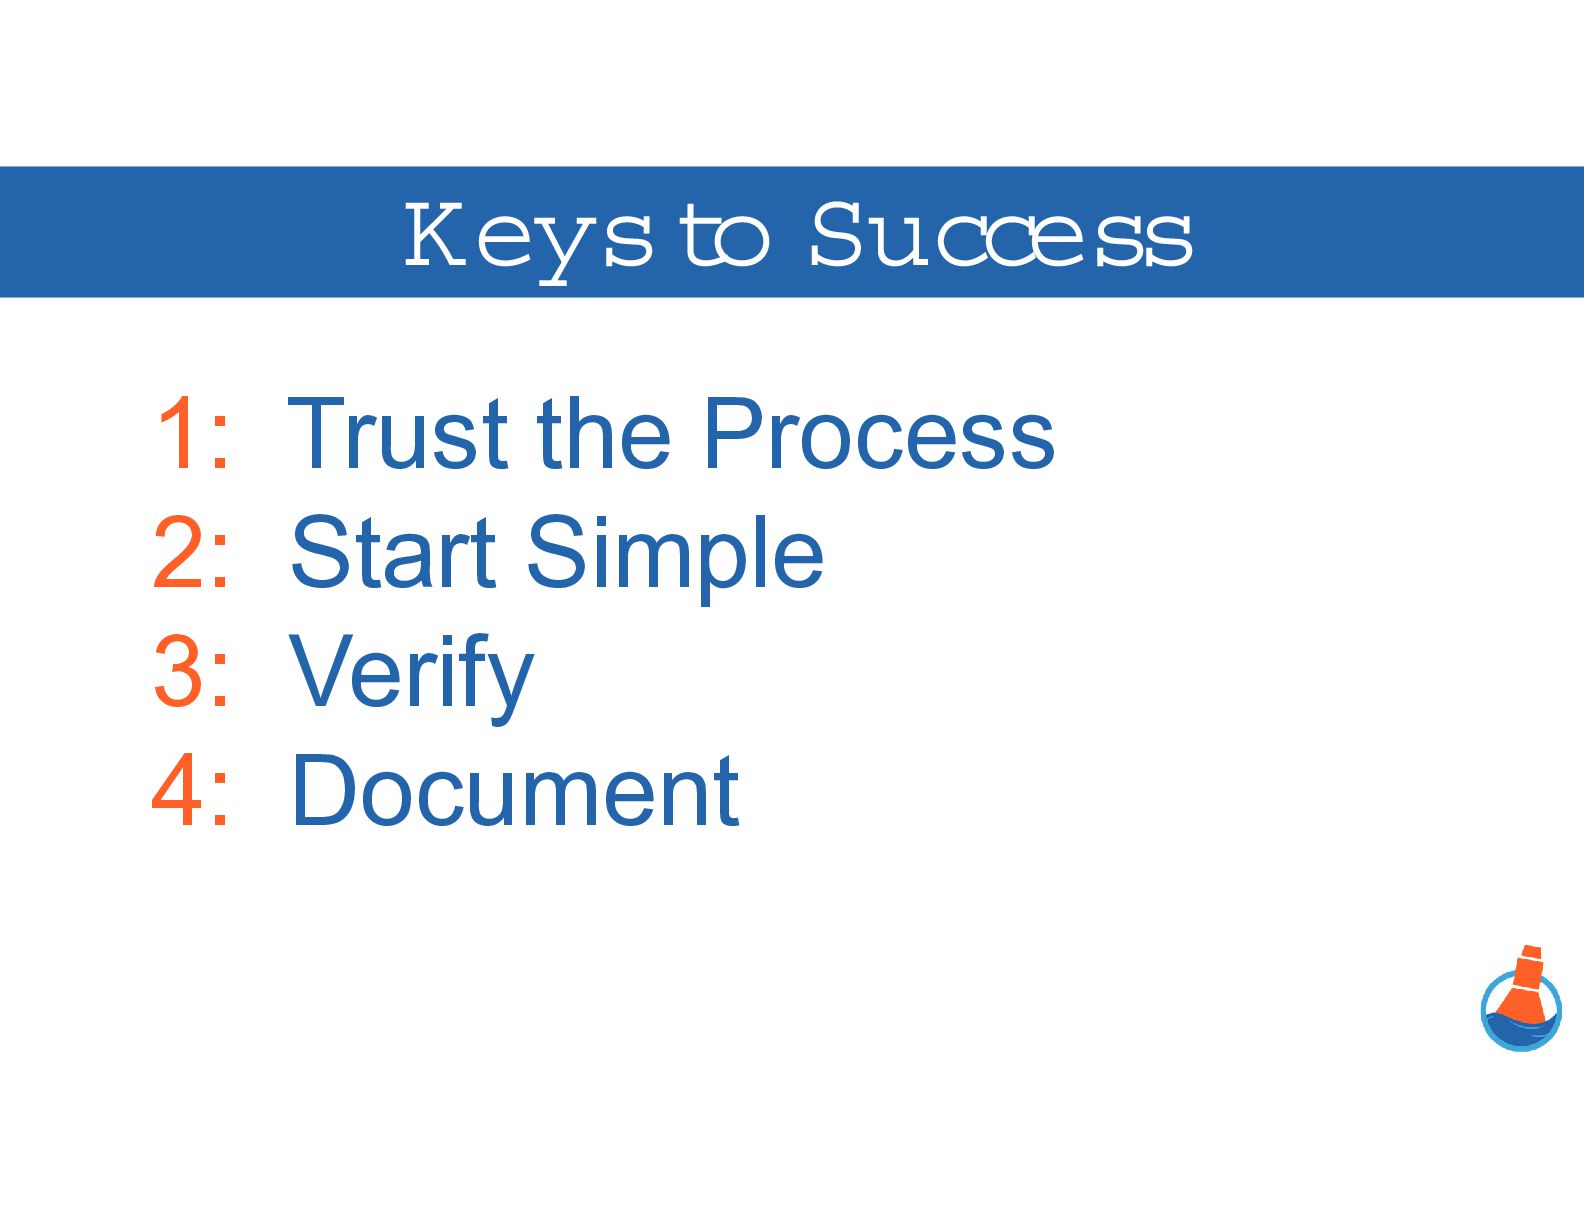
    Trust AND Verify AI 3. Start Simple 4. Save Your Work!