Upgrade to Pro — share decks privately, control downloads, hide ads and more …

PhD Thesis Talk

PhD Thesis Talk

Slides from my astronomy PhD Thesis Defense at the University of Washington.

For a video of the talk, see:
https://vimeo.com/133258086

James Davenport

July 10, 2015
Tweet

More Decks by James Davenport

Other Decks in Science

Transcript

  1. Spots and Flares: Stellar Activity in the Time Domain Era

    James R. A. Davenport University of Washington Department of Astronomy 1 "If the Sun did not have a magnetic field, it would be as uninteresting a star as most astronomers believe it to be." -R. B. Leighton PhD Final Exam 2015-July-10
  2. Spots and Flares: Stellar Activity in the Time Domain Era

    2 First: a short story about spots, flares, and magnetic activity
  3. 6 Raises many important questions! • How often do these

    giant spots appear? • How long do they live? • How often do huge flares happen? • Could they affect life? • What can spots & flares tell us about a star? • Are spots & flares on other stars the same? • How do they change over (astronomical) time?
  4. 9 Stellar Age versus Activity Level Lyra (2005) log Ca

    II Flux log age (yrs) ACTIVE! inactive Sun
  5. 13

  6. 14 Largest sunspot observed in “modern” times Hoge 1947, Mt.

    Wilson Observatory by-eye observation by G.W.
  7. Strassmeier (1999) • Observed across range of 
 mass, evolutionary

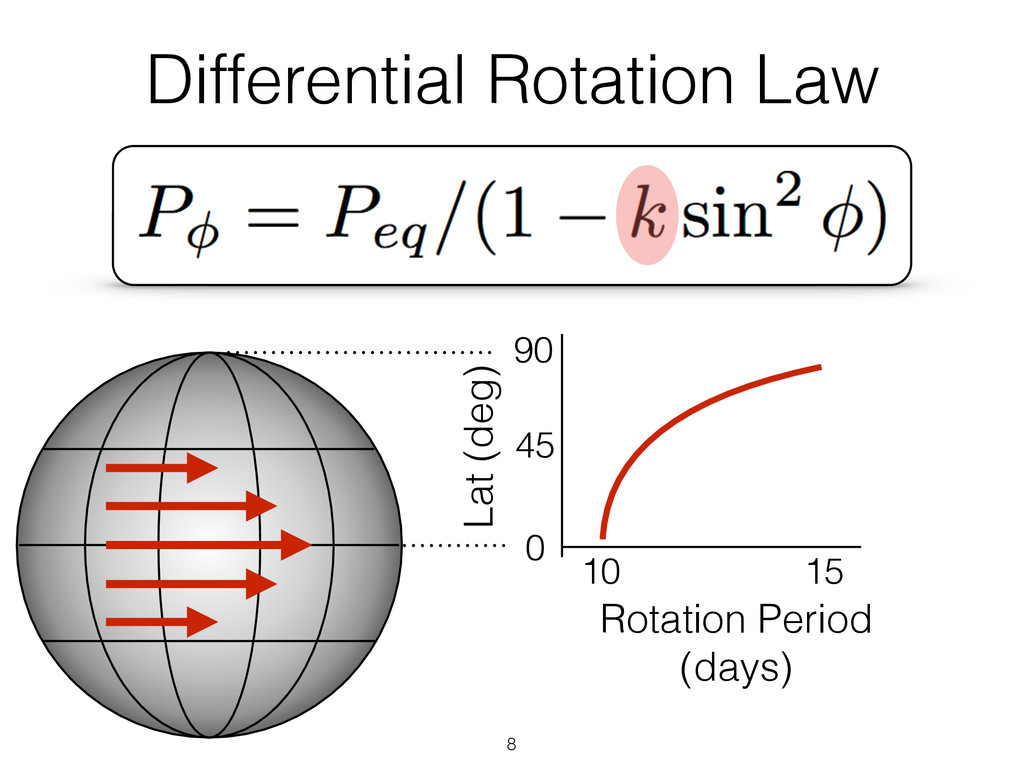
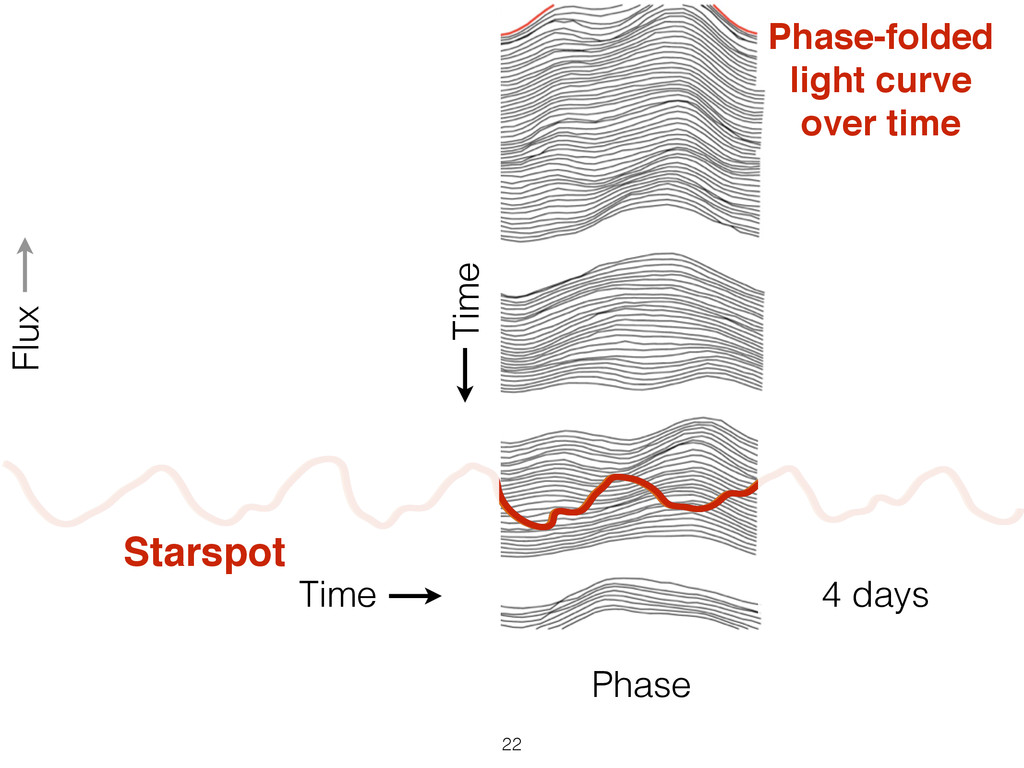
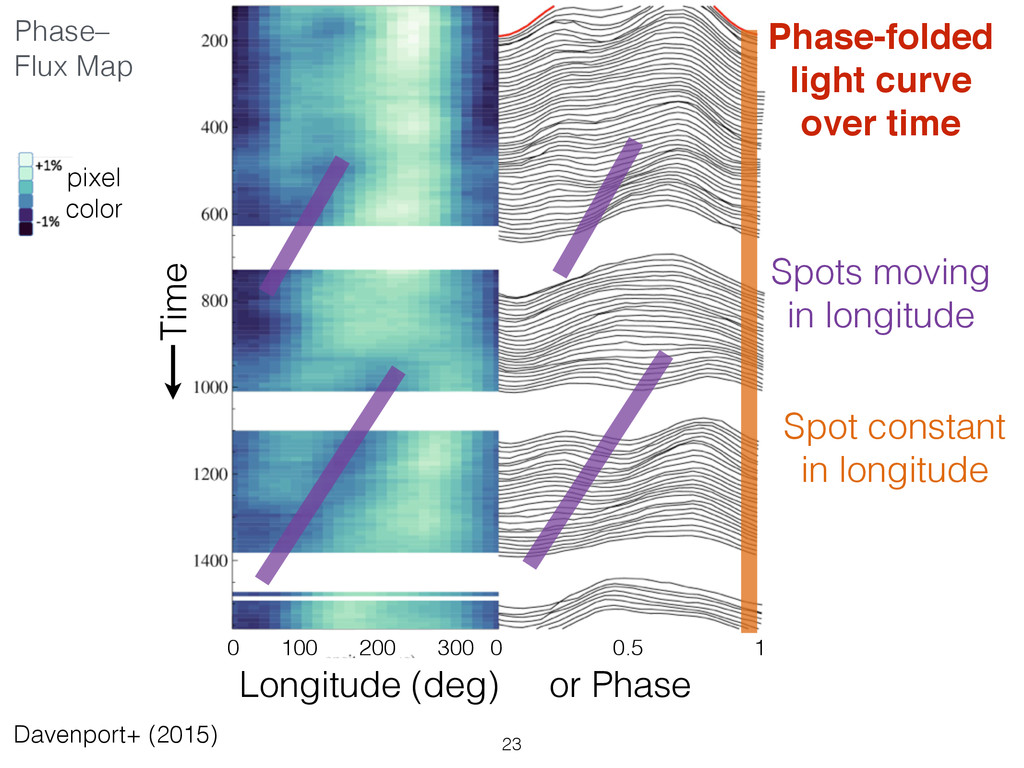
    phase
 • Evolve on timescales from 
 days to years (perhaps longer!)
 • Trace surface B field geometry,
 rotation, differential rotation Starspots: a generic result of B fields SDO Carroll (2012) 15
  8. – Stellar rotation rate – Spot sizes
 – Differential rotation

    rate – Spot Lifetimes
 – Stellar activity stellar cycles – Evolution of spots with stellar age 16 Starspots: Parameters/Physics of Interest
  9. – Stellar rotation rate – S – Differential rotation rate

    – Spot Lifetimes – Stellar activity stellar cycles – Evolution of spots 17 Starspots: Parameters/Physics of Interest – Stellar rotation rate – Spot sizes

  10. • Get rotation period, starspot sizes • Map back to

    surface features (at least longitudes) 18 Phase / Longitude Flux Starspots with Photometry Walkowicz+ (2010)
  11. • Searching for 2nd order effects in light curve Rotation

    Period Starspot Size 19 Differential Rotation
  12. pixel color Phase– Flux Map Time Phase-folded light curve over

    time Davenport+ (2015) 23 Longitude (deg) or Phase Spots moving in longitude Spot constant in longitude 0 1 0 100 200 300 0.5
  13. Time (days) Longitude (deg) 0 360 180 -180 0 540

    25 Davenport+ (2015) Phase– Flux Map
  14. 26 Time (days) Longitude (deg) 0 360 180 -180 0

    540 Chop light curve in to time windows Davenport+ (2015)
  15. Relative Flux Phase Fit for spot positions in each window

    Rotation Direction Phase 27 Davenport+ (2015) Relative Flux
  16. 28 Longitude (deg) 360 180 -180 0 540 Time (days)

    Davenport+ (2015) Each pair of points = window with full MCMC solution!
  17. 29 Longitude (deg) 360 180 -180 0 540 Time (days)

    Davenport+ (2015) Differential Rotation “Equator-Lap-Pole” times of ~1500 days 10x slower than on Sun!
  18. Longitude (deg) 360 180 -180 0 540 Time (days) Spot

    lifetimes:150-500 days for 2nd spot many years for 1st spot 30 Davenport+ (2015)
  19. Reiners (2006) Collier Cameron (2007) Küker & Rüdiger (2011) @jradavenport

    GJ 1245 B GJ 1245 A Lurie+ (2015) GJ 1243 Davenport+ (2015) 31 Diff. Rot. rate
  20. Part 2: Starspots + Transits 32 Lessons learned from GJ

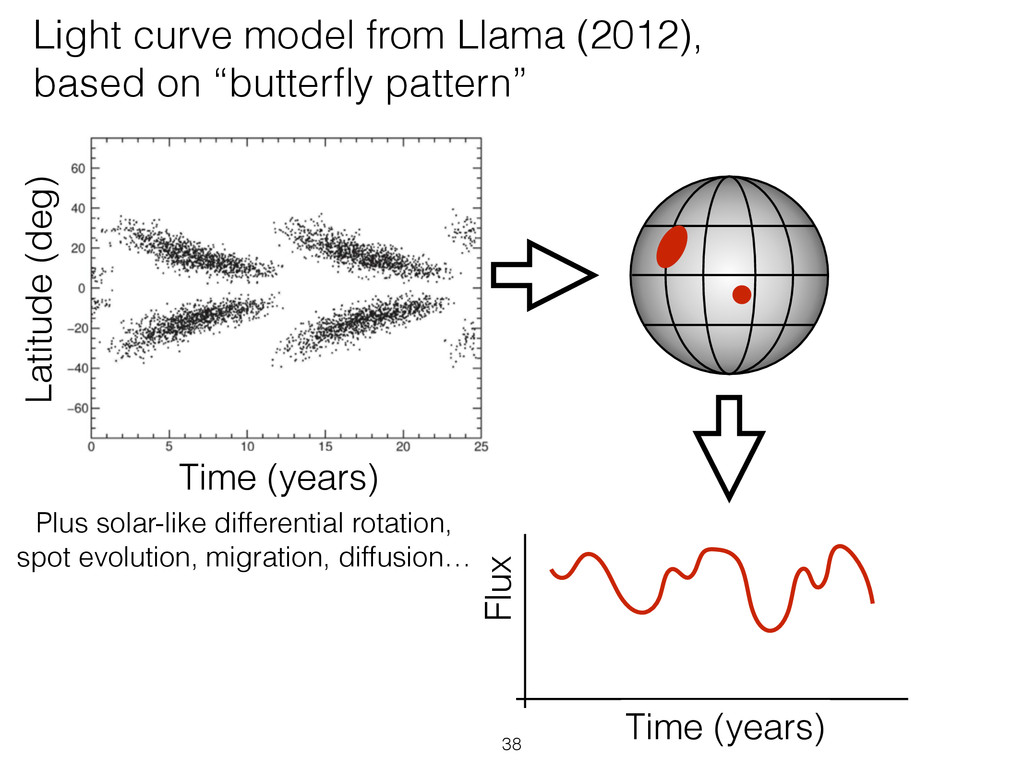
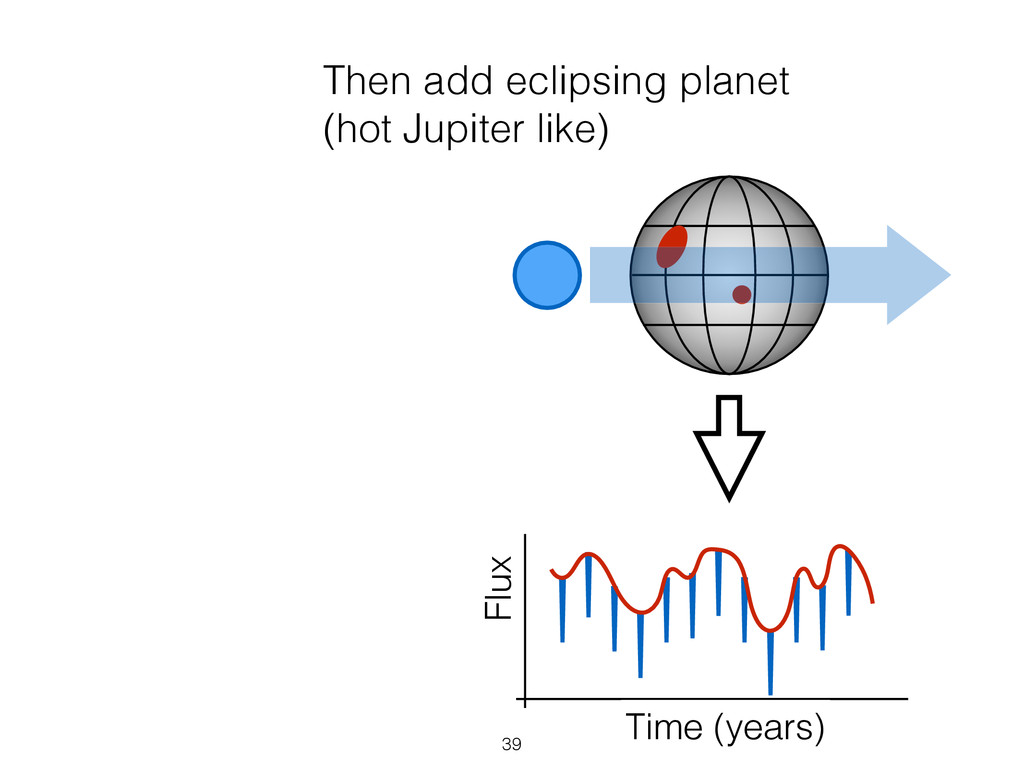
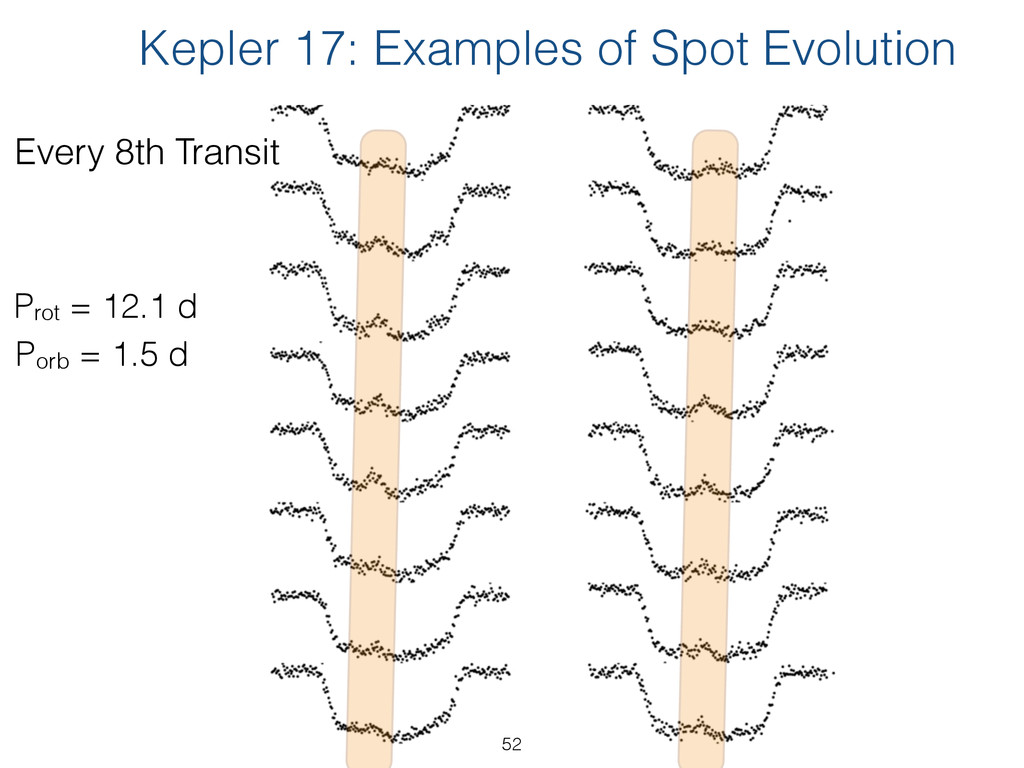
    1243 analysis: • very hard to constrain latitude of starspots • can only track 2 (maybe 3) starspots • can only track very slow evolution • how dark (cool) to make the spots? Transits help with many of these problems!
  21. Kepler 63 Sanchis-Ojeda (2013) Béky (2014) Hat-P-11 Mapping starspots with

    transits, previous work TrES-1 (oklo.org) Rabus (2009) 34
  22. Phase Relative Flux 37 Want to recover: • starspot positions

    on surface • differential rotation law • starspot evolution timescales First: Test our spot-fitting code using simulated data!
  23. 38 Light curve model from Llama (2012), based on “butterfly

    pattern” Time (years) Latitude (deg) Flux Time (years) Plus solar-like differential rotation, spot evolution, migration, diffusion…
  24. 40 A “Kepler” light curve based on Llama (2012) Time

    Flux • 4 years of data • 5 min samples • 10 day rotation (equator) • 2 day planet orbit • rp/rs = 0.1
  25. 41 Use MCMC to fit every starspot (longitude, latitude, radius)

    x nspots planet orbit & stellar rotation fixed Flux Time
  26. 43 Longitude (deg) slower than mean period faster spot lifetime

    Time (days) rotating @ mean period Goal: measure differential rotation & spot evolution trace starspot longitudes with time
  27. 44 Longitude (deg) slower than mean period faster spot lifetime

    Time (days) rotating @ mean period Goal: measure differential rotation & spot evolution trace starspot longitudes with time
  28. 45 Longitude (deg) Time (days) Each set of points =

    full static MCMC solution! Point color & size = radius
  29. 47 Longitude (deg) Time (days) Colors = cluster grey points

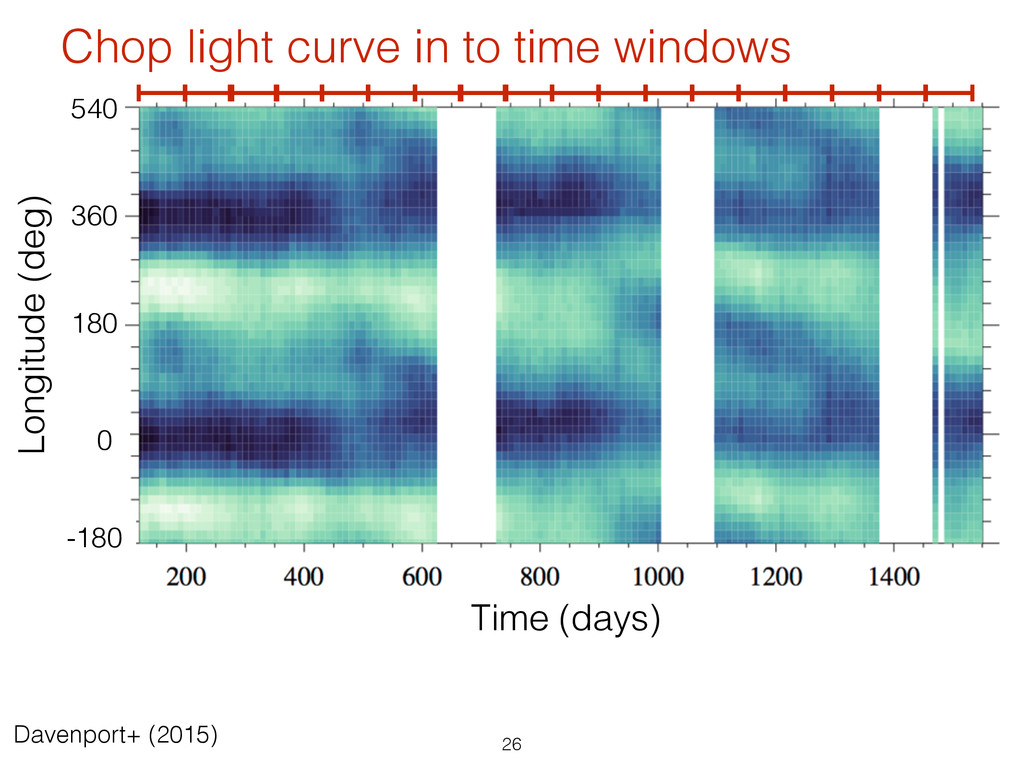
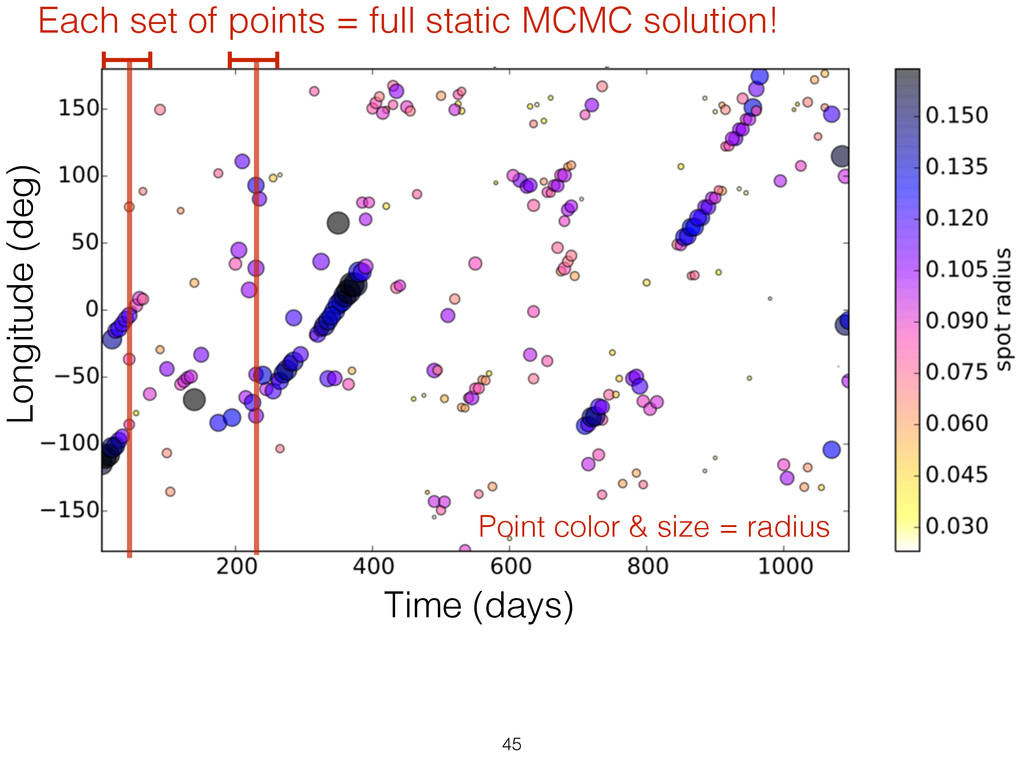
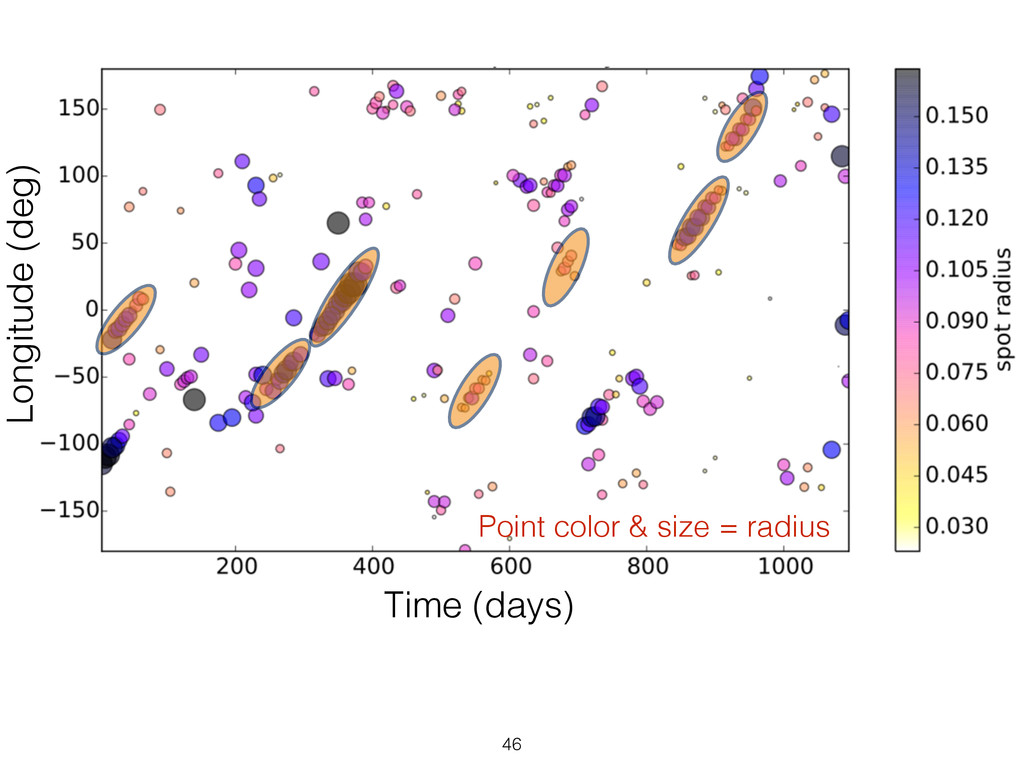
    = no cluster Use Python sklearn “DBSCAN” to cluster DBSCAN = Density-based spatial clustering of applications with noise Each represents 1 starspot moving in longitude over time
  30. Time (days) 48 Max slope = highest lat spot Recovers

    simulated differential rotation law coefficient, k=1 Longitude (deg)
  31. 49 Can recover starspot decay profiles! Time (days) Largest sunspots

    Work in Progress related to diffusion timescale solar decay m odel Area sunspot decay Hathaway (2008)
  32. 51 Kepler 17 - G2 (same as our Sun!) Prot=

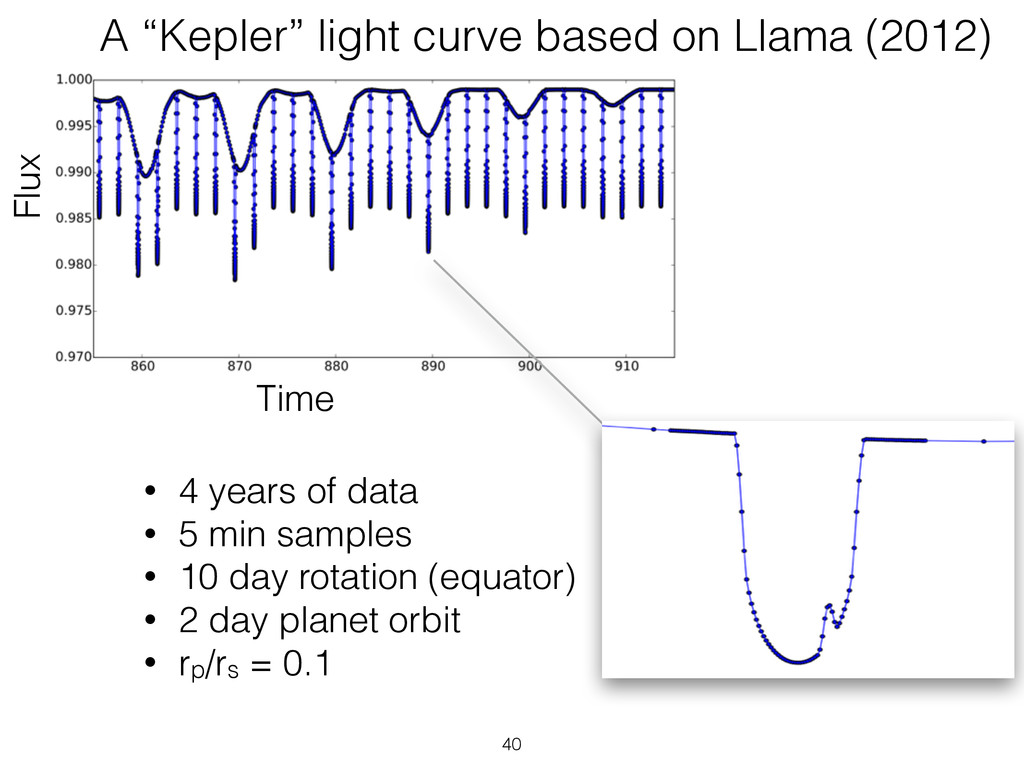
    12.1 days (faster than Sun) Porb= 1.5 days (super fast) Mass = 2.5 MJ Rp/Rs = 0.13 Kepler 17b Désert et al. (2011) Properties very similar to the simulated system!
  33. 57 Longitude (deg) Time (days) Starspot evolution with time: more

    complicated! Point color & size = radius slower faster mean period
  34. 59 Lessons from starspots • Starspots have contrasts similar to

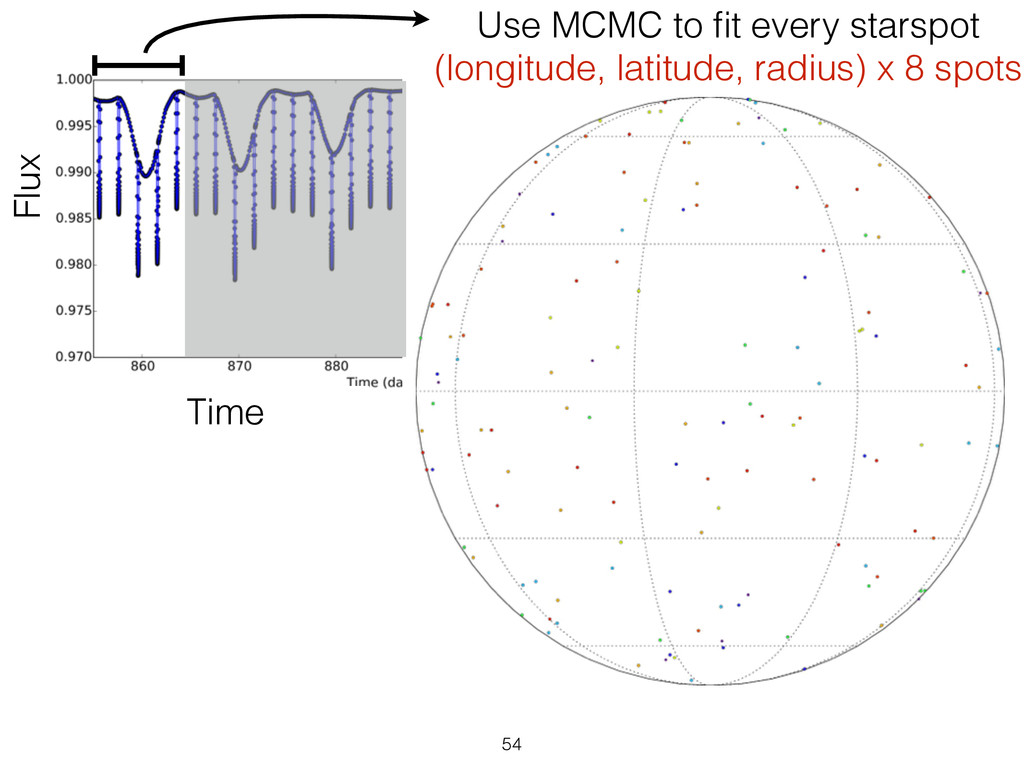
    sunspots • With transits, can fit many starspots simultaneously • Track evolution of at least 100 spot groups over 4 years • Estimate differential rotation law • Decay profiles may constrain diffusion timescale
  35. Kepler: Stellar Flare Machine • Long continuous light curves
 (up

    to ~4years) • Very precise photometry
 (~0.01%) • Enormous sample
 (>100,000 solar-type stars) • Complete samples of flares!
 (impossible from ground) • Huge range of flare energy!
 (look for Carrington-like events) 63
  36. Time (days) GJ 1243, M4 Prot=0.59 days, ~300days 1-min data

    65 Davenport et al. (2014) Lots of flares! COLLECT THEM ALL!
  37. Flares By EYE (FBEYE) 66 Davenport et al. (2014) github.com/jradavenport/FBeye

    • Pick flare start/stop times • Assign classifications • Help train “autofinder”
  38. Large Flare Sample! • 6107 unique flares, spanning 300 days

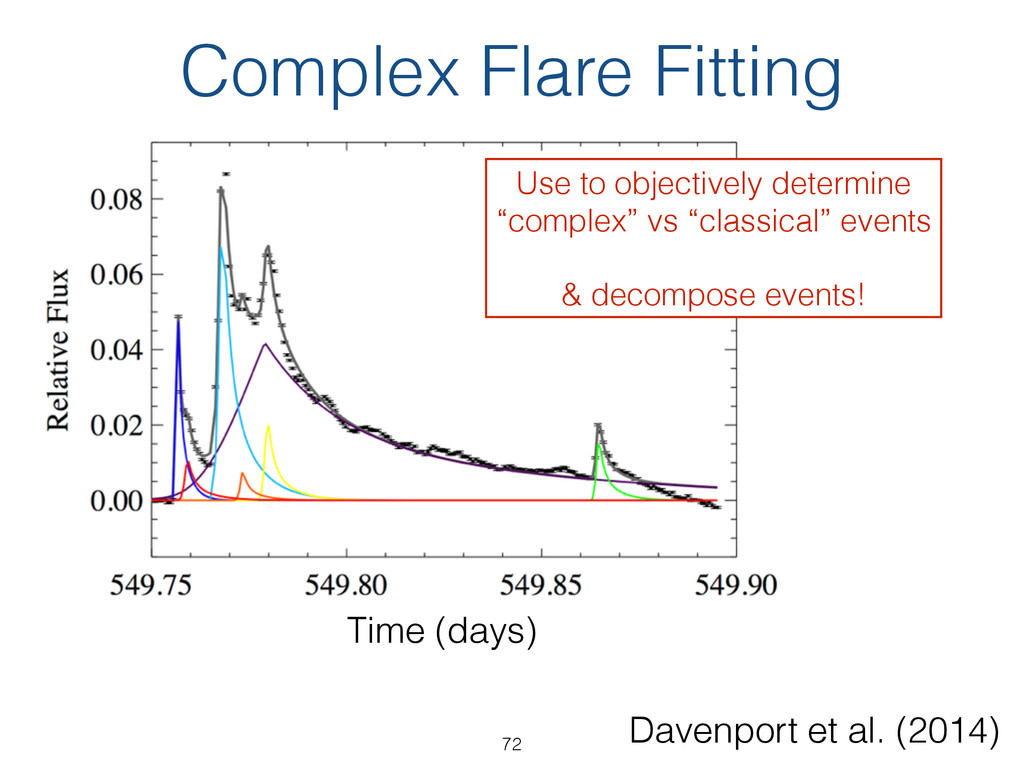
    of data
 most for any star, besides the Sun! • 15% flares are “complex”
 higher % for large energy flares! • big energy range: Log E = 28-33 erg
 large solar flares around 1E32 erg 68 Hawley et al. (2014) Davenport et al. (2014)
  39. Rise Phase 2 Decay Phases exponentials Fit with 4th order

    polynomial Energy budget: rise=20%, decay1=41%, decay2=39% 70 Davenport et al. (2014) Time (FWHM) Time (FWHM)
  40. Complex Flare Fitting 71 Davenport et al. (2014) Time (days)

    works well for “classical” events
  41. Complex Flare Fitting Use to objectively determine “complex” vs “classical”

    events & decompose events! 72 Davenport et al. (2014) Time (days)
  42. Relative Flux Some flares not well fit by template Caused

    by different physical morphology (e.g. arcade)? Active region rolling off limb? 73 Davenport et al. (2014) Time (days)
  43. HST 75 Kepler John Lurie et al. (2015) Flares from

    partially resolved M5 + M5 binary in Kepler! Extending work: GJ 1245AB
  44. Big questions still await us! • Dependence of flare morphology

    on stellar properties? • Structure of complex events? • “Triggered” flares? 
 “Sympathetic" flares? • Frequency of “Superflares”? • Flare rate vs age? 76
  45. 77

  46. 78 Age vs. Activity Lyra (2005) log Ca II Flux

    log age (yrs) ACTIVE! inactive Sun More Flares Fewer Flares
  47. 81 Can we recover solar cycles? Misaligned orbit/rotation samples more

    latitudes, may be better! Brett Morris et al. (2016)
  48. Phase Relative Flux (5 min smoothing) ~2.5x larger Ongoing work

    by L.Hebb, M. Gomez, J. Radigan, and P. McCullough In vs Out of Transit Scatter The Future: study all transiting systems 82
  49. Summary Use transiting exoplanets to trace starspot motion & evolution

    Measuring differential rotation & spot lifetimes for active stars 84 Now is the golden age for statistical studies of stellar activity Largest sample of flares ever. New insights on flare morphology
  50. 85 John R Nick Yumi Eddie Grace Brett John L

    Diana Nell Practice Talk Guinea Pigs: Thanks to the
  51. 88

  52. 89

  53. Summary Use transiting exoplanets to trace starspot motion & evolution

    Measuring differential rotation & spot lifetimes for active stars 90 Now is the golden age for statistical studies of stellar activity Largest sample of flares ever. New insights on flare morphology