Upgrade to Pro — share decks privately, control downloads, hide ads and more …

DDM's Journey into Big Data with BigQuery with KSL and Deseret News

DDM's Journey into Big Data with BigQuery with KSL and Deseret News

This talk is part use-case and part intro into BigQuery.

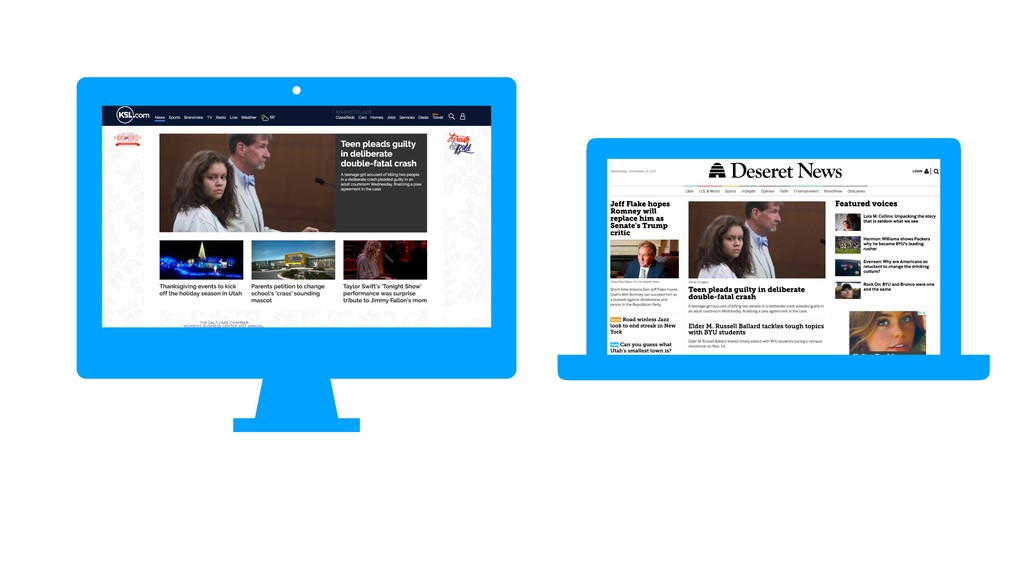
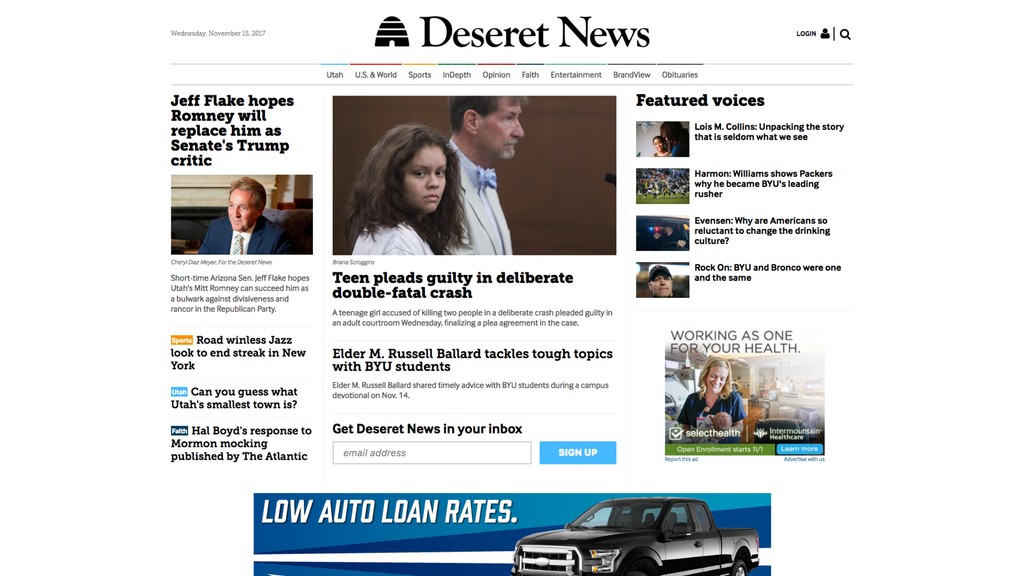
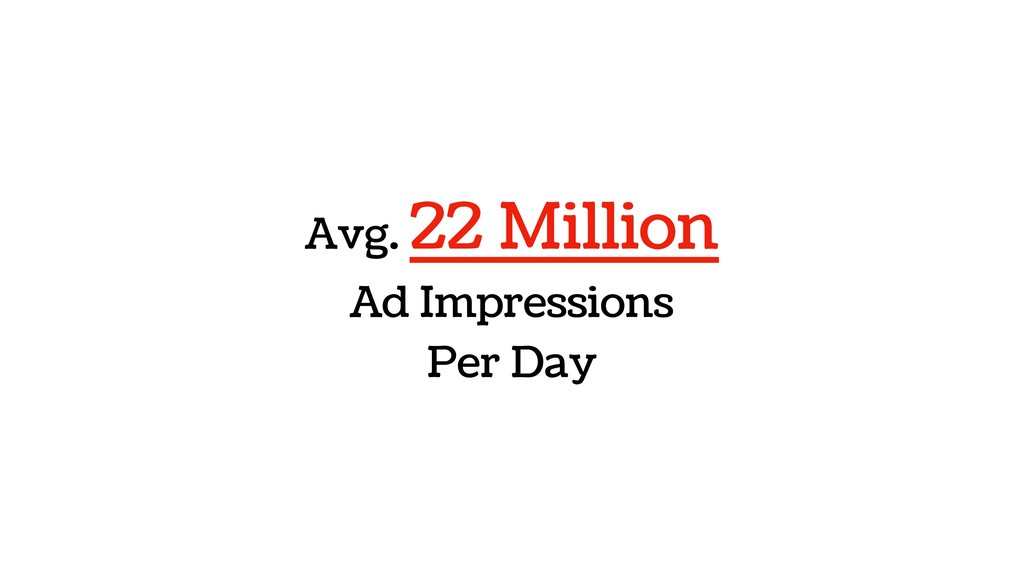
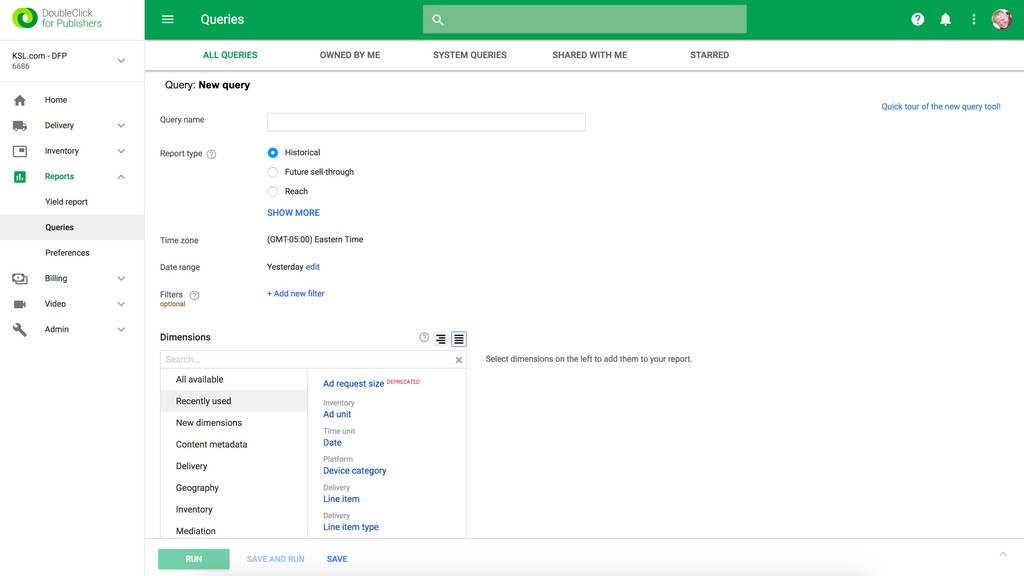
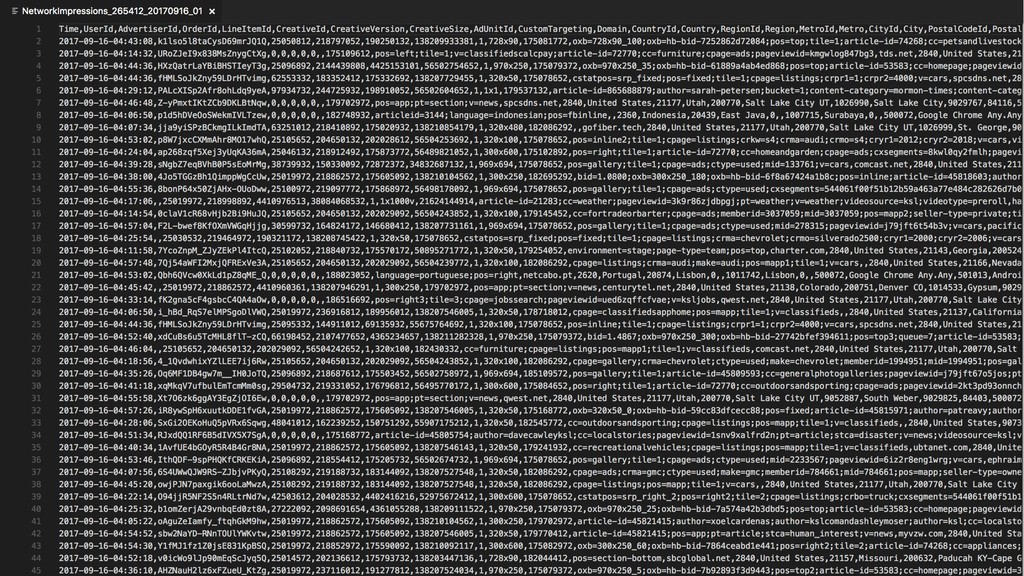
Three years ago Deseret Digital Media had a serious problem: it had a lot of data in Google Analytics and Google Ad Manager (then called DFP), but couldn't run the in-depth analysis needed because of limitations with their reporting tools. They had crucial questions they couldn't answer, so they did what everyone else was doing: just guessing and hoping for the best.

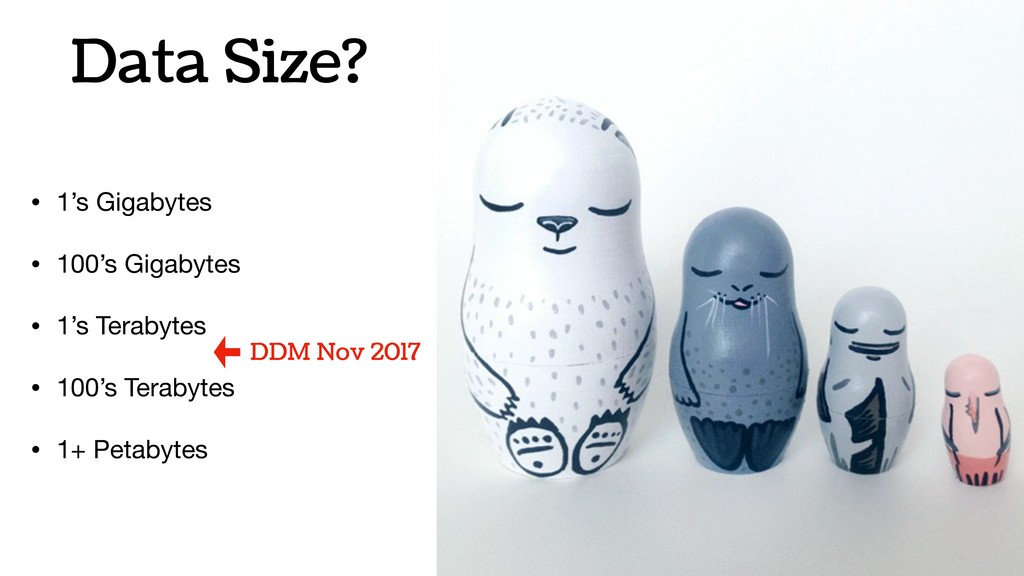
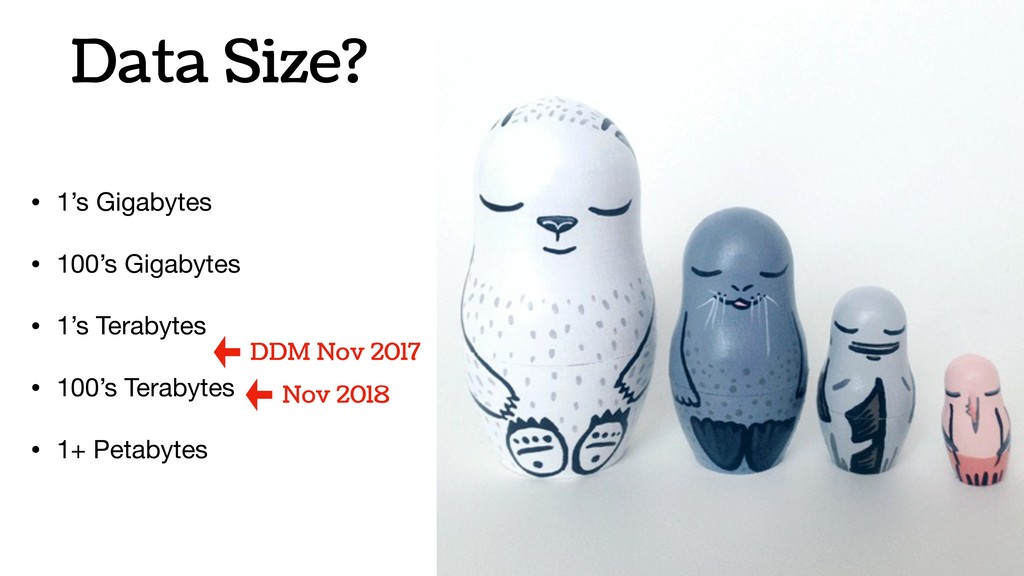
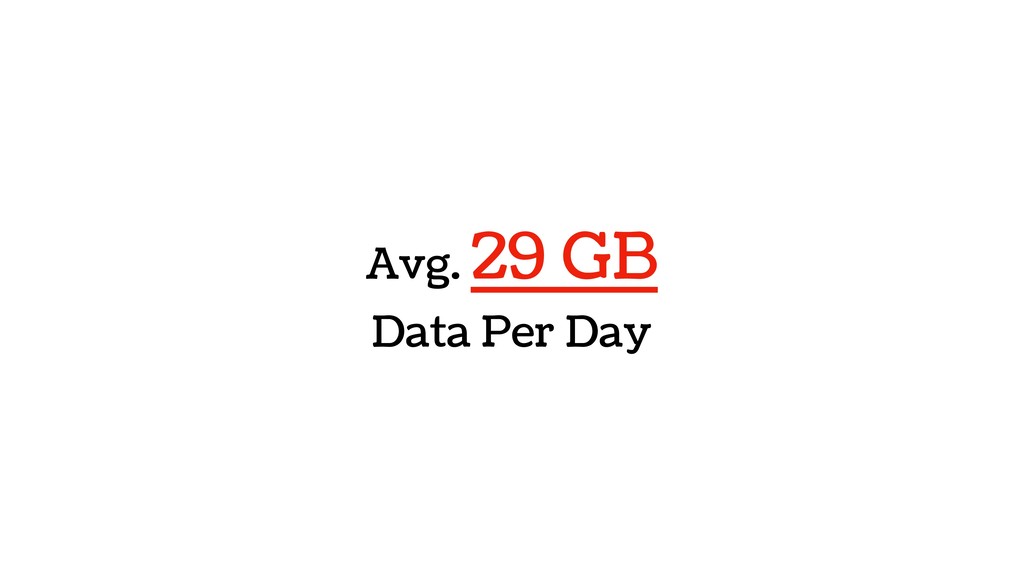
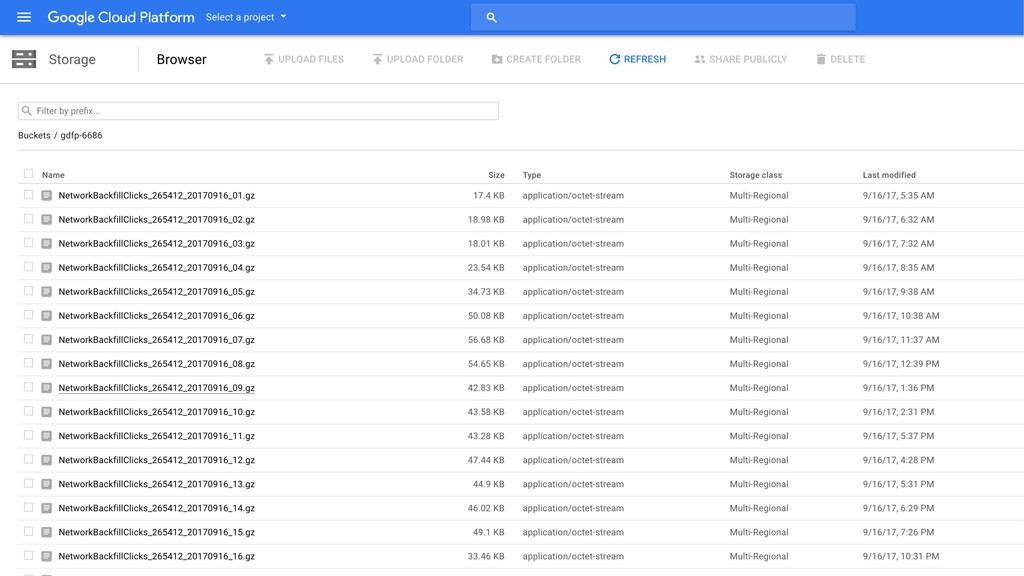
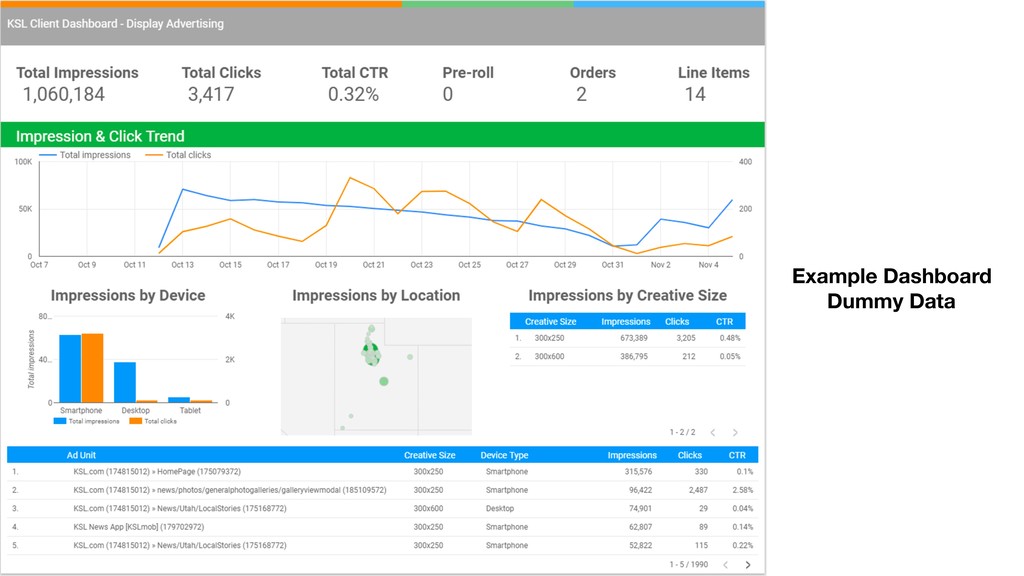
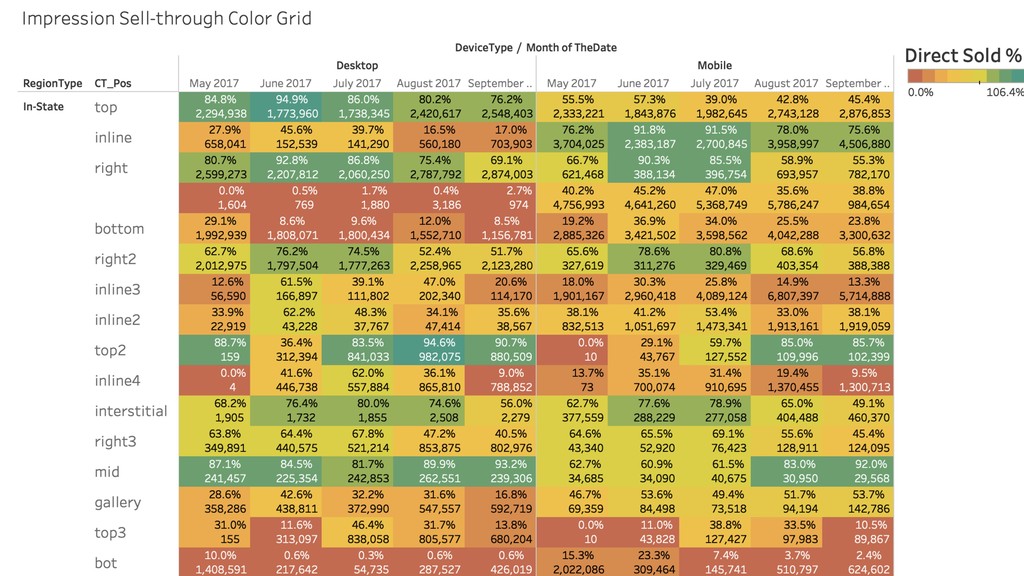
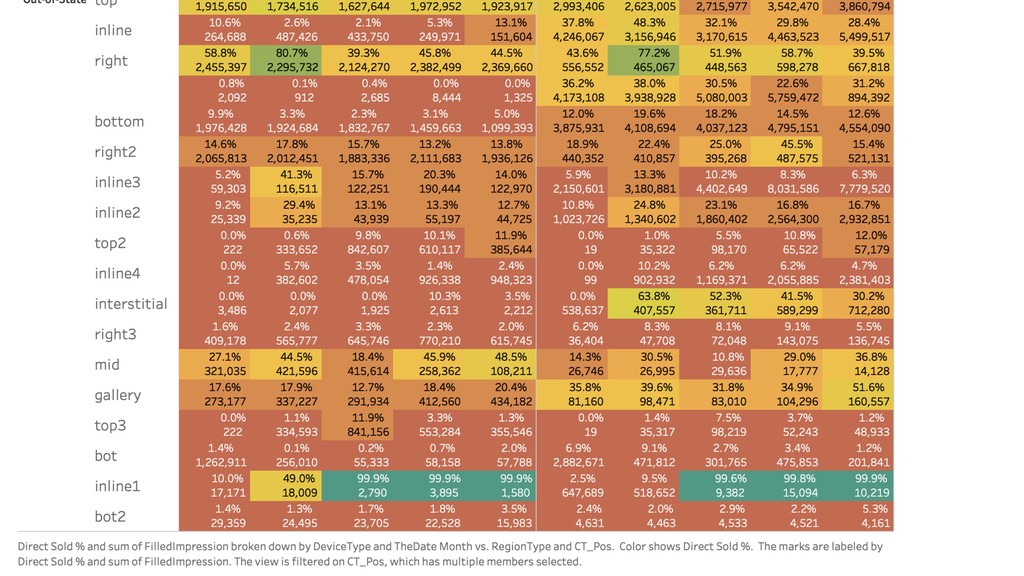
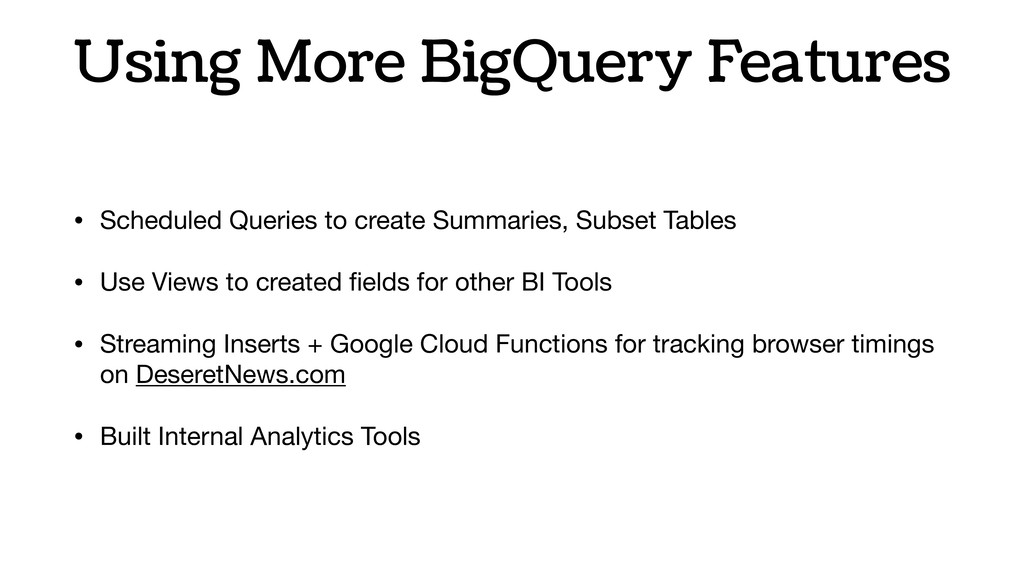
Then one day Justin discovered BigQuery and the rest is history. Without having to create an entire data warehousing team, Justin was able to ingest 30 GB of data a day into BigQuery easily. They went from vague reports to perfectly precise queries. Not only that, but DDM's reports ran incredibly fast. They soon hooked up BigQuery data with Data Studio and provided insights to the entire company.

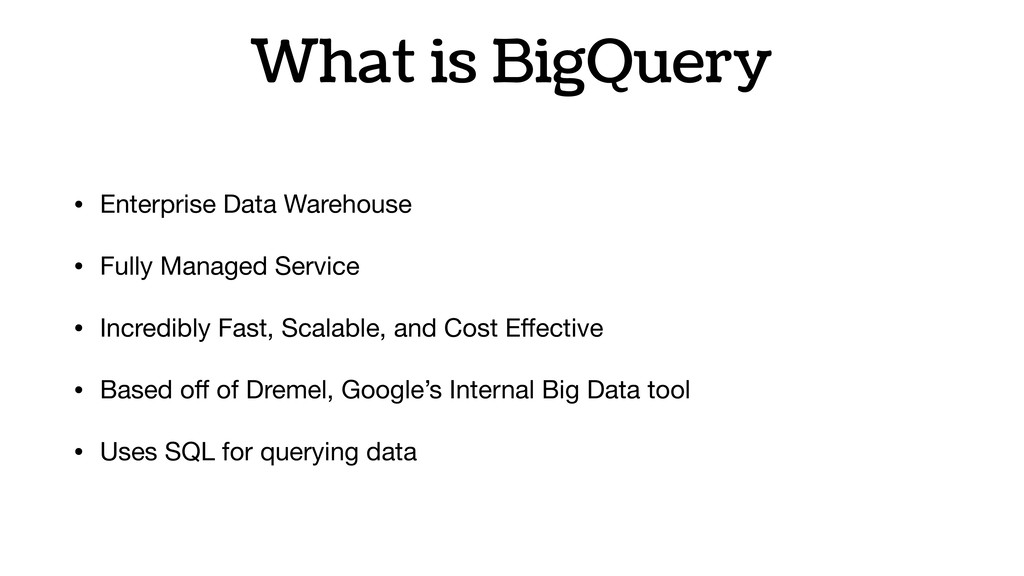
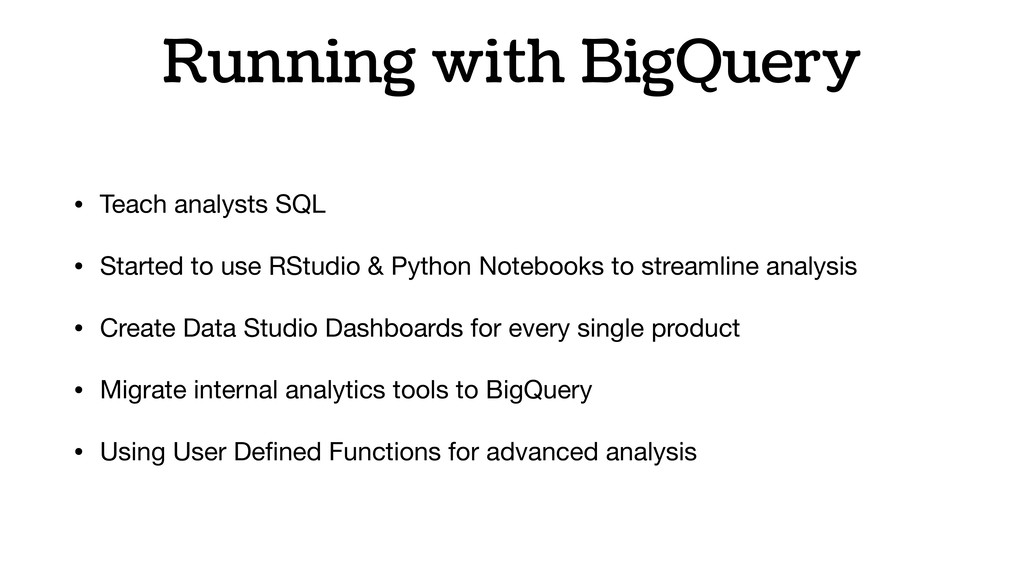
Justin will cover the basics of BigQuery and talk about the best strategies of how to get started with it. BigQuery is fast, simple, and affordable, and you're going to love learning more about it.

Justin Carmony

November 06, 2018
Tweet

More Decks by Justin Carmony

Other Decks in Technology

Transcript

  1. Justin Carmony - Sr. Director of Engineering - GCP SLC Meetup - Nov 2018
    DDM’s Journey into Big Data
    with BigQuery for KSL and Deseret News

    View Slide

  2. Justin
    Carmony
    Sr. Director of Engineering

    KSL.com News & Analytics

    Deseret Digital Media

    View Slide

  3. View Slide

  4. About Presentation
    • Feel free to ask questions on-topic

    • Q&A at the End

    • Always feel free to email/tweet me 

    ([email protected], @JustinCarmony)

    • Will post slides on-line

    View Slide

  5. Who are you?

    View Slide

  6. Experience w/ “Big Data”
    • Lots of Experience?

    • Used it a little bit?

    • Tinkered with it?

    • Totally new?

    View Slide

  7. Data Size?
    • 1’s Gigabytes

    • 100’s Gigabytes

    • 1’s Terabytes

    • 100’s Terabytes

    • 1+ Petabytes

    View Slide

  8. Data Size?
    • 1’s Gigabytes

    • 100’s Gigabytes

    • 1’s Terabytes

    • 100’s Terabytes

    • 1+ Petabytes
    DDM Nov 2017

    View Slide

  9. Data Size?
    • 1’s Gigabytes

    • 100’s Gigabytes

    • 1’s Terabytes

    • 100’s Terabytes

    • 1+ Petabytes
    DDM Nov 2017
    Nov 2018

    View Slide

  10. Let’s Start w/ a Story

    View Slide

  11. View Slide

  12. View Slide

  13. View Slide

  14. View Slide

  15. Avg. 22 Million
    Ad Impressions
    Per Day

    View Slide

  16. Avg. 29 GB
    Data Per Day

    View Slide

  17. How did we view this data?

    View Slide

  18. View Slide

  19. Problems w/ Just DFP Reporting
    • Ran into Limitations

    • Unable to perform complex filters

    • Initial report -> csv -> Excel, slow for large datasets

    • Reporting was very labor intensive, manual

    • Difficult to join in w/ other Datasets (i.e. Google
    Analytics data)

    View Slide

  20. DFP Solution:
    Data Transfer Files!

    View Slide

  21. View Slide

  22. View Slide

  23. View Slide

  24. View Slide

  25. View Slide

  26. View Slide

  27. View Slide

  28. View Slide

  29. Few first failed attempts
    • Wrote some PHP Scripts to read CSV, create reports

    • This was SLOW, and required developer for new reports

    • Import a single month into MySQL

    • Hahahahahahahaha… yeah, no, MySQL died trying.

    (note: I’m sure I could have gotten this to work with an advanced,
    complex setup.)

    View Slide

  30. Use Big Data!
    ( Duh… )

    View Slide

  31. View Slide

  32. Running it Ourselves
    • Complex Setup

    • Large Upfront Investment

    • Always running (means always $$$)

    View Slide

  33. I just want my data

    View Slide

  34. View Slide

  35. What is BigQuery
    • Enterprise Data Warehouse

    • Fully Managed Service

    • Incredibly Fast, Scalable, and Cost Effective

    • Based off of Dremel, Google’s Internal Big Data tool

    • Uses SQL for querying data

    View Slide

  36. What does it cost?
    Storage
    • $0.02 per GB per Month

    • $0.01 per GB per Month for LTS,
    data that hasn’t changed in 90
    days

    • $0.05 per GB per Streaming
    Inserts

    • First 10 GB is free each month
    Analysis
    • $5 per TB of data processed

    • First 1 TB of Analysis Free

    View Slide

  37. What doesn’t cost money?
    • Running / Maintaining a Cluster

    • Bulk Importing of data (this is huge!!!)

    • Copying Data

    • Exporting Data

    View Slide

  38. What makes BigQuery Special
    • Extremely cost effective (extremely cheap)

    • Incredibly Fast

    • Full SQL 2011 Compliance

    • Advanced Data Types: Records, Repeated Fields

    View Slide

  39. Our Journey, 3 Phases:
    Crawl - Walk - Run

    View Slide

  40. Crawl
    https://www.flickr.com/photos/ndanger/4425407800/

    View Slide

  41. Getting Started
    • Create Google Cloud Platform Project

    • Enable BigQuery API

    View Slide

  42. BigQuery Basics
    • Create a Dataset - Collection of Tables & Views

    • Create a Table w/ a Defined Schema

    • Two options for loading in data: Imports & Streaming Inserts

    View Slide

  43. View Slide

  44. Import vs Streaming
    Import Jobs
    • Free

    • 1,000 loads per day for single Table

    • 50,000 loads per day for Project

    • CSV, New Line Delimited JSON, AVRO
    Streaming Inserts
    • $0.05 per GB

    • Real-time (my experience, within 3
    seconds)

    • Stream through the API

    View Slide

  45. First Attempt Loading
    • Used homegrown Node.js Script to ETL files

    • Generated New-line Delimited JSON files

    • Initially used repeated records, switched to JSON strings

    • Now with Standard SQL, and we understand it better, I’d go back and
    use repeated records again.

    • Biggest Hangup: Data Types Conflicts

    View Slide

  46. Lessons Learned Importing
    • Newline Delimited JSON files are Largest

    • If you can, use AVRO:

    • Allows for compression, attaching the schema

    • Imports are extra fast

    • You can import a wildcard list of file:

    • Instead of gs://example-bucket/upload.avro

    • Use multiple files like gs://example-bucket/upload-*

    View Slide

  47. Lessons Learned Importing
    • Use unique names of imports

    • Bad: gs://example/daily-import-*

    • Better: gs://example/daily-import-2018-01-01-x8fd62/part-*

    View Slide

  48. View Slide

  49. View Slide

  50. How Query Billing Works
    • You are billed for the size of columns your query uses. Period.

    • What doesn’t impact billing:

    • Time to run

    • Number of rows returned

    • Complexity

    • Anything else….

    View Slide

  51. id username status fav_icecream
    1 justin_carmony active pralines and cream
    2 brett_atkinson active birthday cake
    3 greg_dolan active chocolate
    4 mike_peterson active cookies and cream
    SELECT id FROM `ddm-example.users` WHERE status = 'active'

    View Slide

  52. id username status fav_icecream
    1 justin_carmony active pralines and cream
    2 brett_atkinson active birthday cake
    3 greg_dolan active chocolate
    4 mike_peterson active cookies and cream
    SELECT id FROM `ddm-example.users` WHERE status = 'active'

    View Slide

  53. 28.46 TB * $5.00 per TB = $142.46

    View Slide

  54. 0.61 TB * $5.00 per TB = $3.05

    View Slide

  55. View Slide

  56. View Slide

  57. View Slide

  58. View Slide

  59. 23,398,994,173

    View Slide

  60. Table Partition
    Multiple Tables
    • `tablename_YYYYMMDD`

    • _TABLE_SUFFIX to select range

    • `dataset.table_201810*`

    • Pros:

    • Defined boundaries
    Single Table
    • Treat as a single table

    • On import define row partition date

    • Beta: cluster tables

    • Pros:

    • Treat as a single table, WHERE
    statement to limit query scope.

    View Slide

  61. At This Point

    • We had our Advertising Data in BigQuery

    • Using BigQuery UI to execute ad-hoc queries

    • Started to get great insights into our data!

    • It was amazing!

    View Slide

  62. But Needed to Get Better!
    • Only analysis could be done through me

    • For every question answered, 10 more questions!

    • “How can we expose this to the rest of the organization?”

    View Slide

  63. Walk
    https://www.flickr.com/photos/thomasleuthard/12087829163/

    View Slide

  64. View Slide

  65. Example Dashboard
    Dummy Data

    View Slide

  66. View Slide

  67. View Slide

  68. Using More BigQuery Features
    • Scheduled Queries to create Summaries, Subset Tables

    • Use Views to created fields for other BI Tools

    • Streaming Inserts + Google Cloud Functions for tracking browser timings
    on DeseretNews.com

    • Built Internal Analytics Tools

    View Slide

  69. Run
    https://www.flickr.com/photos/80517909@N04/30600455558/

    View Slide

  70. Running with BigQuery
    • Teach analysts SQL

    • Started to use RStudio & Python Notebooks to streamline analysis

    • Create Data Studio Dashboards for every single product

    • Migrate internal analytics tools to BigQuery

    • Using User Defined Functions for advanced analysis

    View Slide

  71. Where we are at today
    • 106 TB of Data

    • 69.7 Billion Rows

    • 21k Tables

    • 600+ TB of Analysis

    View Slide

  72. Demo Time

    View Slide

  73. Fly
    https://www.flickr.com/photos/80517909@N04/30600455558/

    View Slide