Upgrade to Pro — share decks privately, control downloads, hide ads and more …

GAMe 2017: A performance evaluation for Galaxy

James Taylor
February 05, 2017

GAMe 2017: A performance evaluation for Galaxy

Looking at where Galaxy has succeeded and where I think Galaxy should go presented at the Galaxy Australasia Meeting 2017 (https://www.embl-abr.org.au/game2017/)

James Taylor

February 05, 2017
Tweet

More Decks by James Taylor

Other Decks in Science

Transcript

  1. What was the assignment? Reproducibility: Ensure that analysis performed in

    the system can be reproduced precisely and practically Transparency: Facilitate communication of analyses and results in ways that are easy to understand while providing all details Accessibility: Eliminate barriers for researchers wanting to use complex methods, make these methods available to everyone
  2. Idea Experiment Raw Data Tidy Data Summarized data Results Experimental

    design Data collection Data cleaning Data analysis Inference Data Pipeline, inspired by Leek and Peng, Nature 2015 The part we are considering here The part that ends up in the Publication
  3. What is reproducibility? (for computational analyses) Reproducibility means that an

    analysis is described/captured in sufficient detail that it can be precisely reproduced Reproducibility is not provenance, reusability/ generalizability, or correctness A minimum standard for evaluating analyses
  4. A spectrum of solutions Analysis environments (Galaxy, GenePattern, Mobyle, …)

    Workflow systems (Taverna, Pegasus, VisTrails, …) Notebook style (iPython notebook, …) Literate programming style (Sweave/knitR, …) System level provenance capture (ReproZip, …) Complete environment capture (VMs, containers, …)
  5. Describe analysis tool behavior abstractly Analysis environment automatically and transparently

    tracks details Workflow system for complex analysis, constructed explicitly or automatically Pervasive sharing, and publication of documents with integrated analysis
  6. Reproducibility in Galaxy The representation of an executed analysis in

    Galaxy is the History For each step, capture the tool that was run, the input datasets (and the step that produced them), and the parameters Can I take this to another Galaxy instance and ensure I have the same tool wrapper? version? version of underlying dependencies? environment?
  7. ToolShed to the rescue For early Galaxy instances, tool wrapper

    management was very ad hoc. No tracking of wrapper version information in the Galaxy database, no standard way to share. ToolShed enables not just sharing, but global identifiers and versions across all Galaxy instances. We also tried to deal with dependencies… less successfully. Packaging dependencies is a lot of work and a general need, better handled by a broader community.
  8. It is now reasonable to support one major server platform

    — Linux (this is great for portability and reproducibility, but scary for other reasons — monoculture leads to fragility)
  9. Builds on Conda packaging system, designed “for installing multiple versions

    of software packages and their dependencies and switching easily between them” ~2000 recipes for software packages* (as of yesterday) All packages are built in a minimal environment to ensure isolation and portability *not even including different versions!
  10. Submit recipe to GitHub Travis CI pulls recipes and builds

    in minimal docker container Successful builds from main repo uploaded to Anaconda to be installed anywhere
  11. Containerization Builds on Linux kernel features enabling complete isolation from

    the kernel level up Containers — lightweight environments with isolation enforced at the OS level, complete control over all software Adds a complete ecosystem for sharing, versioning, managing containers — e.g. Docker hub
  12. Galaxy + Containers Run every analysis in a clean container

    — analysis are isolated and environment is the same every time Archive that container — containers are lightweight thanks to layers — and the analysis can always be recreated
  13. Bioconda + Containers Given a set of packages and versions

    in Conda/ Bioconda, we can build a container with just that software on a minimal base image If we use the same base image, we can reconstruct exactly the same container (since we archive all binary builds of all versions) With automation, these containers can be built automatically for every package with no manual modification or intervention (e.g. mulled)
  14. Bioconda + Containers + Virtualization If we run our containers

    inside a specific (ideally minimal) known VM we can control the kernel environment as well Atmosphere funded by the National Science Foundation
  15. Tool and dependency binaries, built in minimal environment with controlled

    libs Container defines minimum environment Virtual machine controls kernel and apparent hardware environment KVM, Xen, …. Increasingly precise environment control
  16. This is the best stack for complete reproducibility we have

    ever had in bioinformatics. With the right technologies, reproducibility is possible and practical.
  17. Reproducibility is possible, why is it not the norm? Slightly

    more difficult than not doing it right Analysts don’t know how to do it right Fear of being critiqued – “why hold myself to a higher standard”
  18. Tools can only fix so much of the problem Need

    to create an expectation of reproducibility Require authors to make their work reproducible as part of the peer review process Need to educate analysts The practices that lead to reproducibility are also essential to scientific integrity.
  19. OPINION Opinion: Reproducible research can still be wrong: Adopting a

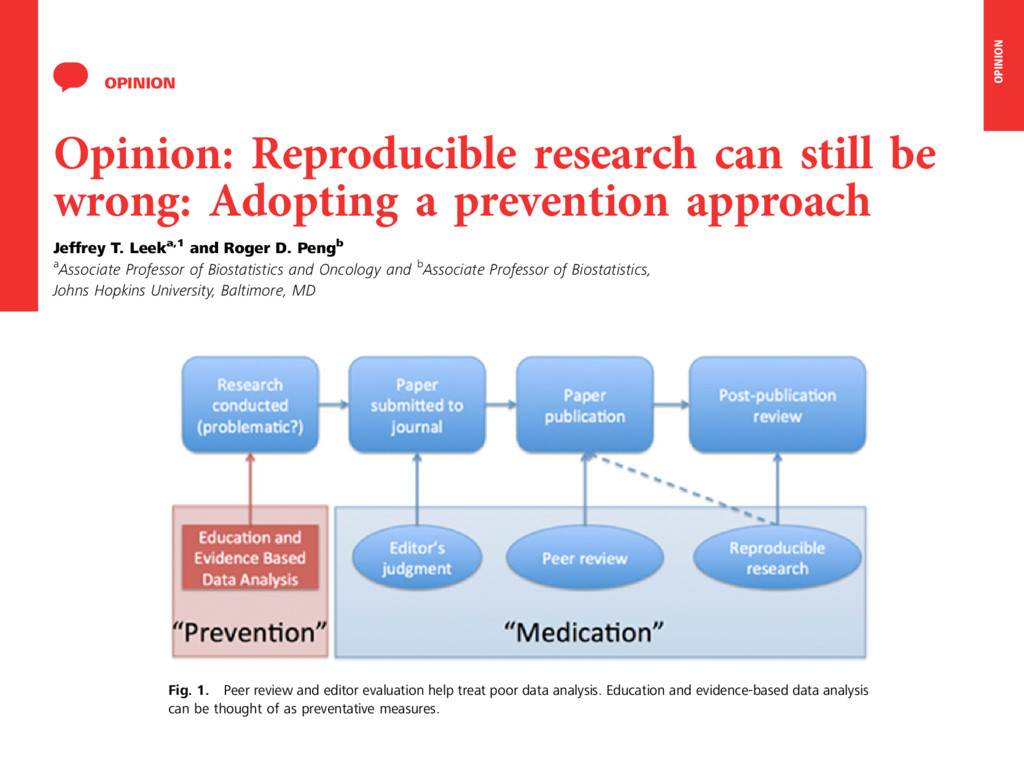
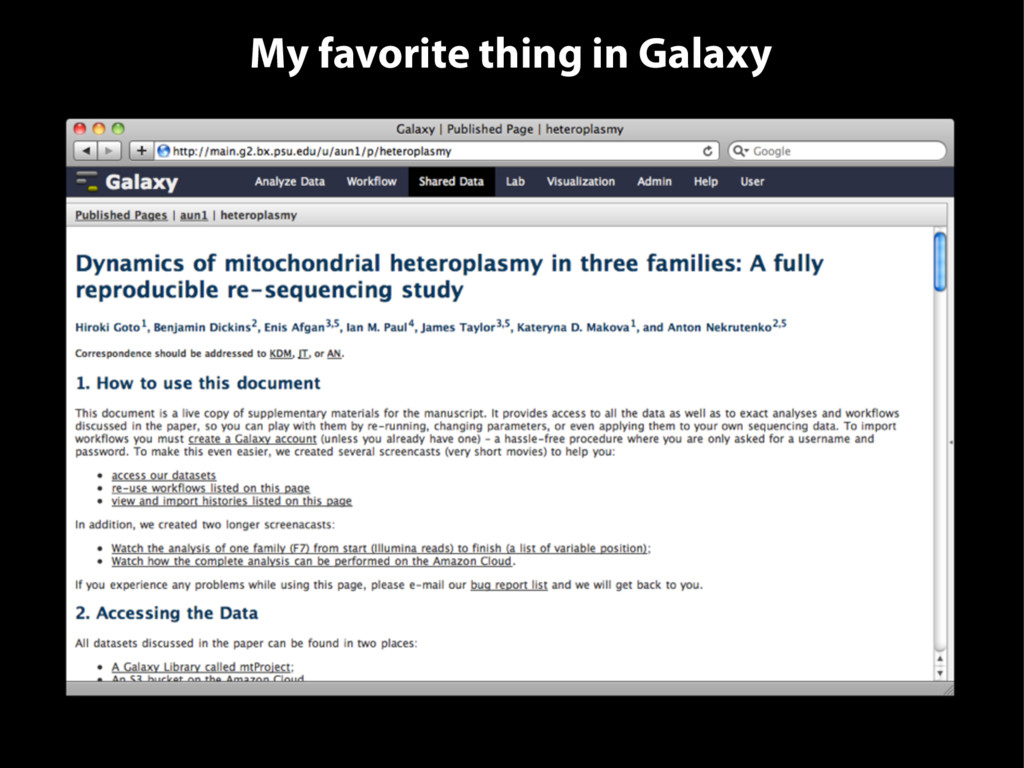
    prevention approach Jeffrey T. Leeka,1 and Roger D. Pengb aAssociate Professor of Biostatistics and Oncology and bAssociate Professor of Biostatistics, Johns Hopkins University, Baltimore, MD Reproducibility—the ability to recompute results—and replicability—the chances other experimenters will achieve a consistent result—are two foundational characteristics of successful scientific research. Consistent findings from independent investigators are the primary means by which scientific evidence accumulates for or against a hy- pothesis. Yet, of late, there has been a crisis of confidence among researchers worried about the rate at which studies are either reproducible or replicable. To maintain the integrity of science research and the public’s trust in science, the scientific community must ensure reproducibility and replicability by engaging in a more preventative ap- proach that greatly expands data analysis education and routinely uses software tools. We define reproducibility as the ability to recompute data analytic results given an observed dataset and knowledge of the data analysis pipeline. The replicability of a study been some very public failings of reproduc- ibility across a range of disciplines from can- cer genomics (3) to economics (4), and the data for many publications have not been made publicly available, raising doubts about the quality of data analyses. Popular press articles have raised questions about the reproducibility of all scientific research (5), and the US Congress has convened hearings focused on the transparency of scientific re- search (6). The result is that much of the scientific enterprise has been called into question, putting funding and hard won sci- entific truths at risk. From a computational perspective, there are three major components to a reproducible and replicable study: (i) the raw data from the experiment are available, (ii) the statisti- cal code and documentation to reproduce the analysis are available, and (iii) a correct data analysis must be performed. Recent cultural shifts in genomics and other areas have had computational tools such as knitr, iPython notebook, LONI, and Galaxy (8) have simplified the process of distributing repro- ducible data analyses. Unfortunately, the mere reproducibility of computational results is insufficient to ad- dress the replication crisis because even a re- producible analysis can suffer from many problems—confounding from omitted varia- bles, poor study design, missing data—that threaten the validity and useful interpretation of the results. Although improving the repro- ducibility of research may increase the rate at which flawed analyses are uncovered, as recent high-profile examples have demon- strated (4), it does not change the fact that problematic research is conducted in the first place. The key question we want to answer when seeing the results of any scientific study is “Can I trust this data analysis?” If we think of problematic data analysis as a disease, repro- ducibility speeds diagnosis and treatment in the form of screening and rejection of poor data analyses by referees, editors, and other scientists in the community (Fig. 1). OPINION education and routinely uses software tools. We define reproducibility as the ability to recompute data analytic results given an observed dataset and knowledge of the data analysis pipeline. The replicability of a study is the chance that an independent experi- ment targeting the same scientific question will produce a consistent result (1). Con- cerns among scientists about both have gained significant traction recently due in part to a statistical argument that suggested most published scientific results may be false positives (2). At the same time, there have the experiment are available, (ii) the statisti- cal code and documentation to reproduce the analysis are available, and (iii) a correct data analysis must be performed. Recent cultural shifts in genomics and other areas have had a positive impact on data and code availabil- ity. Journals are starting to require data avail- ability as a condition for publication (7), and centralized databases such as the National Center for Biotechnology Information’s Gene Expression Omnibus are being cre- ated for depositing data generated by pub- licly funded scientific experiments. New problematic data a ducibility speeds d the form of screen data analyses by r scientists in the co This medicatio quality relies on p to make this diagn is a tall order. Edi medical and scie the training and evaluation of a da is compounded b and data analyse ingly complex, th journals continu the demands on are increasing. T duced the efficac tifying and cor discoveries in the cially, the medic address the probl We suggest that to be considered Fig. 1. Peer review and editor evaluation help treat poor data analysis. Education and evidence-based data analysis can be thought of as preventative measures. Author contributions: J.T.L. 1To whom correspondence edu. Any opinions, findings, con pressed in this work are tho reflect the views of the Na www.pnas.org/cgi/doi/10.1073/pnas.1421412111 PNAS | February 10, 2015 |
  20. Reproducibility is only one part of research integrity Need widespread

    education on how to conduct computational analyses that are correct and transparent Research should be subject to continuous, constructive, and open peer review Mistakes will be made! Need to create an environment where researchers are willing to be open and transparent enough that these mistakes are found
  21. 2. Transparency “Facilitate communication of analyses and results in ways

    that are easy to understand while providing all details"
  22. We do pretty well at ensuring all details are communicated.

    Everything is captured and can be accessed if you know where to look. Easy to understand has always been more of a challenge.
  23. How useful are analysis artifacts (say histories and workflows) when

    exported from Galaxy? Imported into another Galaxy? How concrete/abstract is a workflow? Can it generalize across different versions of a tool? Different tools of a similar type? What about providing narrative context?
  24. 2. Transparency — C? We meet the standard. But there

    is clearly still an opportunity to do much more.
  25. 3. Accessibility “Eliminate barriers for researchers wanting to use complex

    methods, make these methods available to everyone"
  26. PSC, Pittsburgh Stampede • 462,462 cores • 205 TB memory

    Blacklight Bridges Dedicated resources Shared XSEDE resources TACC Austin Galaxy Cluster 
 (Rodeo) • 256 cores • 2 TB memory Corral/Stockyard • 20 PB disk funded by the National Science Foundation Award #ACI-1445604 PTI IU Bloomington Leveraging National Cyberinfrastructure: Galaxy/XSEDE Gateway
  27. web db slurm rabbitmq VMWare reference user data Corral (DDN)

    NFS cluster 01 cluster 02 … cluster 16 Rodeo dedicated cvmfs 0 cvmfs1 cvmfs1 nfs vm 01 vm 02 … vm N vm 01 vm 02 … vm N nfs slurm + pulsar IU funded by the National Science Foundation Award #ACI-1445604 TACC funded by the National Science Foundation Award #ACI-1445604
  28. Collection construct + major workflow engine changes… More Powerful Workflows

    Arbitrary # of Inputs (... paired). Run applications in parallel (one per input). Merged output for subsequent processing. John Chilton
  29. Analysis Scale (low) (high) Analysis Process Phase (exploratory) (batch) 10s,

    batch 100s, batch 2017 Galaxy: 10k - 100k datasets
  30. We need better ways to look at, think about, and

    manage datasets and the 100k scale. At some point users no longer care about seeing the individual history, workflow, just specific results. New: many workflow view, for monitoring the execution of many workflows in parallel New: reports — generate summaries of executing workflows, multiple workflows, from user templates with continuous updates
  31. Analysis Scale (low) (high) Analysis Process Phase (exploratory) (batch) 10s,

    batch 100s, batch 100k, batch ? Interactive Environments: 10s of datasets, ad hoc analyses
  32. Analysis Scale (low) (high) Analysis Process Phase (exploratory) (batch) 10s,

    batch 100s, batch 100k, batch ? ad hoc, more flexible
  33. Analysis Scale (low) (high) Analysis Process Phase (exploratory) (batch) 10s,

    batch 100s, batch 100k, batch ? ad hoc, more flexible Visualization and analytics 10s of datasets, highly interactive
  34. Analysis Scale (low) (high) Analysis Process Phase (exploratory) (batch) 10s,

    batch 100s, batch 100k, batch ? ad hoc, more flexible visual exploration ?
  35. We need to support exploratory data analysis even more than

    we do now Dataset complexity, heterogeneity, dimensionality and all only increasing The analysis decision process requires more support for data exploration, both visual and interactive data manipulation
  36. Analysis Scale (low) (high) Analysis Process Phase (exploratory) (batch) 10s,

    batch 100s, batch 100k, batch ? ad hoc, more flexible visual exploration ? WHERE NEEDS TO GO
  37. The future Galaxy needs to scale seamlessly across the data

    analysis process… …supporting analysts as they transition from exploratory, to batch, to high-throughput
  38. At either end of the spectrum, there are common themes.

    The future Galaxy embraces real time and continuous communication. From exploratory analysis to batch job tracking to automatic reports, Galaxy needs to be responsive and informative. The future Galaxy is increasingly interactive The future Galaxy better supports transitions between analysis modes.
  39. ACKnowledgements Galaxy: Enis Afgan, Dannon Baker, Daniel Blankenberg, Dave Bouvier,

    Martin Cěch, John Chilton, Dave Clements, Nate Coraor, Carl Eberhard, Jeremy Goecks, Björn Grüning, Sam Guerler, Mo Heydarian, Jennifer Hillman-Jackson, Anton Nekrutenko, Eric Rasche, Nicola Soranzo, Marius van den Beek JHU Data Science: Jeff Leek, Roger Peng, … Jetstream: Craig Stewart, Ian Foster, Matthew Vaughn, Nirav Merchant BioConda: Johannes Köster, Björn Grüning, Ryan Dale, Chris Tomkins-Tinch, Brad Chapman, … Other lab members: Boris Brenerman, Min Hyung Cho, Peter DeFord, German Uritskiy, Mallory Freeberg NHGRI (HG005133, HG004909, HG005542, HG005573, HG006620) NIDDK (DK065806) and NSF (DBI 0543285, DBI 0850103)