Upgrade to Pro — share decks privately, control downloads, hide ads and more …

5-Soil_Chemistry.pdf

Kaizad Patel
January 01, 2017
250

 5-Soil_Chemistry.pdf

Kaizad Patel

January 01, 2017
Tweet

Transcript

  1. EES 140: Spring 2017 Kaizad F. Patel 1 EES 140

    Spring 2017 Kaizad F. Patel 2
  2. EES 140: Spring 2017 Kaizad F. Patel 2 3 Elements

    and their symbols Carbon C Cobalt Co Copper Cu (cuprum) Sodium Na (natrium) Nitrogen N Phosphorus P Potassium K (kalium) Magnesium Mg Manganese Mn Iron Fe (ferrum) Iodine I Lead Pb (plumbum) essential chemistry 4 Cations Anions H+ Na+ K+ Cu+ Cu+2 Ca+2 Mg+2 Fe+2 Fe+3 Al+3 Cl- NO3 - SO4 -2 CO3 -2 PO4 -3 chloride nitrate sulfate carbonate phosphate essential chemistry cuprous cupric ferrous ferric
  3. EES 140: Spring 2017 Kaizad F. Patel 3 5 Charge

    equivalence when forming compounds H+ and Cl- are both monovalent H+ and NO3 - are both monovalent H+ is monovalent, SO4 -2 is divalent Na+ and Cl- are both monovalent Ca+2 is divalent, Cl- is monovalent Mg+2 is divalent, Cl- is monovalent HCl HNO3 H2 SO4 NaCl CaCl2 MgCl2 essential chemistry 1. Clay Mineralogy 2. Cation Exchange 3. Soil Acidity 6 Outline
  4. EES 140: Spring 2017 Kaizad F. Patel 4 1-1000 nm

    in diameter Intermediate between dissolved and particulate fractions 7 1 nm = 10-9 m size surface area  external surface area  internal surface area electrostatic charge  negative  positive 8 clay, OM particles 10 to >800 m2/g
  5. EES 140: Spring 2017 Kaizad F. Patel 5 adsorption of

    cations and anions  ionic double layer adsorption of water 9 Soil Colloids Crystalline Silicate Clays Primary Silicate Clays Secondary Silicate Clays Noncrystalline Silicate Clays Iron and Aluminum Oxides Organic 10 definite order sheets no definite order e.g. volcanic ash highly weathered soils
  6. EES 140: Spring 2017 Kaizad F. Patel 6 11 tetrahedron

    octahedron 8 faces 4 faces 12 tetrahedron
  7. EES 140: Spring 2017 Kaizad F. Patel 7 13 mica

    14 quartz 3-dimensional interlocking network
  8. EES 140: Spring 2017 Kaizad F. Patel 8 Si Si

    Al 15 the Layered Silicate Mineral 16 Si+4 Al+3 net negative charge
  9. EES 140: Spring 2017 Kaizad F. Patel 9 17 Al+3

    net negative charge Mg+2 1:1 Clay minerals 2:1 Expanding clay minerals 2:1 Non-expanding clay minerals Hydrous Oxides 18
  10. EES 140: Spring 2017 Kaizad F. Patel 10 19 Each

    layer consists of 1 Si tetrahedral sheet and 1 Al octahedral sheet 20 Kaolinite
  11. EES 140: Spring 2017 Kaizad F. Patel 11 21 OH

    O OH H bond Prevents expansion when clay is wetted 22 non-expanding Less shrink-swell Less plastic Less sticky little isomorphous substitution Low cation adsorption low specific surface area Good for engineering, construction, cultivation Less adsorptive capacity Dominated by external surface area Nutrient management needed
  12. EES 140: Spring 2017 Kaizad F. Patel 12 1 octahedral

    sheet sandwiched between 2 tetrahedral sheets “Shrink-Swell Clays” 23 24 weak O-O bonds O O O O
  13. EES 140: Spring 2017 Kaizad F. Patel 13 25 expanding

    shrink-swell plastic sticky Al+3 to Mg+2 isomorphous substitution high cation adsorption high specific surface area Difficult for cultivation, construction high adsorptive capacity External and internal surface area 1 octahedral sheet sandwiched between 2 tetrahedral sheets 26 Si+4 to Al+3 isomorphous substitution K+ adsorbed (fixed)
  14. EES 140: Spring 2017 Kaizad F. Patel 14 27 Al+3

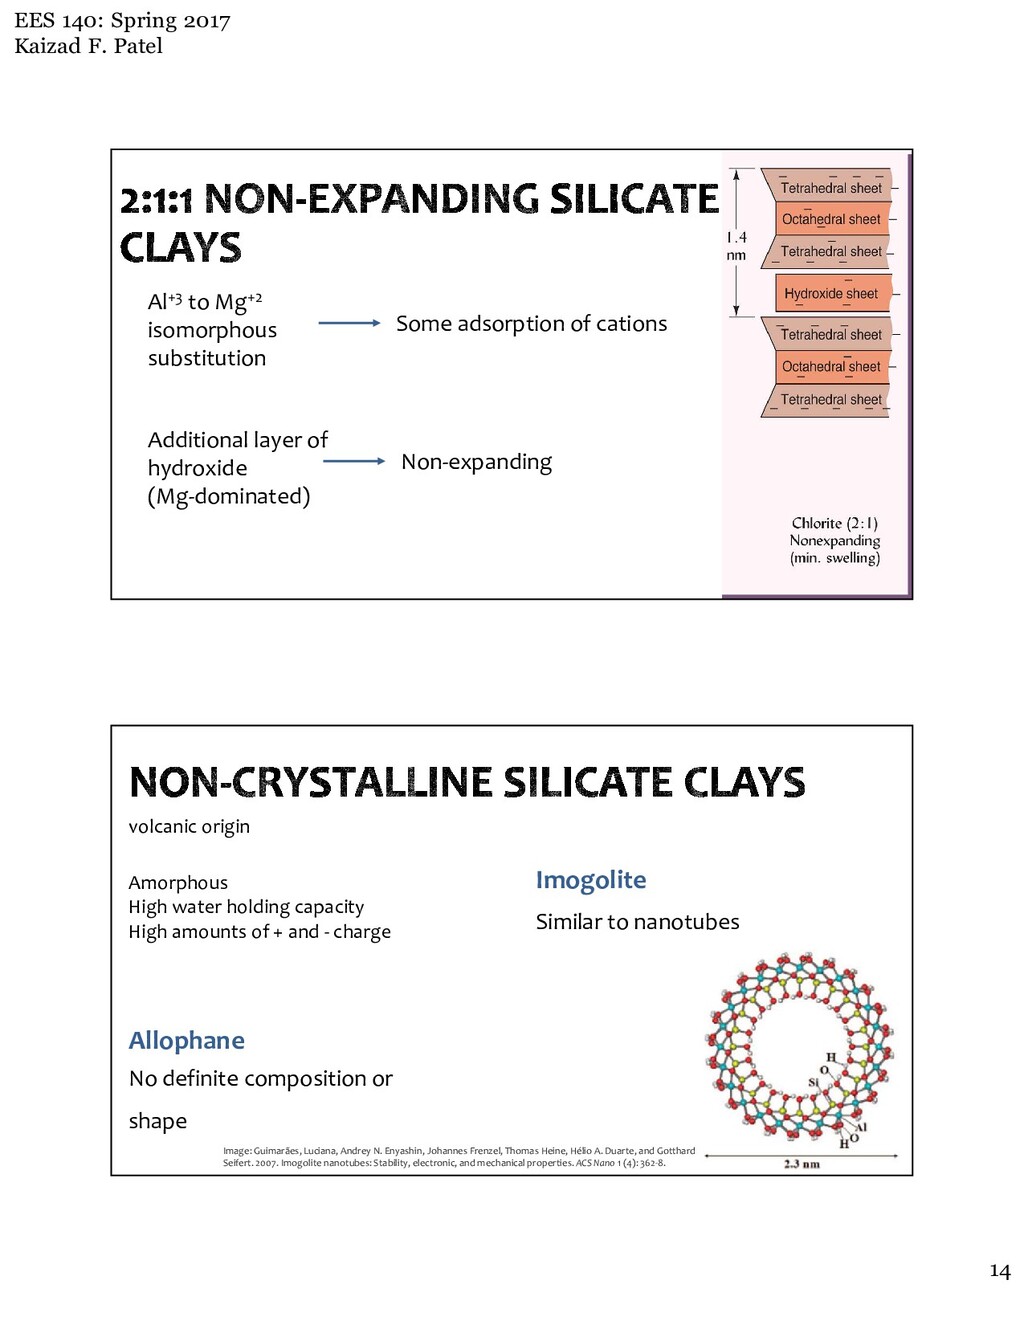
    to Mg+2 isomorphous substitution Some adsorption of cations Additional layer of hydroxide (Mg-dominated) Non-expanding Allophane No definite composition or shape Imogolite Similar to nanotubes 28 volcanic origin Amorphous High water holding capacity High amounts of + and - charge Image: Guimarães, Luciana, Andrey N. Enyashin, Johannes Frenzel, Thomas Heine, Hélio A. Duarte, and Gotthard Seifert. 2007. Imogolite nanotubes: Stability, electronic, and mechanical properties.ACS Nano 1 (4): 362-8.
  15. EES 140: Spring 2017 Kaizad F. Patel 15 Octahedral sheets

    Isomorphous substitution rare Non-expanding 29 e.g. gibbsite, hematite Gibbsite (Al) Highly weathered Tropical and subtropical soils Low CEC 30 H bonding
  16. EES 140: Spring 2017 Kaizad F. Patel 16 High amount

    of charge, because of OH groups 31 32
  17. EES 140: Spring 2017 Kaizad F. Patel 17 1. Isomorphic

    Substitution 2. Ionization of hydroxyls 3. Ionization of organic functional groups 4. Removal of positive complexes 33 34
  18. EES 140: Spring 2017 Kaizad F. Patel 18 35 Isomorphous

    substitution Si+4 Al+3 net negative charge 36 Isomorphous substitution Al+3 net negative charge Mg+2
  19. EES 140: Spring 2017 Kaizad F. Patel 19 37 Ionization

    of organic functional groups OH H+ O- negative charge hydroxyl 38 Ionization of organic functional groups COOH H+ COO- negative charge carboxyl
  20. EES 140: Spring 2017 Kaizad F. Patel 20 39 Removal

    of positive complexes - + - negative charge isomorphic substitution ionization of hydroxyls ionization of organic functional groups removal of positive complexes 40 pH-independent/ permanent charges pH-dependent charges
  21. EES 140: Spring 2017 Kaizad F. Patel 21 41 low

    pH soils OH negative charge H+ O- OH2 + H+ H+ H+ H+ H+ H+ H+ H+ H+ H+ H+ OH positive charge high pH soils deprotonation protonation less H+ in solution more H+ in solution
  22. EES 140: Spring 2017 Kaizad F. Patel 22 Things you

    should know:  What are ions?  What are cations and anions?  How are cations and anions formed?  Ion vs. atom 43 loose attraction between the charged surface of the soil colloid and the solute adsorption 44
  23. EES 140: Spring 2017 Kaizad F. Patel 23 Water forms

    a bridge between colloid surface and adsorbed ion 45 Outer sphere complexes Ions are weakly held to the colloid Ions are easily replaced Direct bonds between ions and colloid 46 inner sphere complexes Ions are strongly held to the colloid Ions are not easily replaced
  24. EES 140: Spring 2017 Kaizad F. Patel 24 47 Cu+2

    Ca+2 Cu+2 Ca+2 water in water out 48 Ca+2 Na+ - - - - - H+ H+ H+ H+ H+ - - - - - Ca+2 H+ H+ Na+ H+ H+ H+ charge equivalence
  25. EES 140: Spring 2017 Kaizad F. Patel 25 Reversibility Charge

    equivalence Ratio law Anion effects Cation selectivity Complementary cations Principles governing ion exchange 49 50 Reversibility Reaction goes to the left if Na+ is added Na+ H+ H+ Na+
  26. EES 140: Spring 2017 Kaizad F. Patel 26 51 Charge

    equivalence Ca+2 H+ 2H+ Ca+2 H+ Na+ H+ H+ Na+ equivalence of charges, not weights or number of ions 52 Ratio Law Ratio of Ca and Mg on the colloid = ratio of Ca and Mg in soil solution 20 Ca+2 5 Mg+2 16 Ca+2 4 Mg+2 1 Mg+2 4 Ca+2 Ratio on colloid 4:1 Ratio in soil solution 4:1
  27. EES 140: Spring 2017 Kaizad F. Patel 27 53 Anion

    effects Reaction is pulled to the right H+ Ca+2 CaCO3 H2 O H+ CO2 ↑ H+ Ca+2 CaCl2 2H+ H+ 2Cl- Lost from the system Greater cation exchange with CaCO3 CaCO3 used to neutralize soil acidity Al+3 > Sr+2 > Ca+2 > Mg+2 > Cs+ > K+ = NH4+ > Na+ > Li+ Cation selectivity Held more tightly to the colloid Less likely to be displaced Higher charge Smaller hydrated radius 54 Not all cations are adsorbed equally Soil colloids are dominated by Al+3 in humid regions
  28. EES 140: Spring 2017 Kaizad F. Patel 28 Al+3 >

    Sr+2 > Ca+2 > Mg+2 > Cs+ > K+ = NH4+ > Na+ > Li+ Complementary cations Mg+2 preferentially displaced 55 (neighboring cations) Al+3 Mg+2 Na+ preferentially displaced Na+ Mg+2 56 1 mole = 6.02 x 10²³ atoms/molecules Avogadro’s number 1 mole = gram atomic/ molecular weight atomic/ molecular weight in grams 1 mole of C = 12 g of C 1 mole of C = 6.02 x 10²³ atoms of C
  29. EES 140: Spring 2017 Kaizad F. Patel 29 57 1

    eq = 1 mole valence quantity of an ion that possesses 1 mole of charge 1 eq Na+ = 1 mole Na+ = 6.02 x 10²³ ions 1 eq Ca+2 = 1/2 mole Ca+2 = (6.02 x 10²³)/2 ions equivalent weight = molecular weight valence Atomic weight of Ca+2 = ~40 g 1 mole of Ca+2 weighs 40 g 1 eq Ca+2 = atomic weight/valence = 40/2 = 20 g 1 meq of Ca+2 = 20 mg = 0.02 g What is the mass of a meq of calcium? 58
  30. EES 140: Spring 2017 Kaizad F. Patel 30 1 Molar

    (1M) solution = 1 mole of solute in 1 L of solution 1 Normal (1N) solution = 1 g equivalent weight in 1 L of solution 59 Molarity and Normality HCl, molecular weight ~36.5 1 mole HCl = 36.5 g HCl 1 eq HCl = 36.5 g HCl 1M HCl = 36.5 g HCl in 1L solution 1N HCl = 36.5 g HCl in 1L solution H2 SO4 , molecular weight ~98 1 mole H2 SO4 = 98 g H2 SO4 1 eq H2 SO4 = 49.5 g H2 SO4 1M H2 SO4 = 98 g H2 SO4 in 1L solution 1N H2 SO4 = 49.5 g H2 SO4 in 1L solution essential chemistry Units meq/100 g or cmolc kg-1 number of centimoles of positive charge (cmolc ) that can be adsorbed per unit mass 60
  31. EES 140: Spring 2017 Kaizad F. Patel 31 Cation Exchange

    Capacity = net negative charge in soils Anion Exchange Capacity = net positive charge in soils Ca+2 Ca+2 Na+ Al+3 - - - - - - - - net positive charge adsorbed on the soils 61 Type of clay/ colloid 62 Typical CEC ranges in soil colloids (cmolc /kg) Kaolinite 1-15 Vermiculite 100-200 Smectite 80-150 OM 100-500 Fe/Al Oxides 0-5 Degree of expansion (surface area) Isomorphous substitution
  32. EES 140: Spring 2017 Kaizad F. Patel 32 Amount of

    clay (texture) 63 Surface area Number of charges Soil Organic Matter 64 Surface area Ionizable functional groups charges
  33. EES 140: Spring 2017 Kaizad F. Patel 33 pH 65

    pH-dependent vs. independent charges 66 CEC increases with increasing pH AEC increases with decreasing pH
  34. EES 140: Spring 2017 Kaizad F. Patel 34 67 CEC

    decreases with decreasing pH AEC increases with decreasing pH Buffered methods CEC measured at pH 7.0 or 8.2 “potential”/ “maximum” CEC, if acidic soils Unbuffered methods CEC measured at actual pH of soil “effective CEC” 68 The pH of the method is important
  35. EES 140: Spring 2017 Kaizad F. Patel 35 69 proportion

    of CEC satisfied by a particular cation Cation cmolc /kg Na+ 5 K+ 10 Ca+2 50 Mg+2 30 Others 5 Total 100 What is the calcium saturation percentage? 50% 70 High ion saturation = Ion is more available for plant uptake
  36. EES 140: Spring 2017 Kaizad F. Patel 36 Cation cmolc

    /kg Na+ 5 K+ 10 Ca+2 50 Mg+2 30 Others 5 Total 100 What is the calcium saturation percentage? proportion of CEC satisfied by base cations 95% 71 Base cations 1. K+ 2. Ca+2 3. Mg+2 4. Na+ Na+ is non-essential for plants Loamy Sand Silt Loam 50% percentage of CEC occupied by base cations CEC = 5 meq/100g CEC = 20 meq/100g 50% 50% BS = 2.5 meq/100g + 2 meq/100g = 4.5 meq/100g new BS = 4.5/5 = 90% 72 90% before after 60% before after How does %BS change after adding 2 meq/100g of base cations to the soil cation exchange sites?
  37. EES 140: Spring 2017 Kaizad F. Patel 37 Buffer capacity:

    a unitless soil characteristic strongly associated with soil CEC high CEC = greater buffer capacity 73 Acid buffering pH of the soil remains relatively constant 74 high CEC = greater buffer capacity = more limestone needed to increase pH low CEC = low buffer capacity = less limestone needed to increase pH Determining the amount of limestone needed to increase the pH to 6.5: effect of CEC limestone: calcium carbonate, CaCO3
  38. EES 140: Spring 2017 Kaizad F. Patel 38 75 less

    limestone needed if initial pH is 5.5 Soil A Soil B CEC (meq/100g) 100 60 BS (%) 70 70 1. Which soil is more buffered? 2. How many meq/100g of bases would be required to increase the BS of soil A to 80% 3. How much would be required as mg of Ca? 76 A 10 meq/100g 5 mmoles, 200 mg
  39. EES 140: Spring 2017 Kaizad F. Patel 39 77 78

    pH = – log [H+] negative log of hydrogen ion activity hydrogen ion is responsible for acidity [H+]↑ pH↓
  40. EES 140: Spring 2017 Kaizad F. Patel 40 H+ H+

    Ca+2 Ca+2 Ca+2 K+ Mg+2 Mg+2 Ca+2 Al+3 Na+ Na+ Ca+2 Mg+2 Ca+2 Na+ Activity = effective concentration Concentration = absolute mass per unit volume 79 Activity vs. Concentration 80
  41. EES 140: Spring 2017 Kaizad F. Patel 41 The pH

    scale basic (alkaline) acidic neutral 0 5 6 7 8 9 14 100 10-5 10-6 10-7 10-8 10-9 10-14 1 0.00001 0.000001 0.0000001 0.00000001 0.000000001 0.00000000000001 pH [H+] mol L-1 neutral does not mean no H+ ions [H+] = [OH-] = 10-7 mol L-1 pH decreases by 1 [H+] increases 10x pH increases by 2 [H+] decreases 100x Sorensen scale 82 Soil acidity Production of H+ ions Depletion of base (non-acid) cations more acid cations on soil complex
  42. EES 140: Spring 2017 Kaizad F. Patel 42 83 Organic

    acids COOH H+ COO- carboxyl 84 Organic complexes base cation base cation leaching of base cations
  43. EES 140: Spring 2017 Kaizad F. Patel 43 85 Plant

    uptake of base cations Ca+2 2H+ NH4 + H+ root interior Ca+2 SO4 -2 root interior Uptake of cations balanced by uptake of anions Uptake of cations balanced by release of H+ pH decreases 86 Fertilizers NH4 + NH3 + H+ NO3 - + H2 O + 2H+ 2O2 ammonium ammonia nitrate volatilization nitrification
  44. EES 140: Spring 2017 Kaizad F. Patel 44 87 Atmospheric

    deposition “Clean Rain” ~ pH 5.6 NO3 - + H+ SO4 -2 + 2H+ HNO3 H2 SO4 nitric acid sulfuric acid CO2 + H2 O → H2 CO3 ⇌ HCO3 - + H+ carbonic acid (weak) Rainwater contributes to acidity: 1. production of H+ ions 2. removal of non-acid cations 88 Aluminum hydrolysis Al+3 + H2 O ⇌ Al(OH)+2 + H+ Al(OH)+2 + H2 O ⇌ Al(OH)2 + + H+ Al(OH)2 + + H2 O ⇌ Al(OH)3 + H+ Al+3 + 3H2 O ⇌ Al(OH)3 + 3H+ One Al+3 ion can release three H+ ions acid cation
  45. EES 140: Spring 2017 Kaizad F. Patel 45 89 Biocycling

    (leaf litter) Alfalfa Red Maple Red Spruce % Ca 2.3 1.29 0.79 % Mg 0.65 0.40 0.20 % K 2.63 0.42 0.35 1. Active Acidity (~ x1) 2. Exchangeable Acidity (~ x100+) 3. Residual Acidity (~ x1,000-100,000) 90 Types/ pools of Soil Acidity
  46. EES 140: Spring 2017 Kaizad F. Patel 46 91 H+

    H+ H+ H+ H+ H+ H+ H+ H+ H+ H+ H+ H+ H+ active acidity exchange ions exchangeable acidity H H H Al Al Al Al H H H Non-exchangeable H and Al are released at high pH residual acidity Negative charges are freed up CEC increases The equilibrium between the three pools of acidity helps buffer soils of intermediate pH (5-7). pH values in salt solution are lower than in water 92 pH can be measured in water, or in salt solution
  47. EES 140: Spring 2017 Kaizad F. Patel 47 93 Measuring

    pH pH meter (laboratory) Color test and pH meter (field) pH paper 94 Why is soil pH important?
  48. EES 140: Spring 2017 Kaizad F. Patel 48 95 Nutrient

    availability pH Co Cu Fe Mn Ni Zn Mo P: available pH 5-7 Available at high pH Most macronutrients Mo micronutrients base cations: greater availability at high pH acid cations: greater availability at low pH 96 Nutrient availability: Aluminum toxicity Aluminum becomes more available Root uptake of Al Damages root membranes Stunted root system Drought stress (because of roots)
  49. EES 140: Spring 2017 Kaizad F. Patel 49 97 Nutrient

    availability: phosphorus 98 Soil biology Preferred pH of microbe groups Bacteria 6 to 8 Actinomycetes 7 to 7.5 Fungi 4 to 8 Predominant at low pH Different organisms have different preferred pH ranges
  50. EES 140: Spring 2017 Kaizad F. Patel 50 N a,

    2 K, 3 M g, 10 Ca, 65 Al/H , 20 Ap Modified from Bear (1964) % 99 An “Ideal” Ap Horizon CEC Composition East Bear Exchangeable Cation Composition cmol c kg-1 0 5 10 15 20 25 30 C 25-C 5-25 5-cm O-Hor Na K Mg Ca Al H pH = 3.77 pH = 4.17 pH = 4.51 pH = 4.74 pH = 4.70 O 5 (Bh/s) 5-25 (Bs) 25-C (BC) C A “Representative” Undisturbed Maine Forest Soil Exchange Complex 100
  51. EES 140: Spring 2017 Kaizad F. Patel 51 Some amendments

    increase pH Lime (calcium carbonate) Wood ash (rich in calcium) OM (rich in calcium) Some amendments decrease pH OM (forming organic acids) Sulfur 2S + 3O2 + 2H2 O → 2H2 SO4 101 102 Neutralizing soil acidity by liming Reaction is pulled to the right H+ Ca+2 CaCO3 H2 O H+ CO2 ↑ Lost from the system
  52. EES 140: Spring 2017 Kaizad F. Patel 52 % BS

    pH 103 Base saturation increases with pH Biogeochemistry
  53. EES 140: Spring 2017 Kaizad F. Patel 53 105 106

    The Nitrogen Cycle Organic N e.g. amino acids Microbial biomass N mineralization deposition manure biosolids ATMOSPHERE SOIL PLANTS ammonium nitrate inorganic forms of N N2 inert N-fixation ammonia immobilization leaching, loss to streams Nitrous oxide greenhouse gas nitrification denitrification decomposition uptake
  54. EES 140: Spring 2017 Kaizad F. Patel 54 107 The

    Bear Brook Watershed in Maine Three decades of experimental manipulation 108 Acid deposition
  55. EES 140: Spring 2017 Kaizad F. Patel 55 5 10

    15 20 25 30 35 1984 1989 1994 1999 2004 Year Sulfate deposition (kg/ha) Adirondack s (NY 08) Poconos/ Catskills (NY 65) Southern New England (MA 08) Central New England (NH 02) Maine (ME 09) Temporal trends in SO4 deposition (kg/ha) from 1984-2004 at five NADP sites representing each ELS-II region. After Rosfjord 2006 109 Bear Brook Watershed in Maine 110
  56. EES 140: Spring 2017 Kaizad F. Patel 56 West Bear

    Brook Treated East Bear Brook Reference 111 112 West Bear Treatments Initiated Nov, 1989 1800 eq ha-1 yr-1 (NH4 )2 SO4 = 25.2 and 28.8 kg ha-1 yr-1 N and S Added in 6 bi-mo. applications
  57. EES 140: Spring 2017 Kaizad F. Patel 57 Atmospheric Inputs

    (e.g., N, S) Stream Exports The Watershed Black Box 113 INSIDE THE BOX Tree foliar chemistry Tree physiology Understory vegetation Litterfall and decomposition Roots Soil chemistry Soil microbiology Nitrogen mineralization, nitrification Soil solutions Trace gas flux Groundwater Stream chemistry Stream sediments Hydrology Ecosystem mass balance 1 2 3 4 5 6 7 8 114
  58. EES 140: Spring 2017 Kaizad F. Patel 58 I II

    IV III V VI VII Constant N and S Loading DBC+ DBC- Soil BS% Stream Conc. Conceptual Model of Soil and Stream Base Cations 115 Acidic inputs to soil Base cations leached from soil and exported to stream Base cations depleted from soil Acid deposition stops Soils adsorb base cations, so less input to streams Soil Chemistry 116