Exploratory Seminar: Detecting Anomalies in Time Series Data
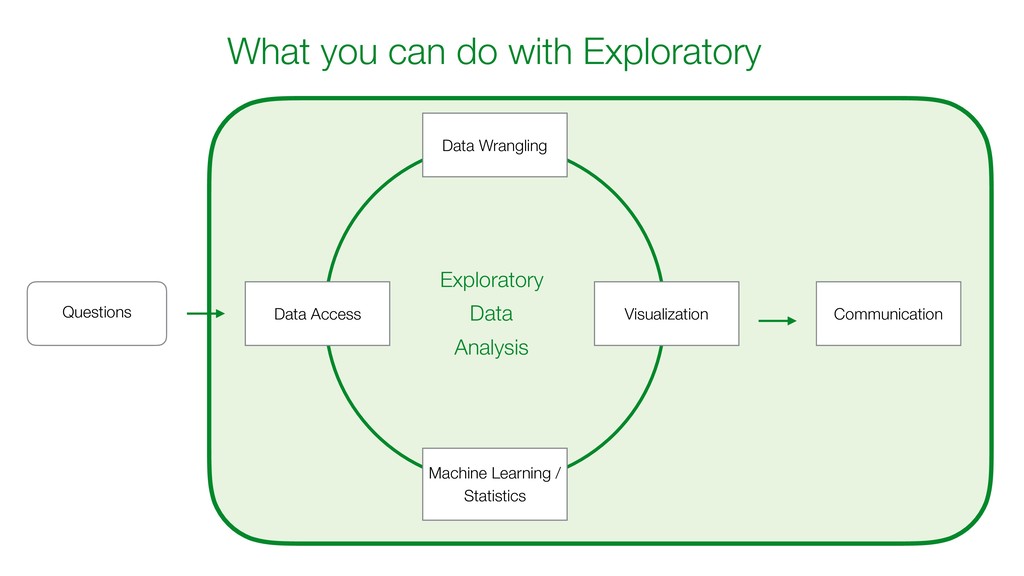
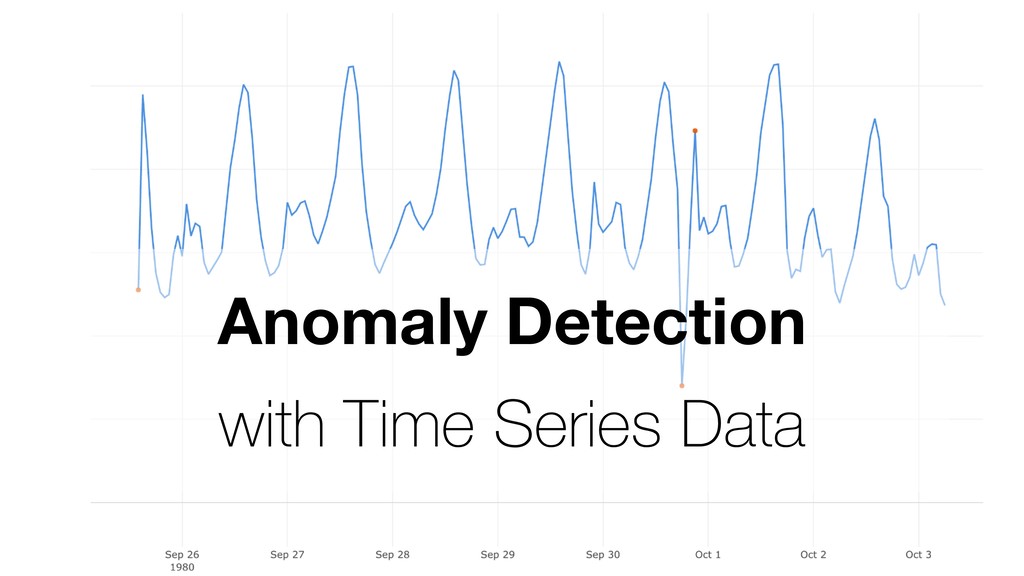
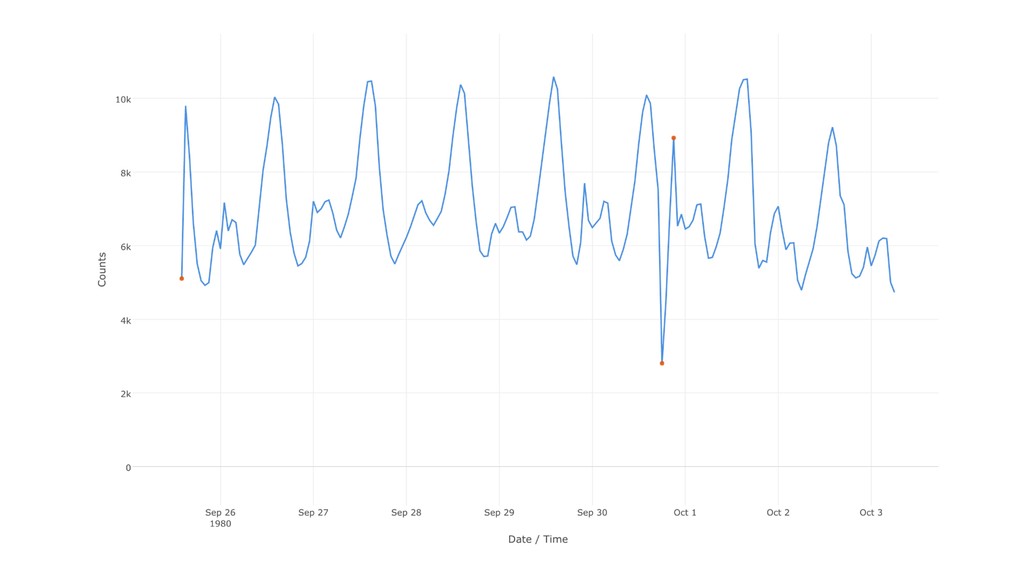
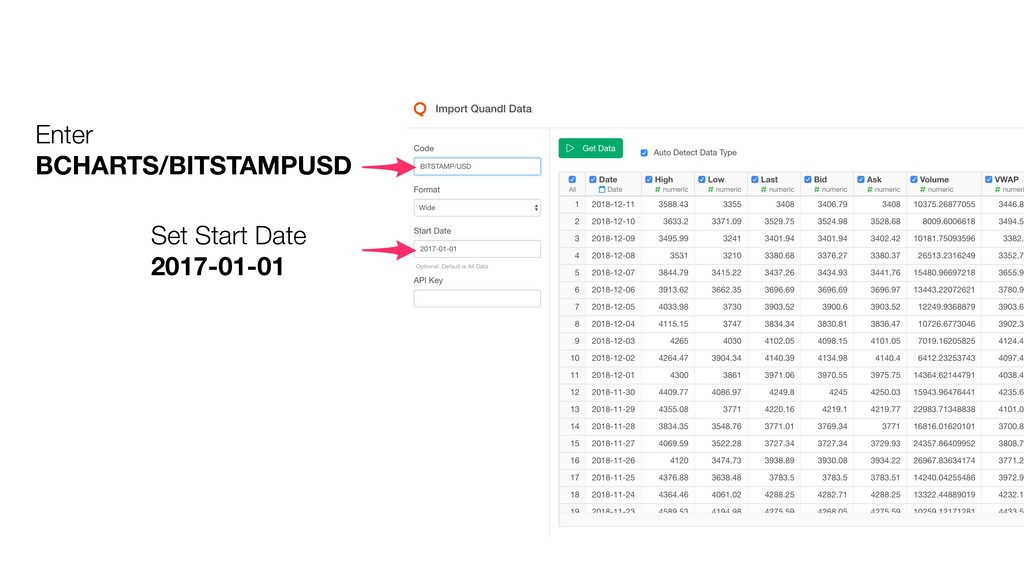
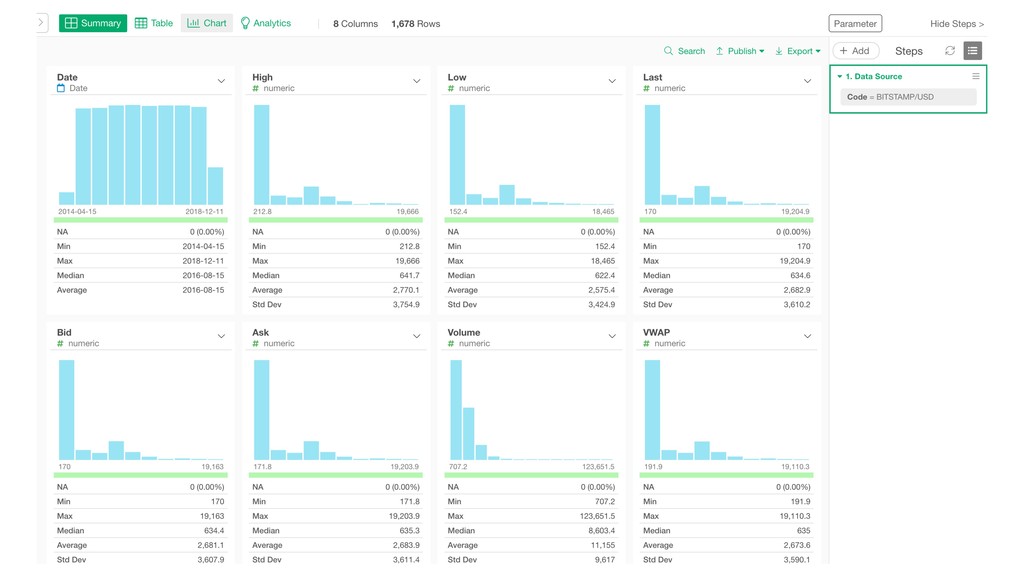
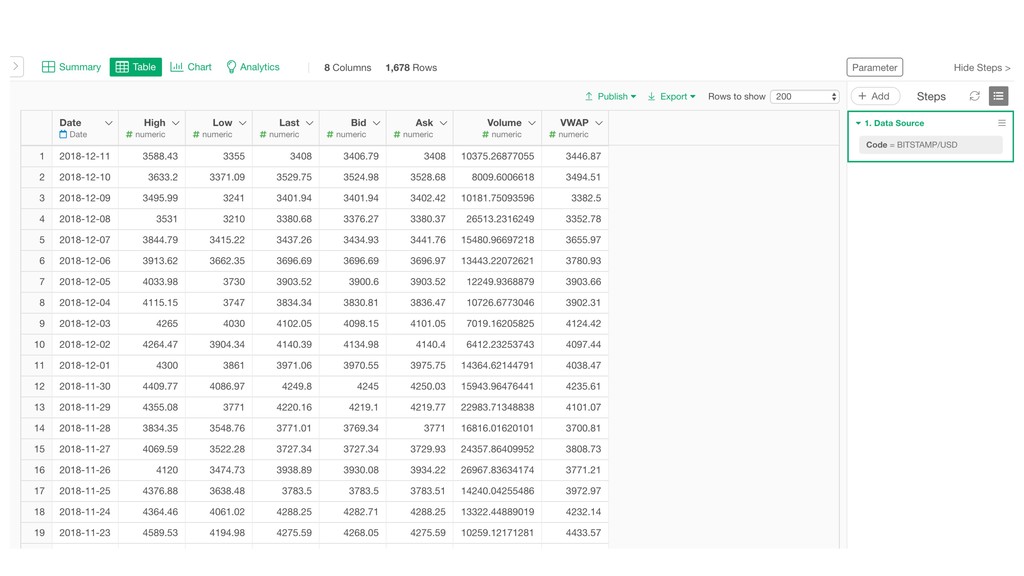
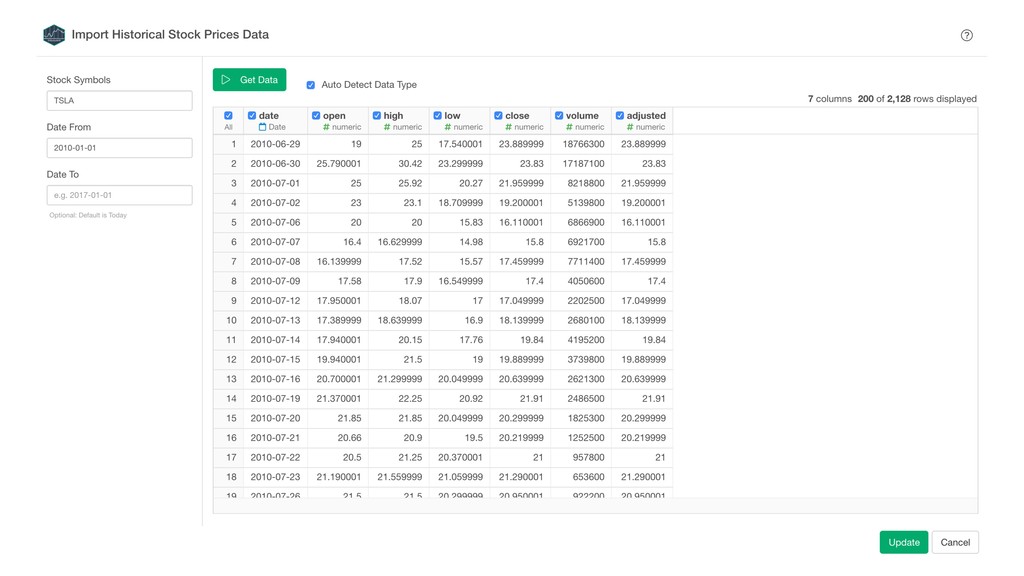
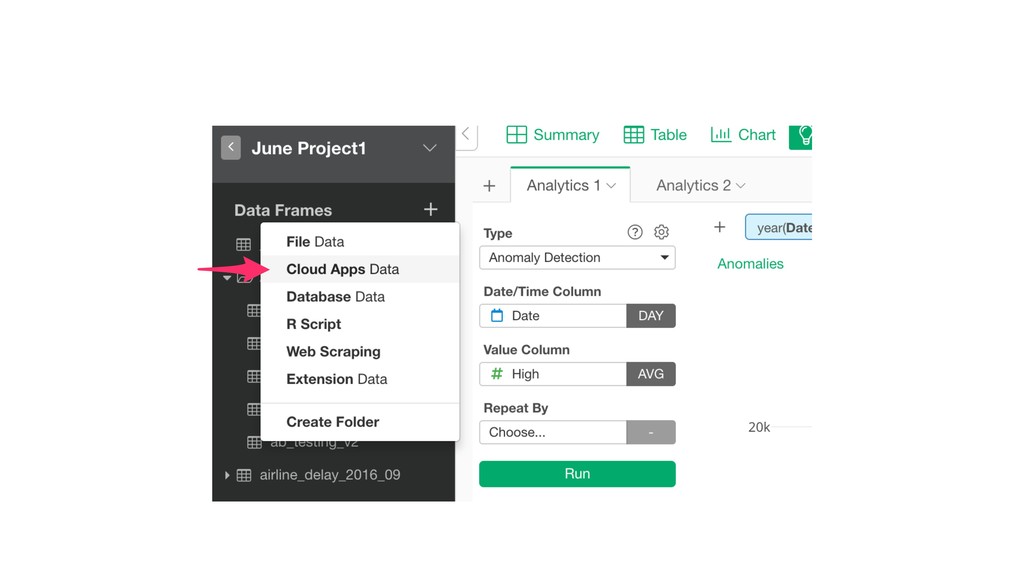
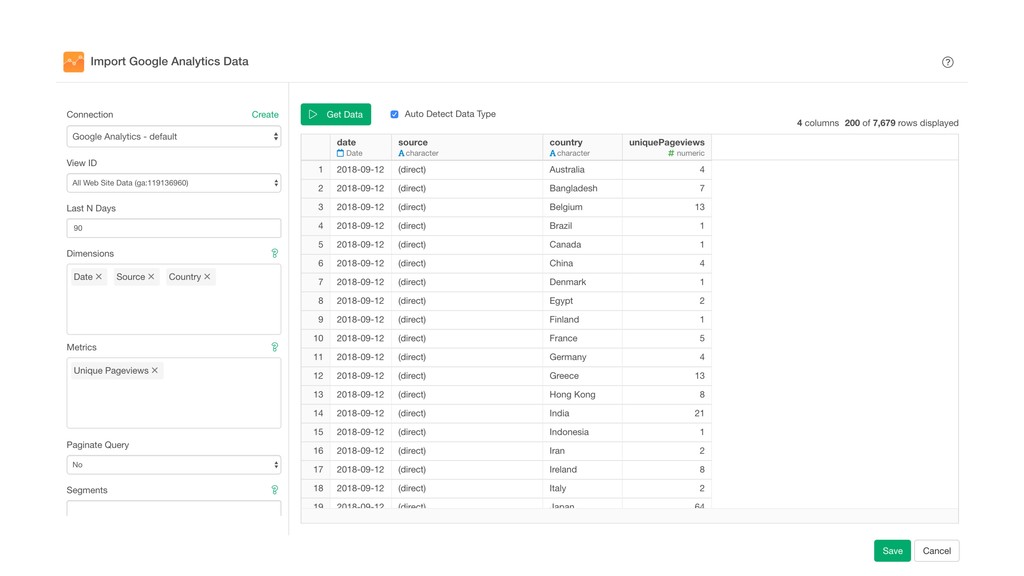
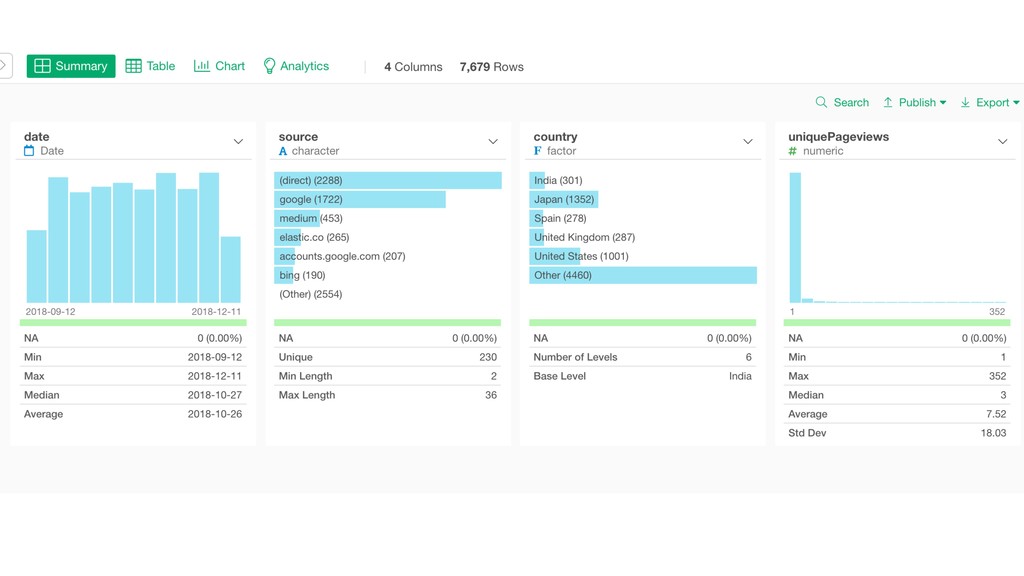
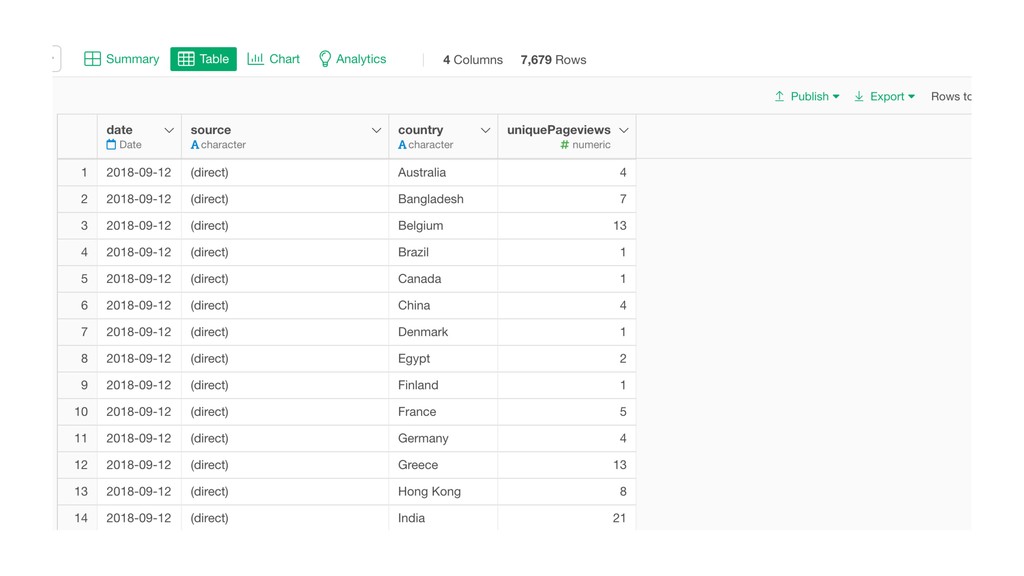
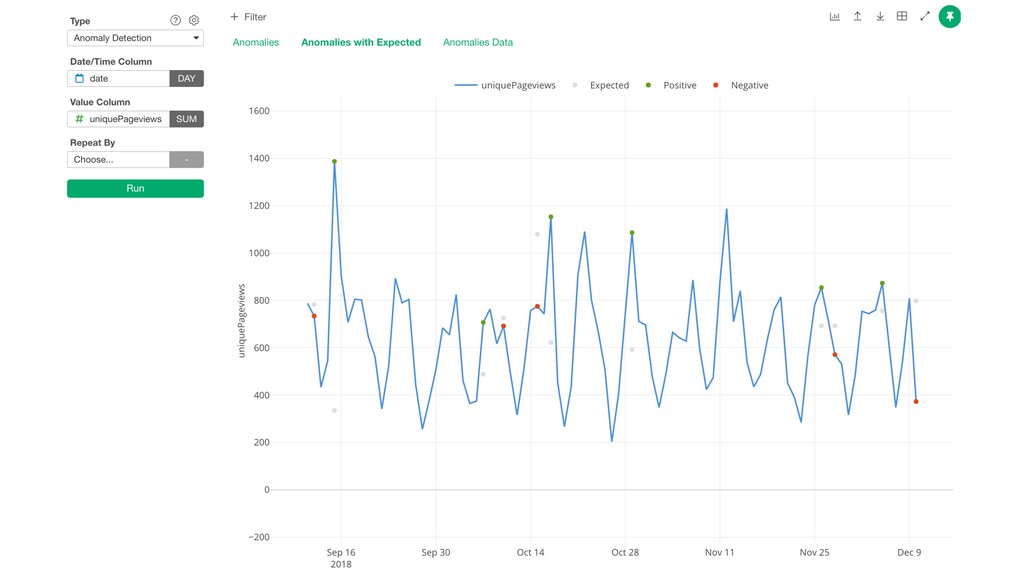
This is for introducing Anomaly Detection algorithm, which was developed by folks at Twitter to detect anomaly data in time series data. Also, for demonstrating it with Exploratory’s Analytics view.
Inc. to make Data Science available for everyone. Prior to Exploratory, Kan was a development director at Oracle leading development teams for building various Data Science products in areas including Machine Learning, BI, Data Visualization, Mobile Analytics, Big Data, etc. While at Oracle, Kan also provided training and consulting services to help organizations transform by data. @KanAugust Instructor
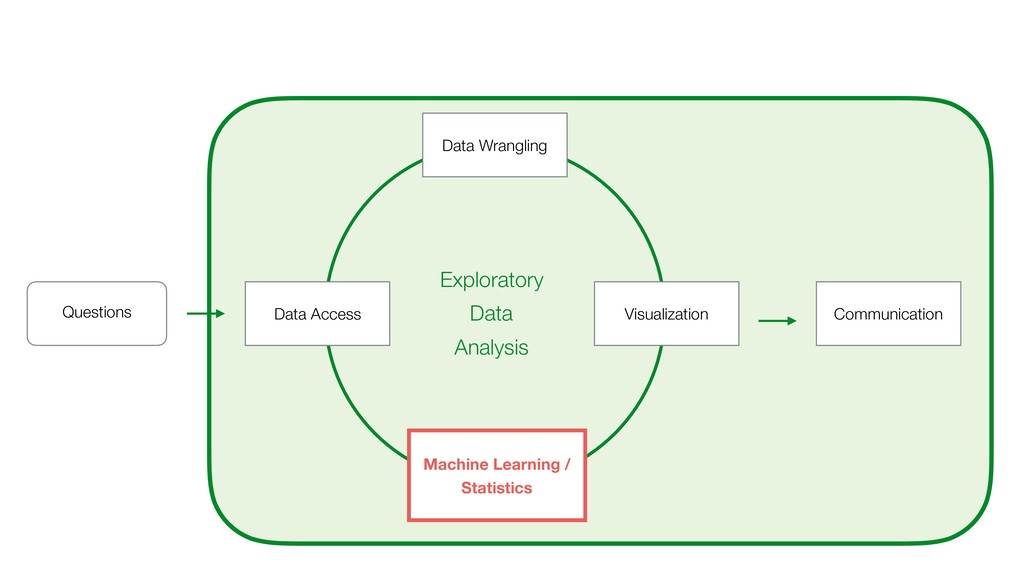
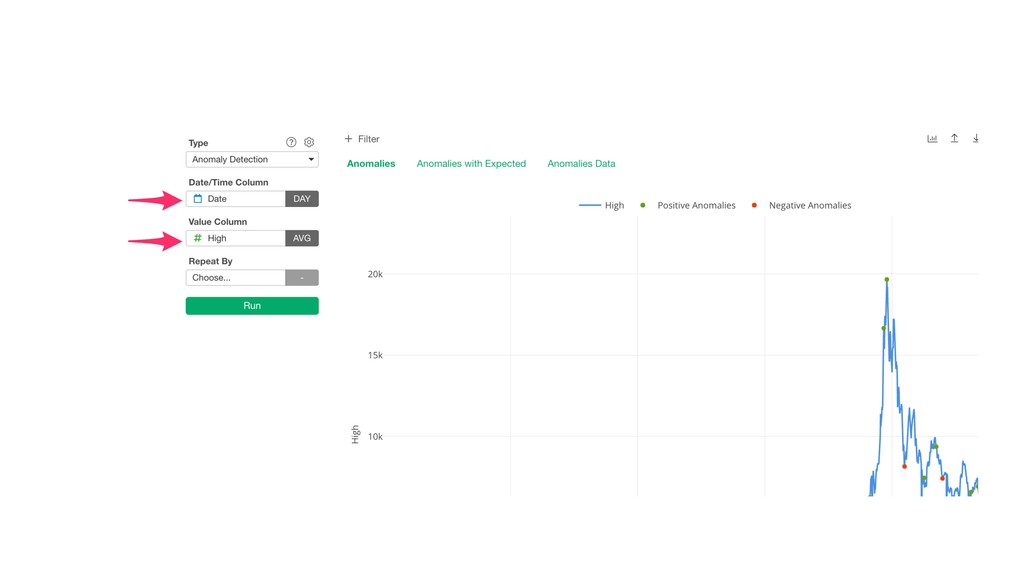
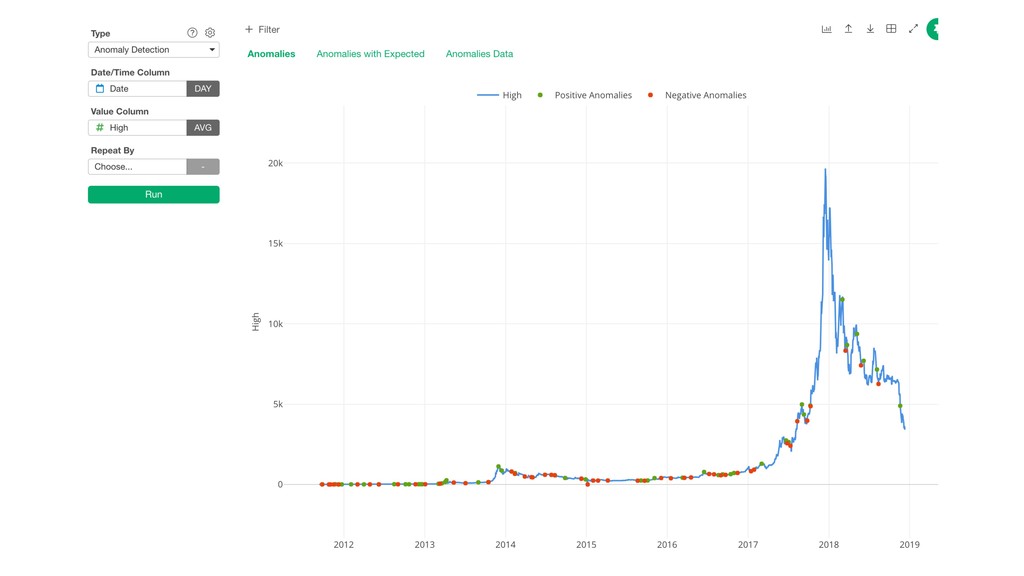
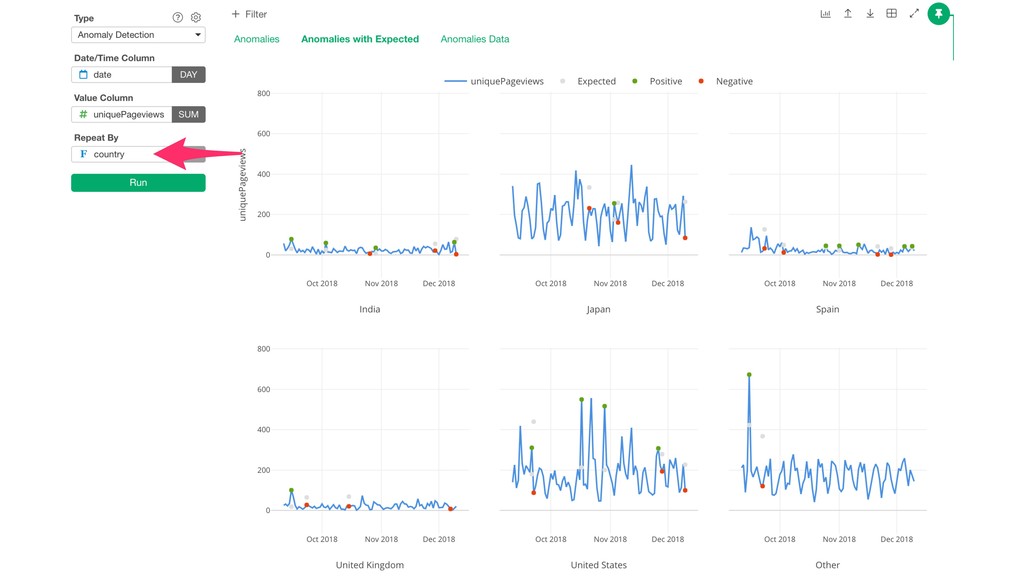
Employs an algorithm referred to as Seasonal Hybrid ESD (S-H-ESD), which can detect both global as well as local anomalies in the time series data by taking seasonality and trend into account. Anomaly Detection
![Contact Email [email protected] Data Science Training https://exploratory.io/training Twitter @KanAugust Online](https://files.speakerdeck.com/presentations/1157021737054eb09b21a781af53c4ed/slide_47.jpg)