Inc. to democratize Data Science. Prior to Exploratory, Kan was a director of product development at Oracle leading teams to build various Data Science products in areas including Machine Learning, BI, Data Visualization, Mobile Analytics, Big Data, etc. While at Oracle, Kan also provided training and consulting services to help organizations transform with data. @KanAugust Speaker
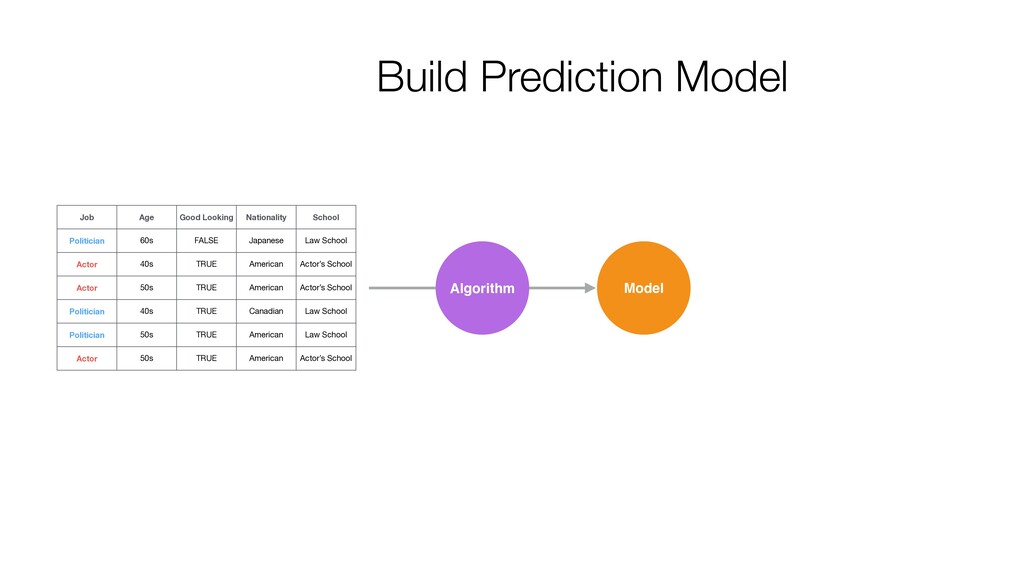
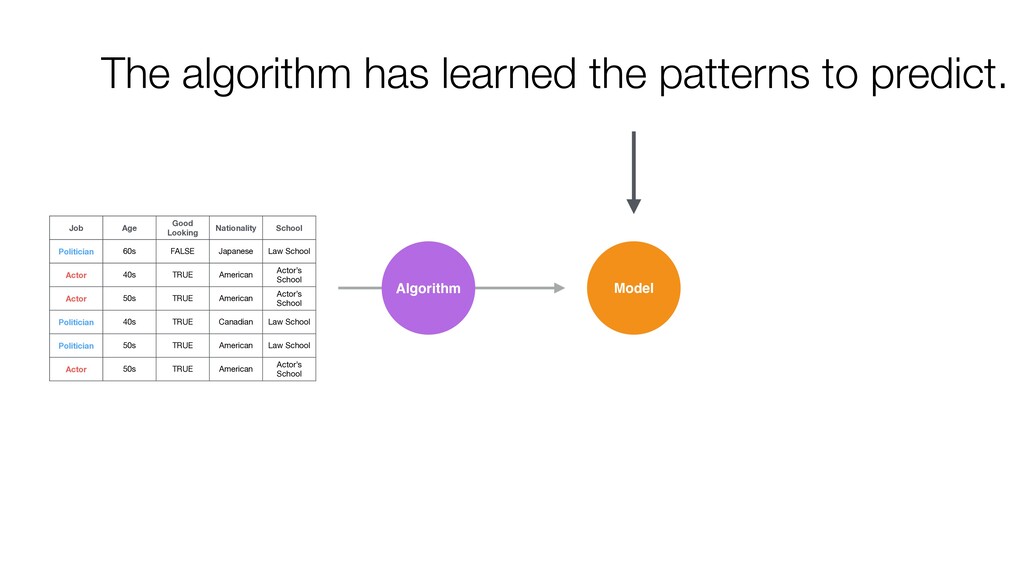
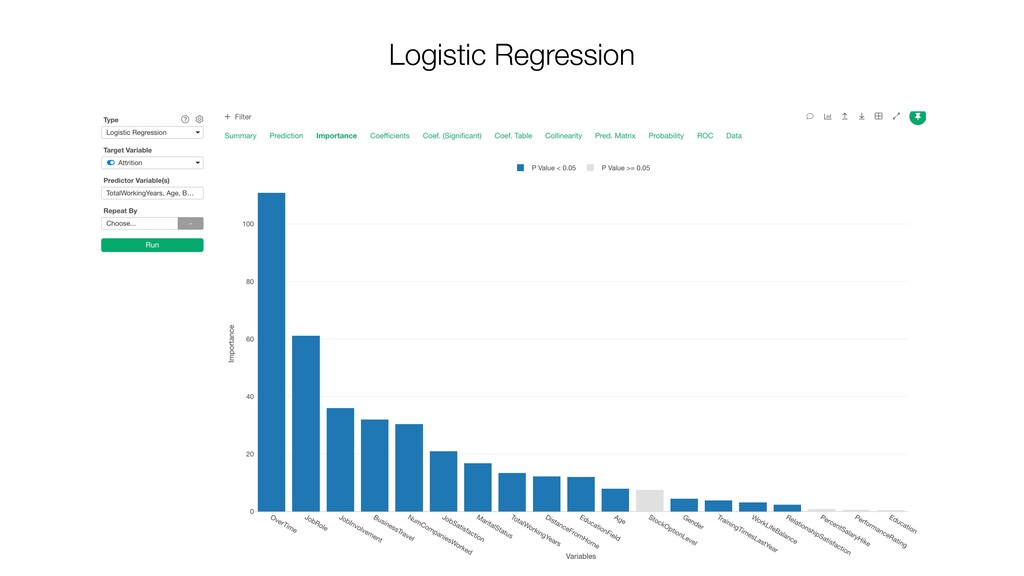
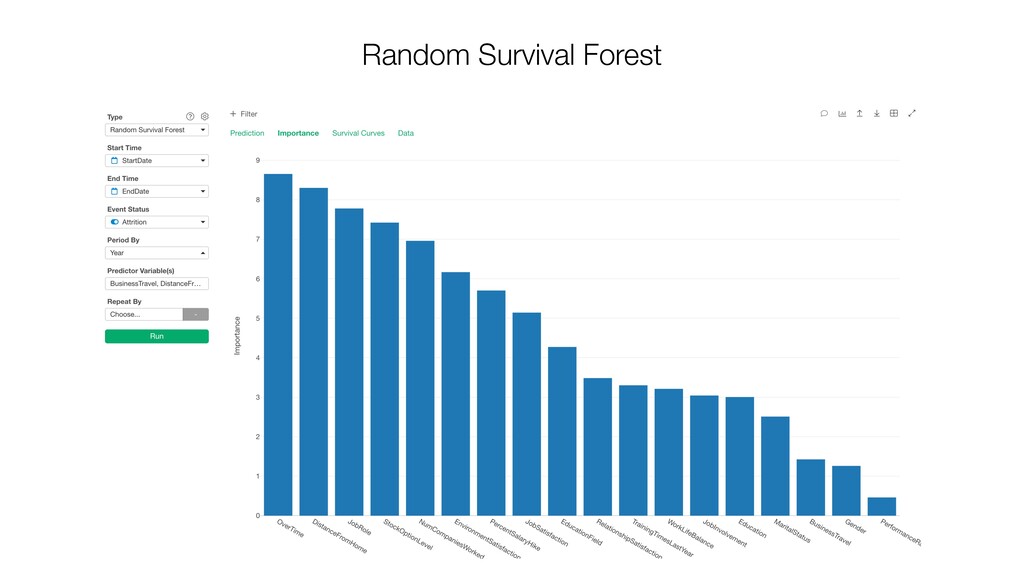
Law School Actor 40s TRUE American Actor’s School Actor 50s TRUE American Actor’s School Politician 40s TRUE Canadian Law School Politician 50s TRUE American Law School Actor 50s TRUE American Actor’s School Algorithm Model Build Prediction Model
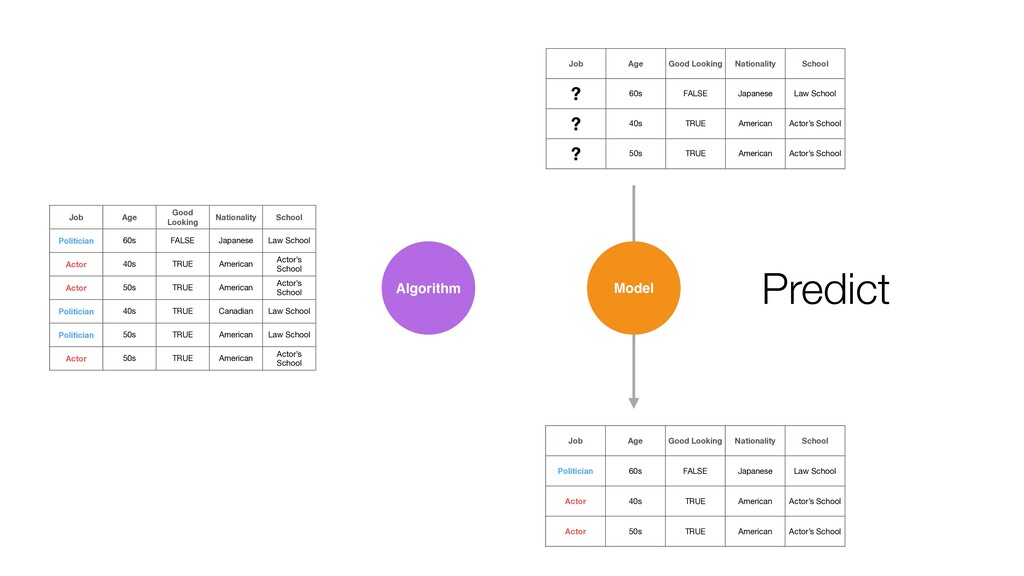
Law School Actor 40s TRUE American Actor’s School Actor 50s TRUE American Actor’s School Politician 40s TRUE Canadian Law School Politician 50s TRUE American Law School Actor 50s TRUE American Actor’s School Algorithm Model Job Age Good Looking Nationality School ? 60s FALSE Japanese Law School ? 40s TRUE American Actor’s School ? 50s TRUE American Actor’s School Job Age Good Looking Nationality School Politician 60s FALSE Japanese Law School Actor 40s TRUE American Actor’s School Actor 50s TRUE American Actor’s School Predict
Job Age Good Looking Nationality School Politician 60s FALSE Japanese Law School Actor 40s TRUE American Actor’s School Actor 50s TRUE American Actor’s School Politician 40s TRUE Canadian Law School Politician 50s TRUE American Law School Actor 50s TRUE American Actor’s School
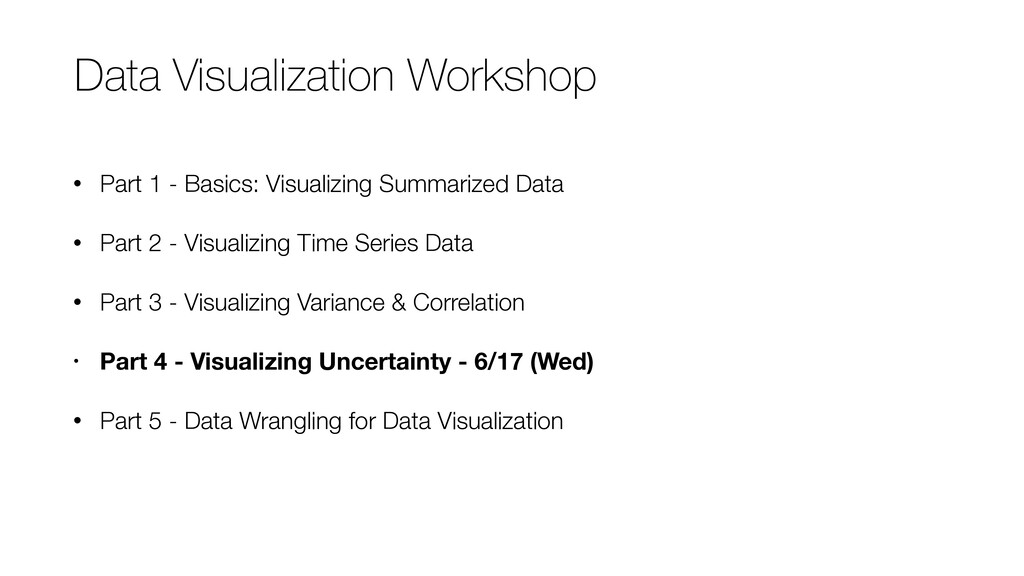
2 - Visualizing Time Series Data • Part 3 - Visualizing Variance & Correlation • Part 4 - Visualizing Uncertainty - 6/17 (Wed) • Part 5 - Data Wrangling for Data Visualization Data Visualization Workshop
![Information Email [email protected] Website https://exploratory.io Twitter @KanAugust Training https://exploratory.io/training](https://files.speakerdeck.com/presentations/5d439209e3384403a89d977b19ecc817/slide_125.jpg)