We have released Exploratory v6.5 on 4/19 with many exciting new features. Kan will introduce some of the new features including the following.
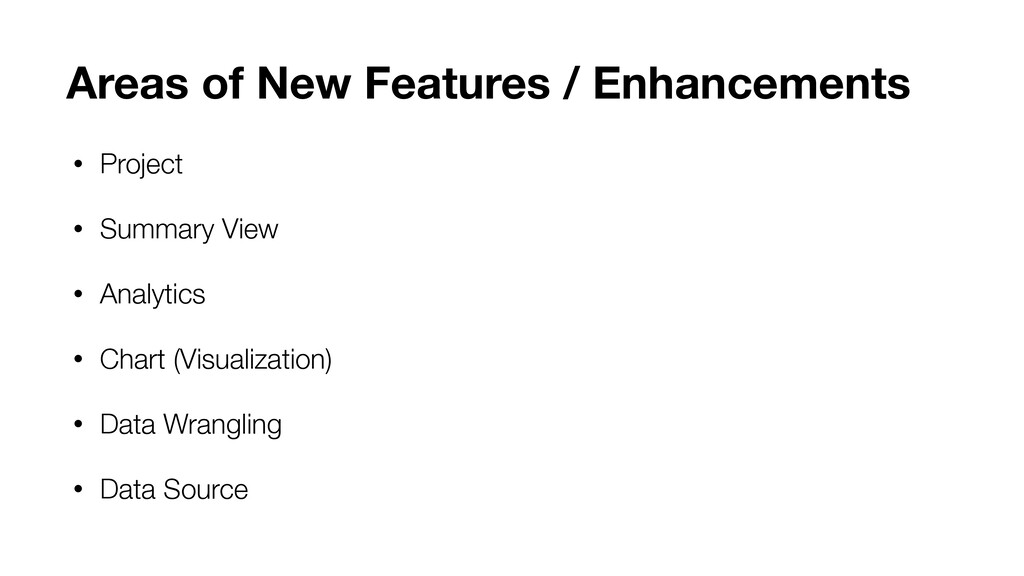
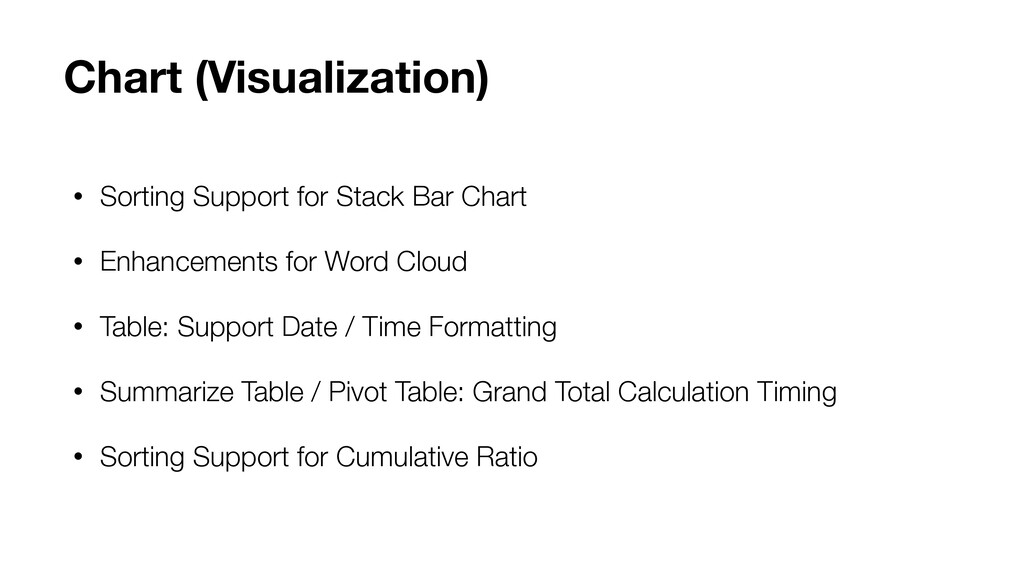
- Summary View: New Chart Types
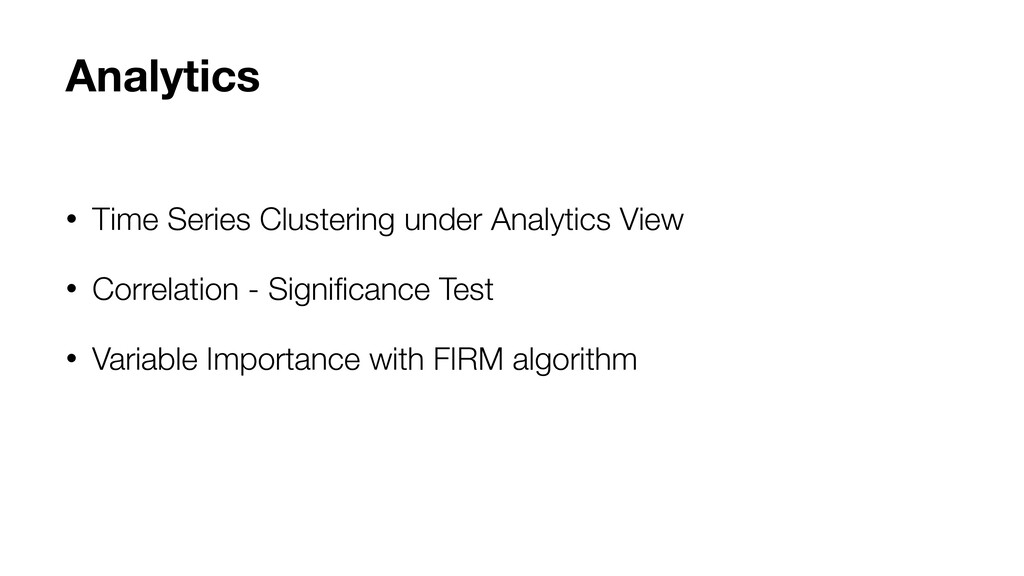
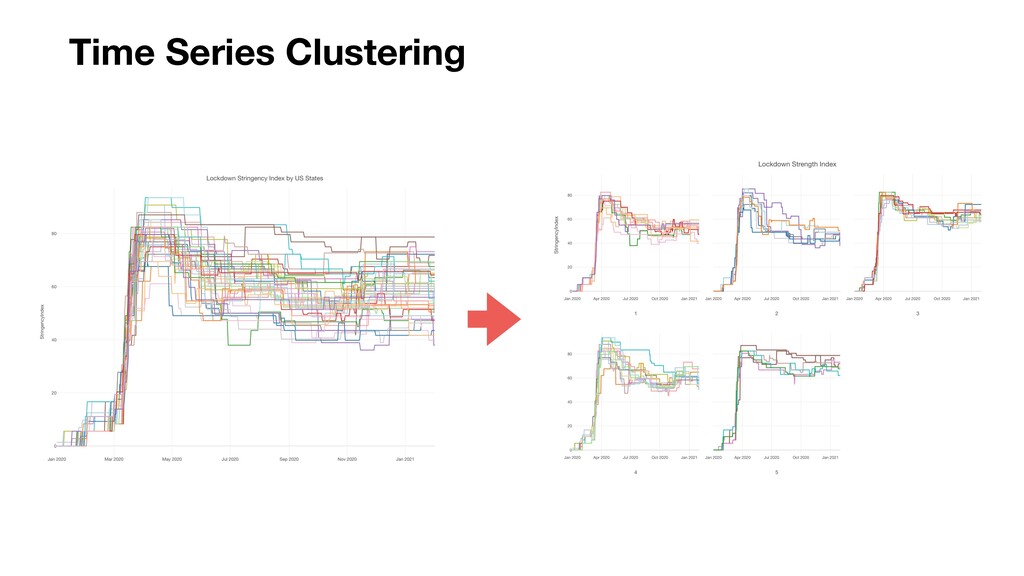
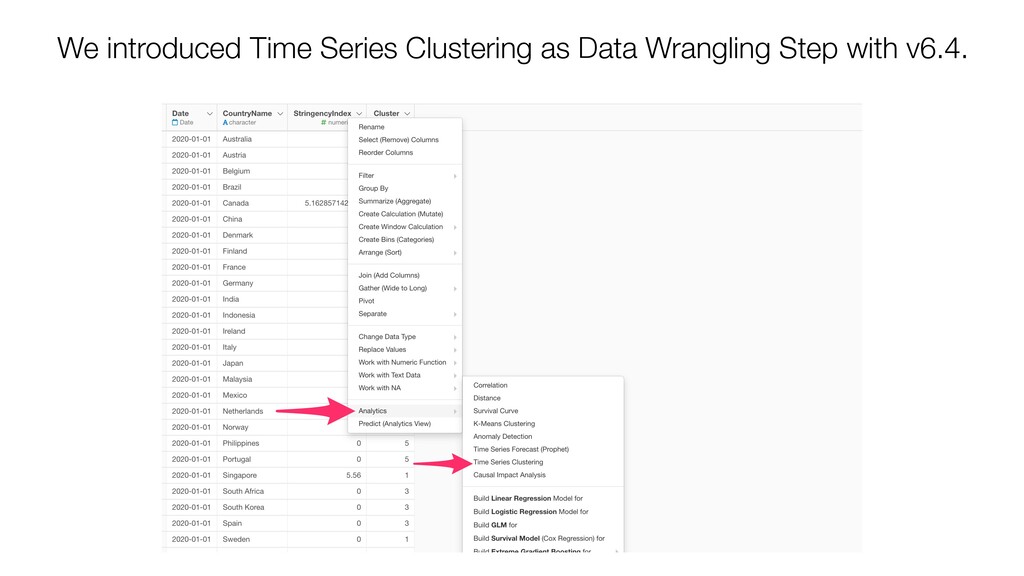
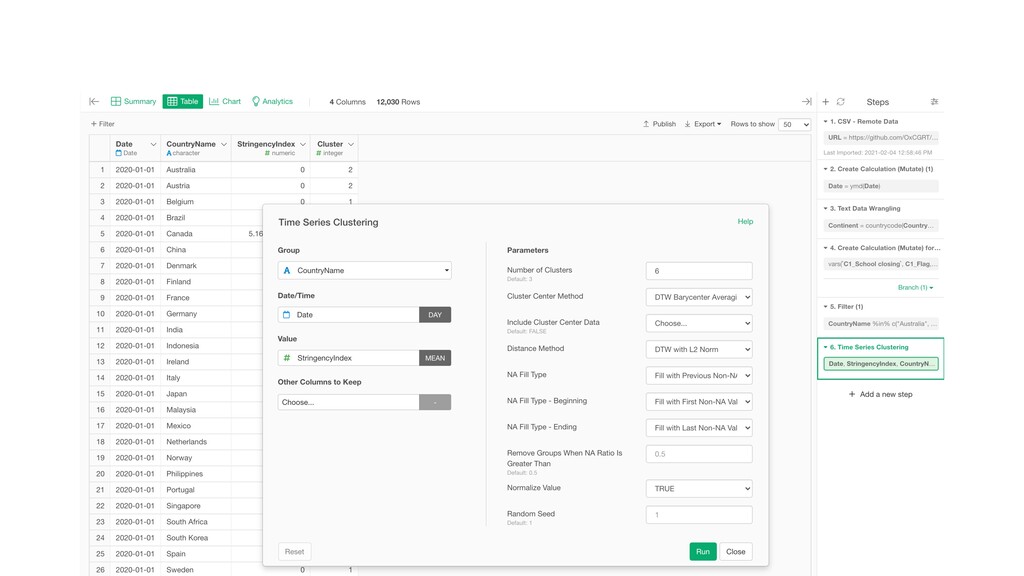
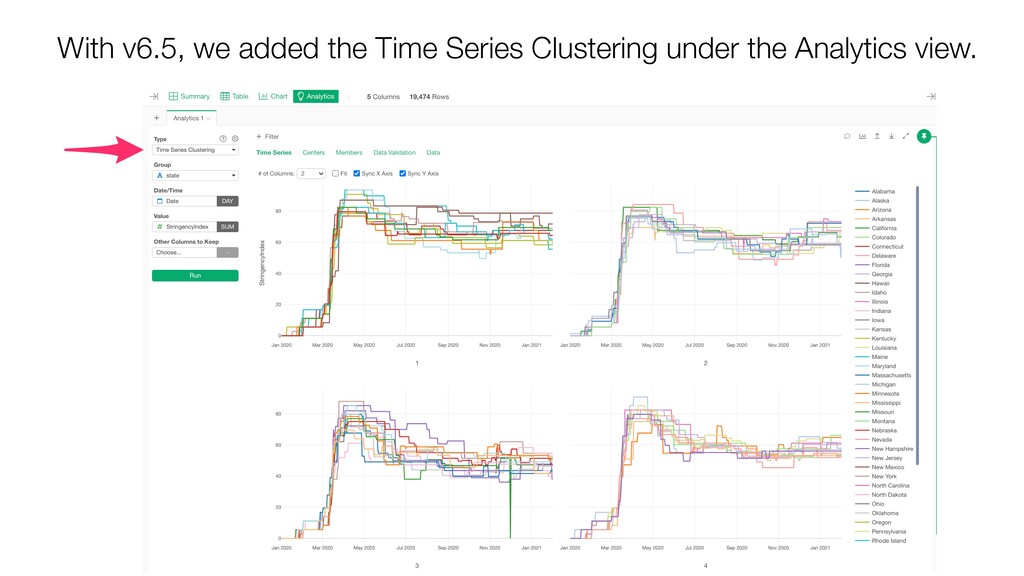
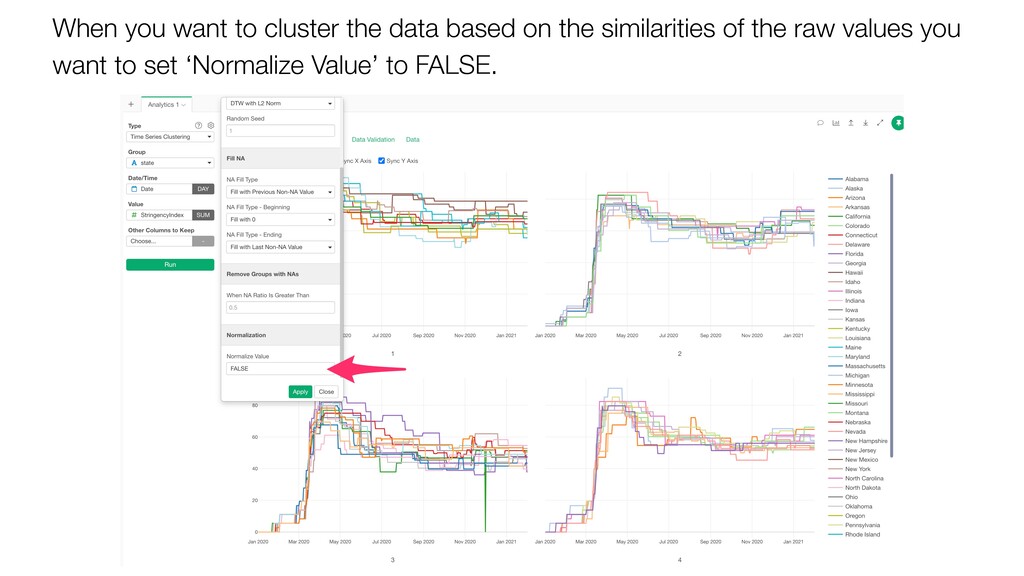
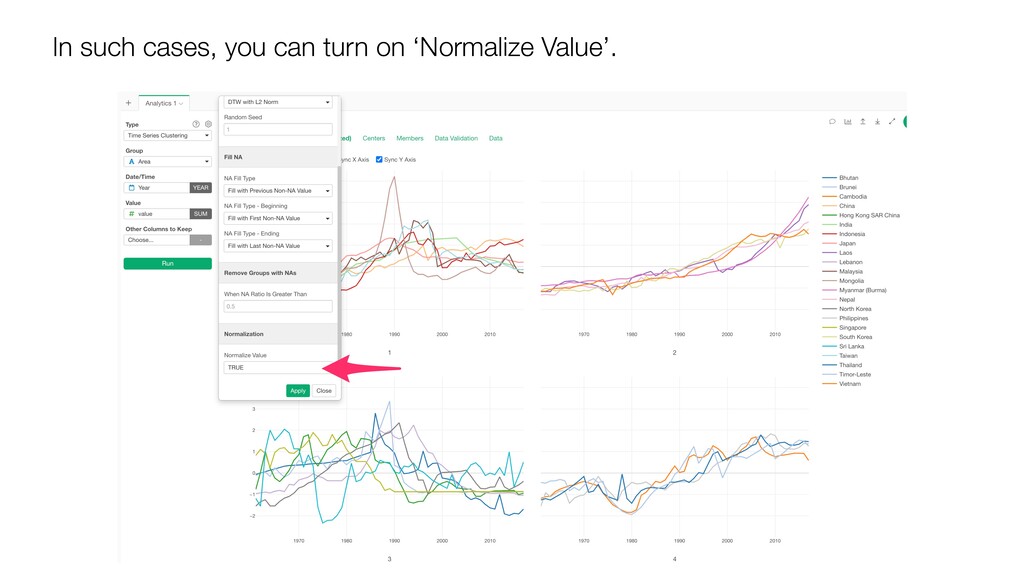
- Analytics: Time Series Clustering
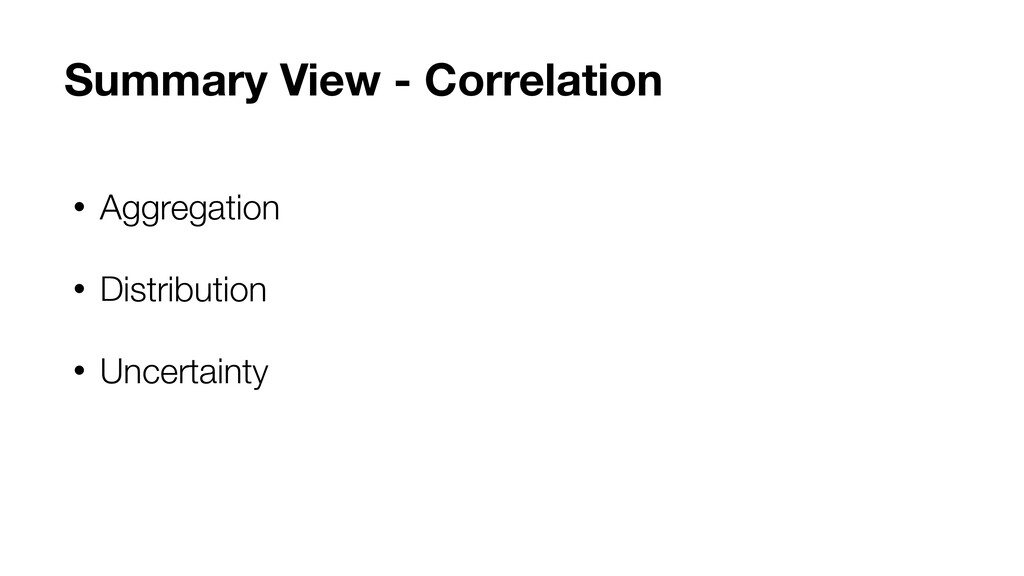
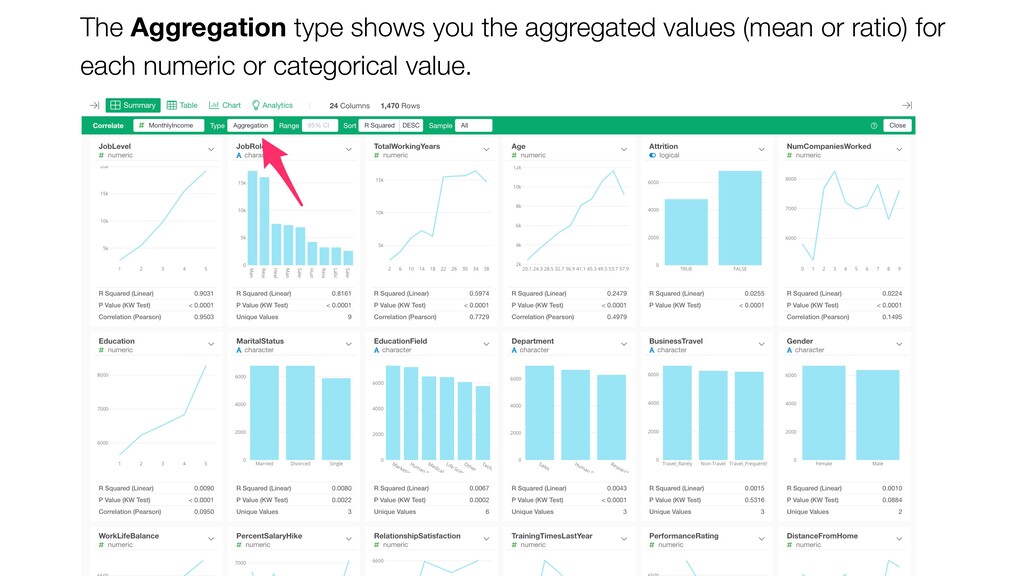
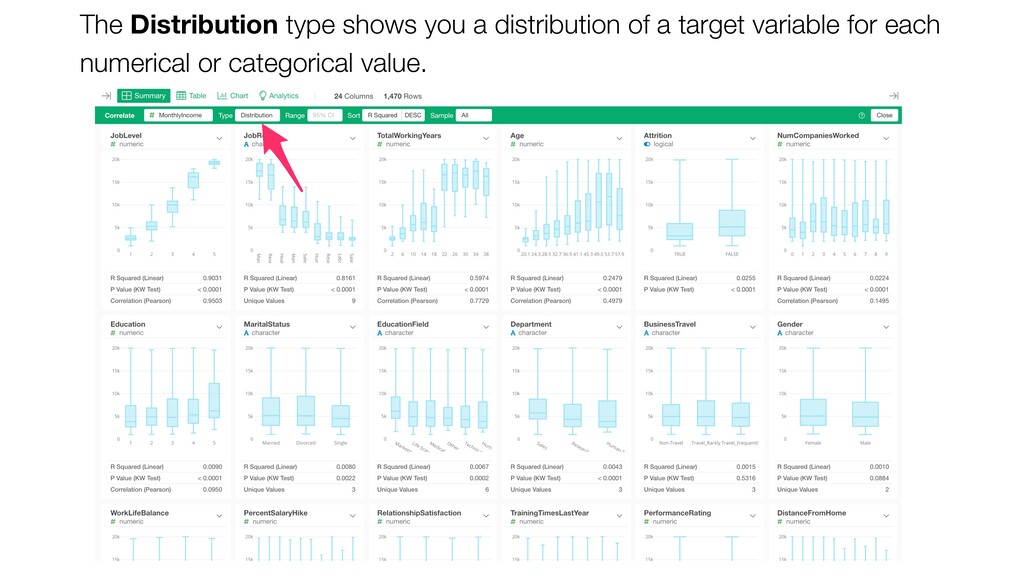
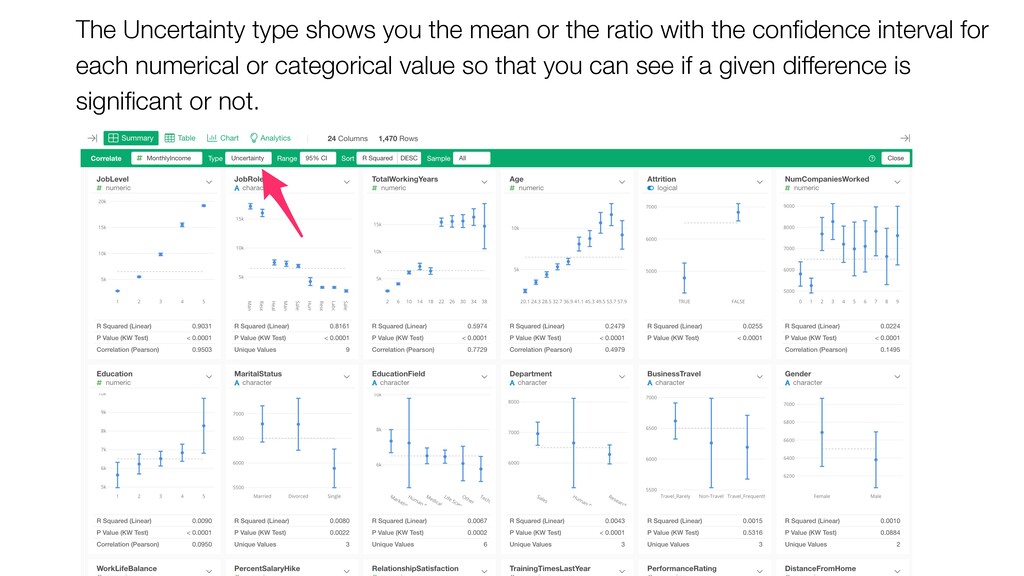
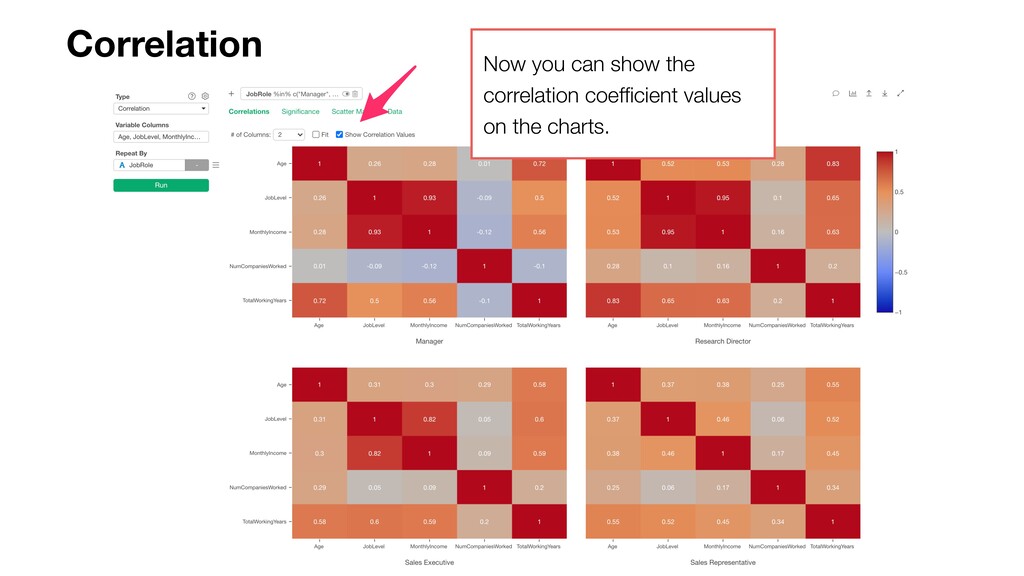
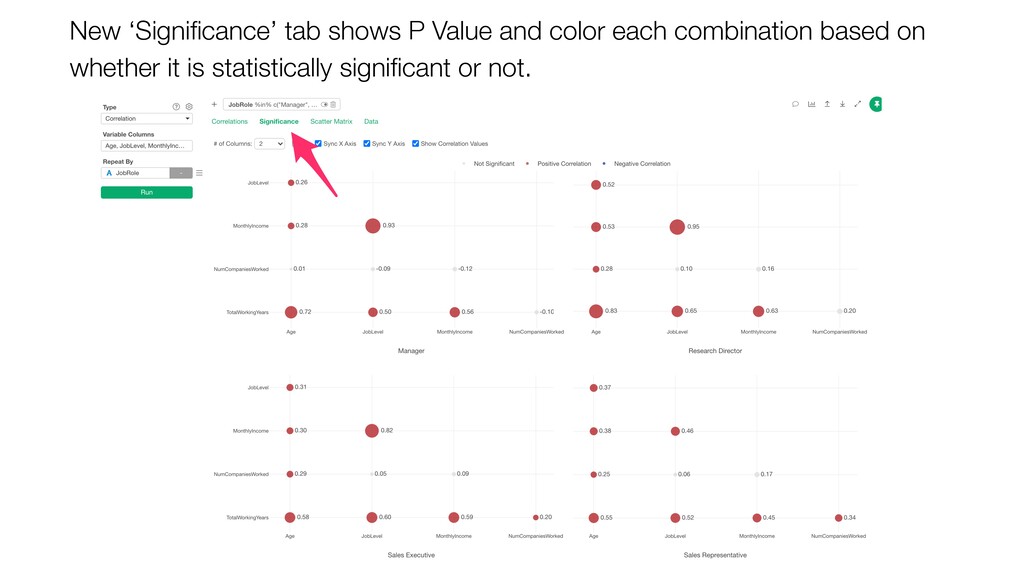
- Analytics: Updates for Correlation
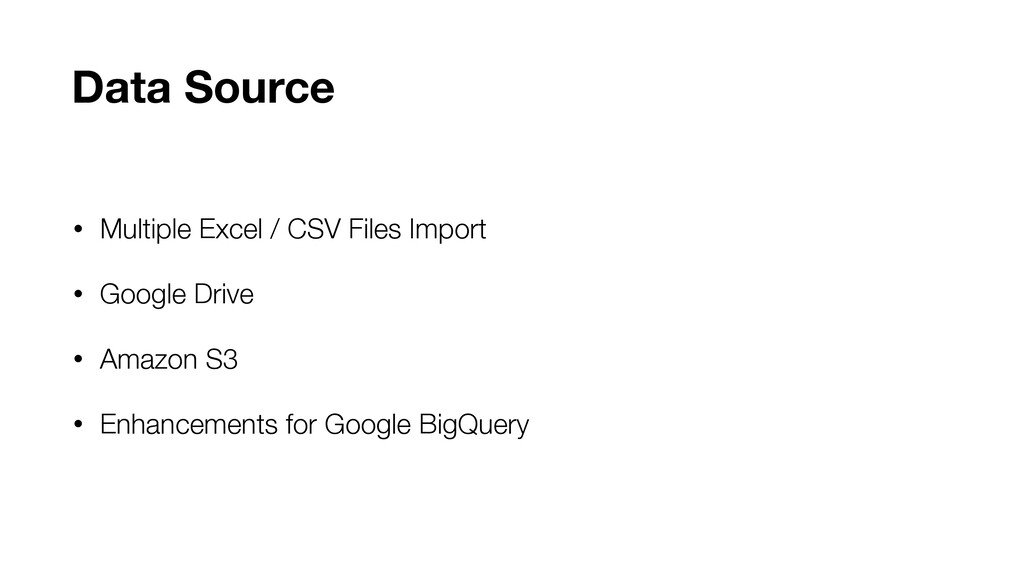
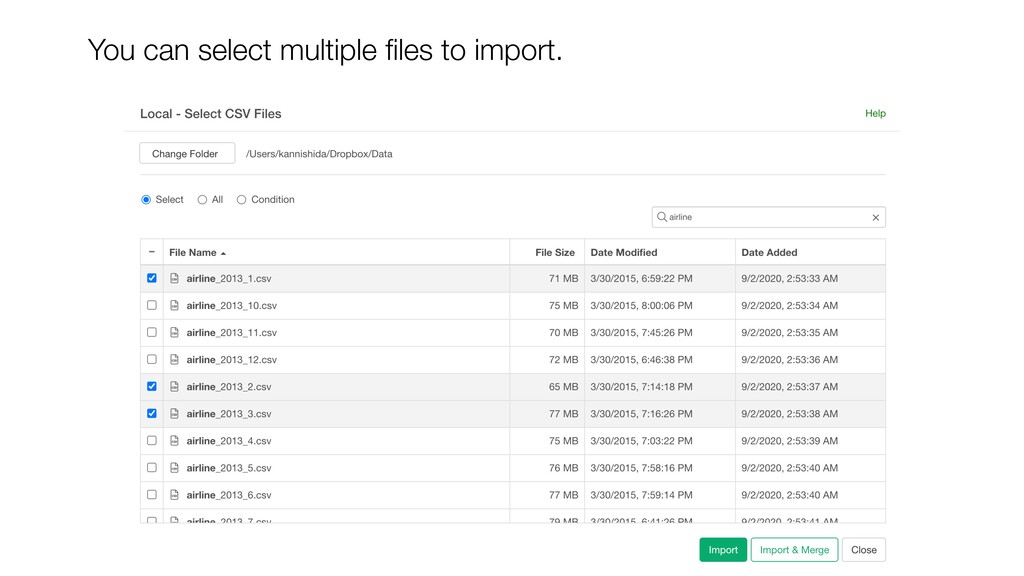
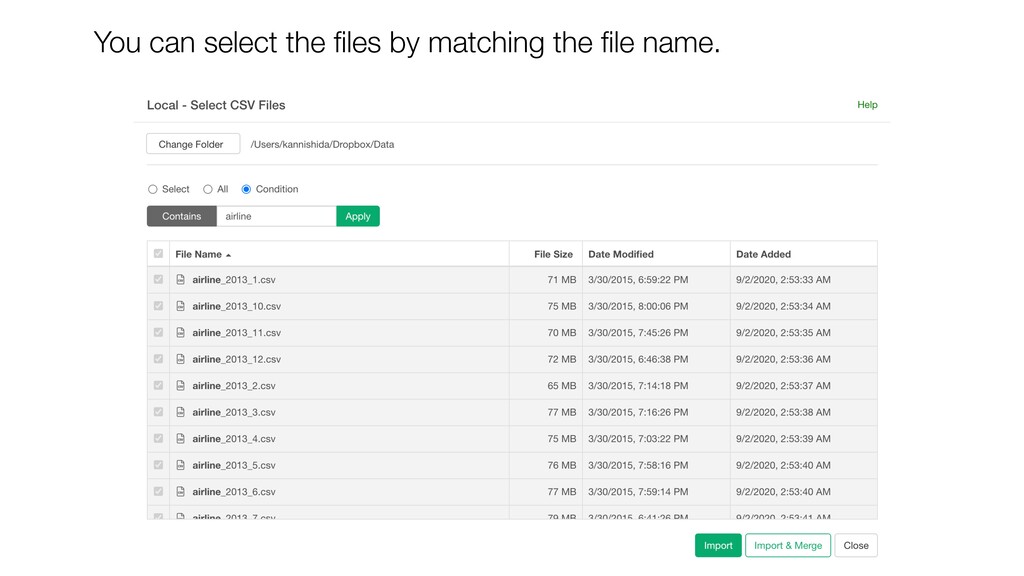
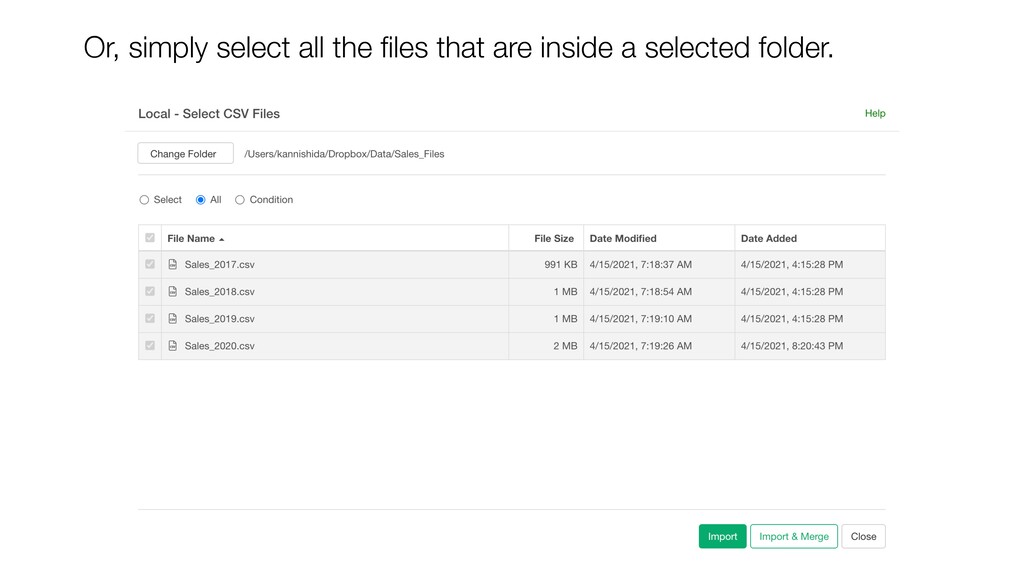
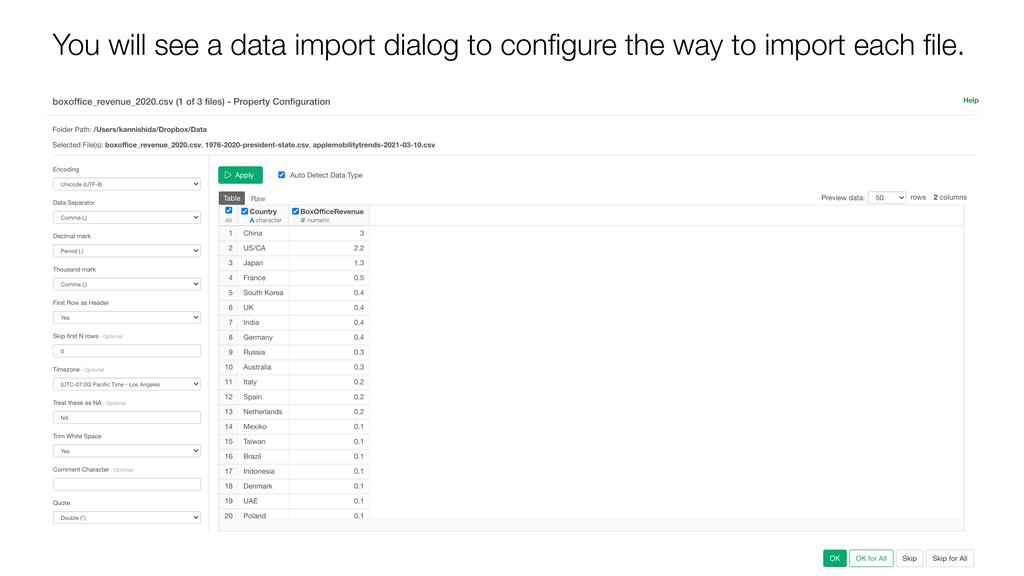
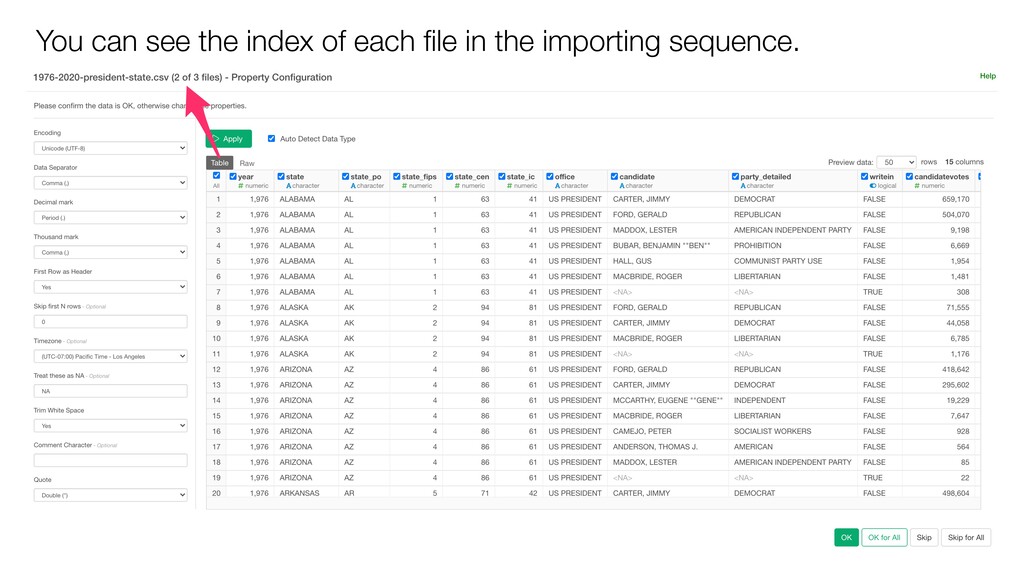
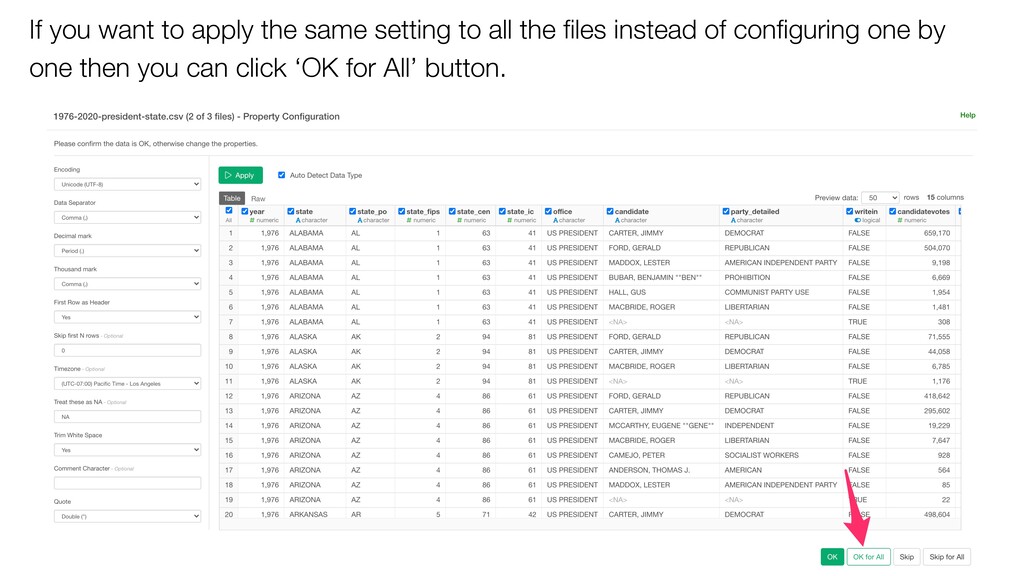
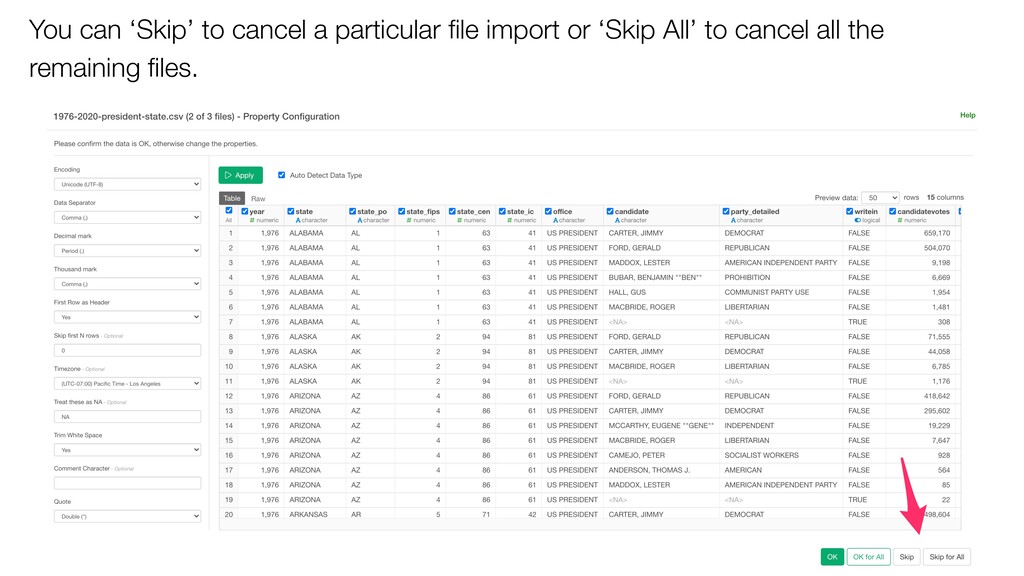
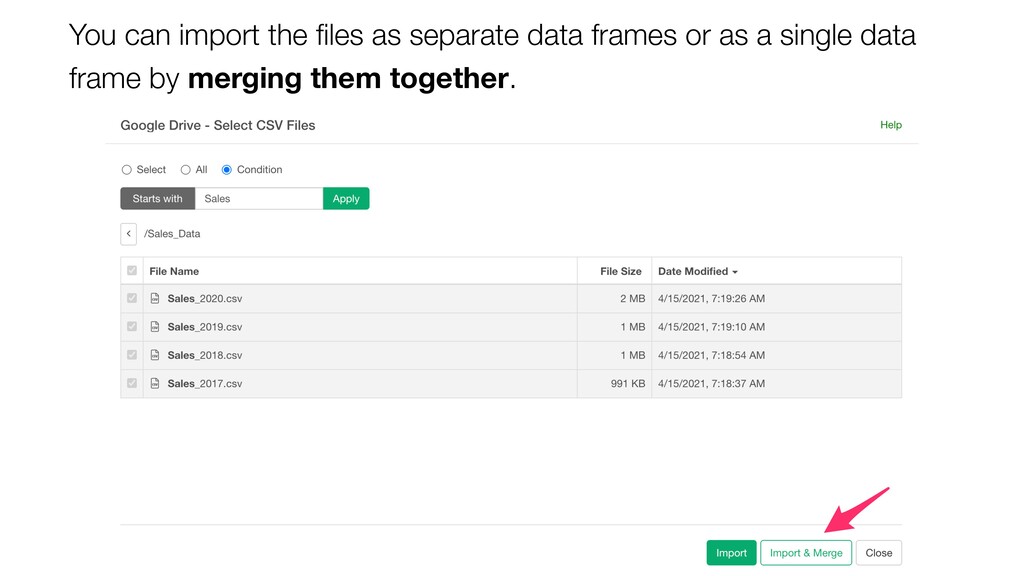
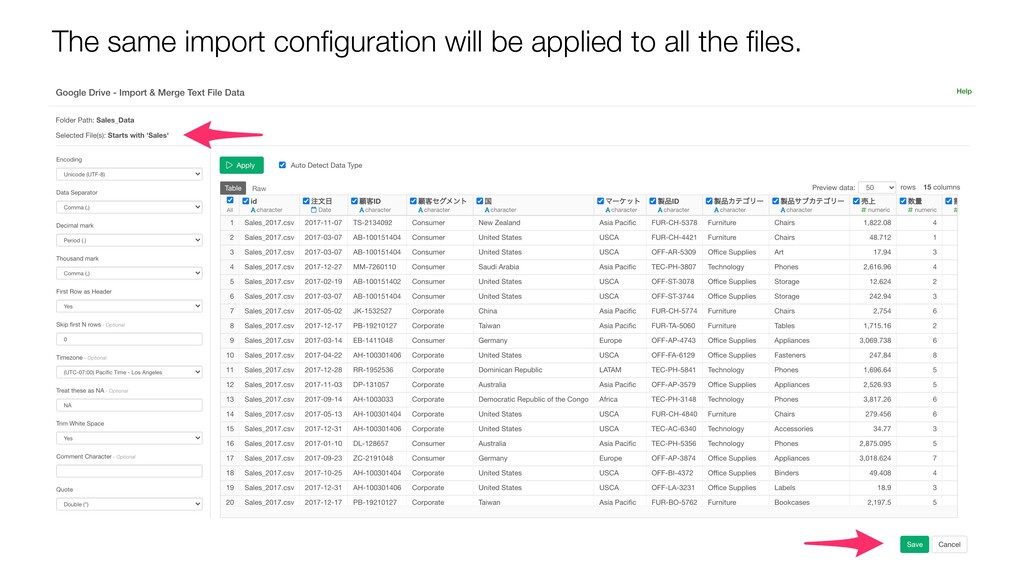
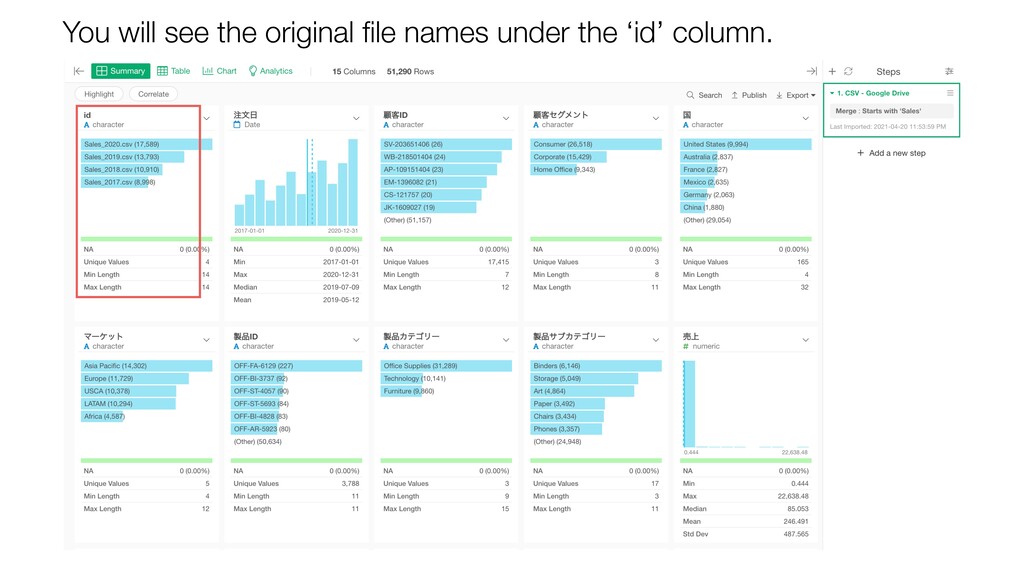
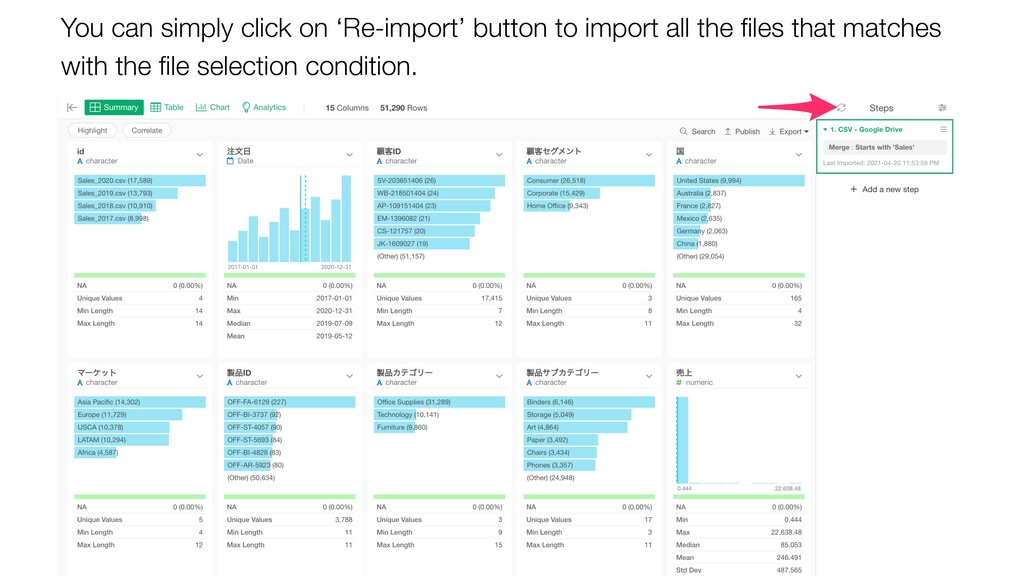
- Multiple Excel / CSV Files Import
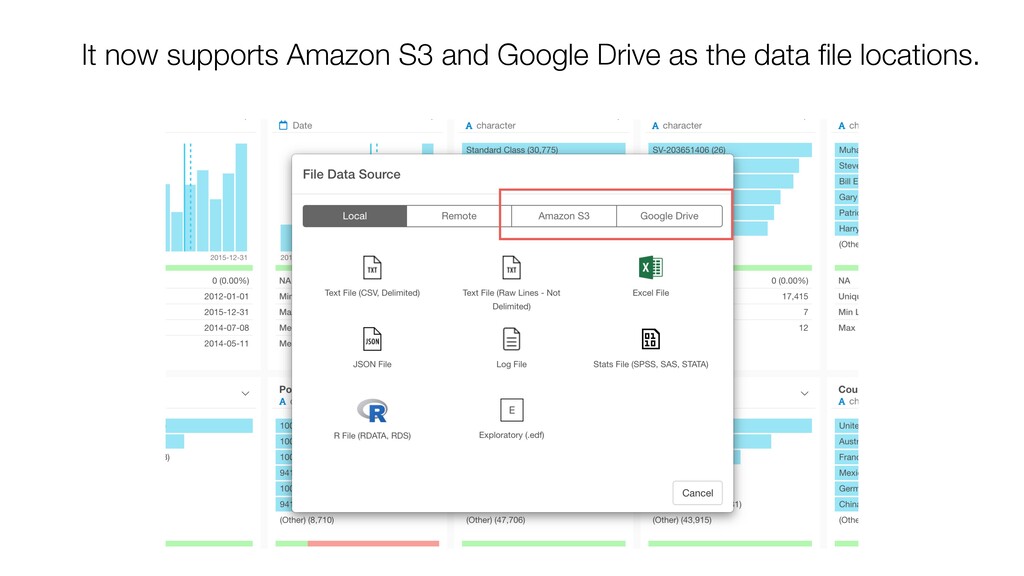
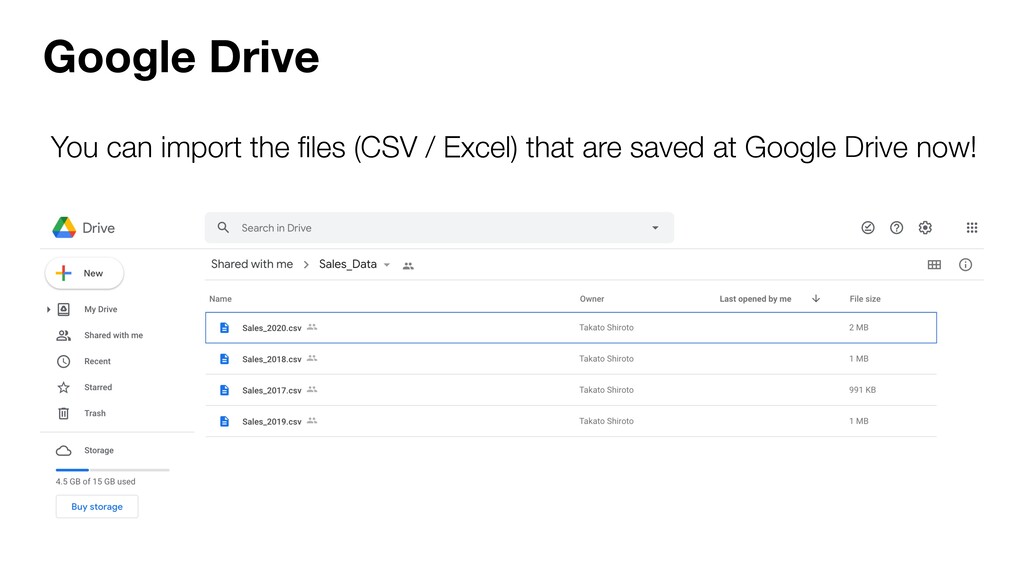
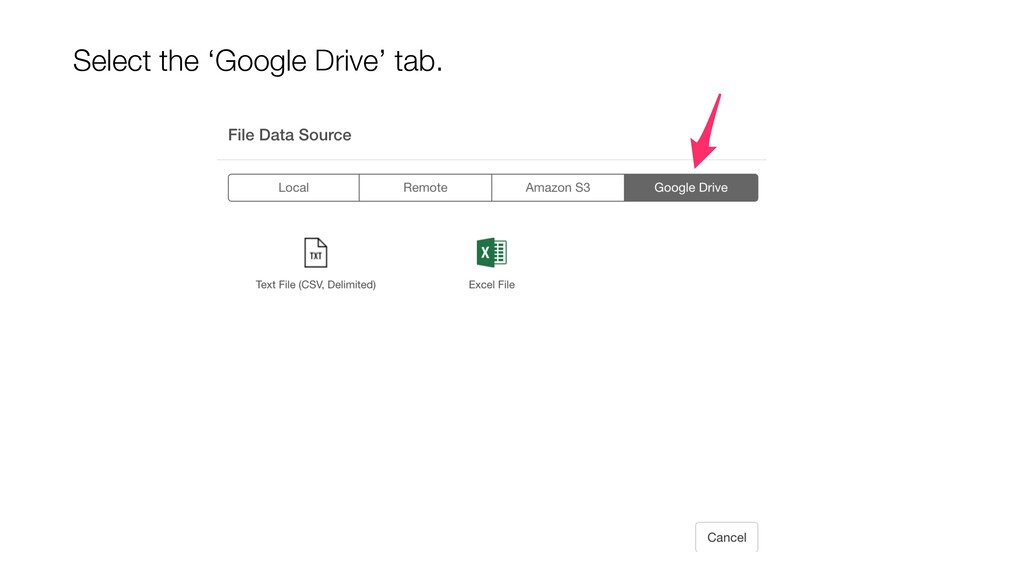
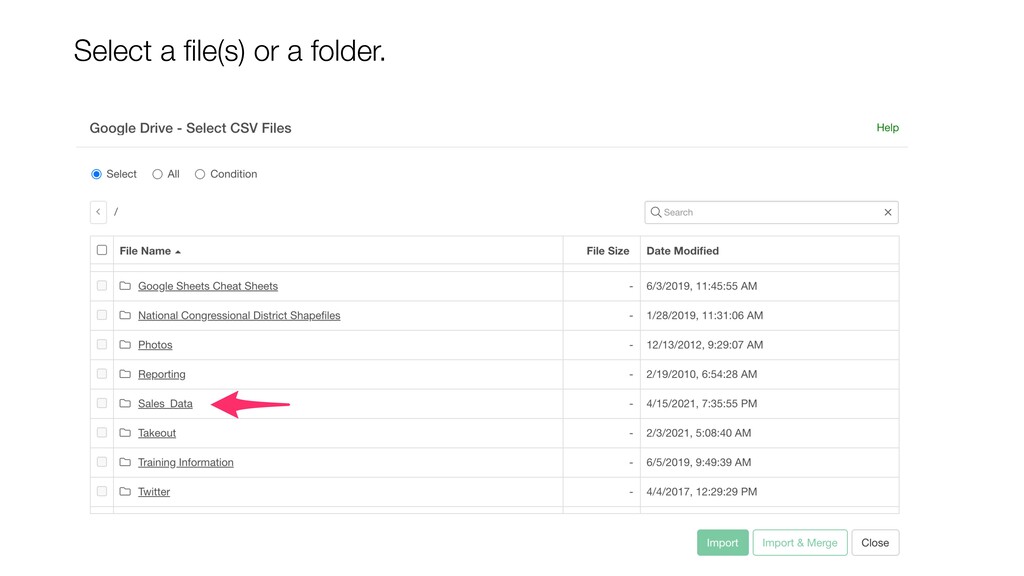
- Google Drive / S3 Support
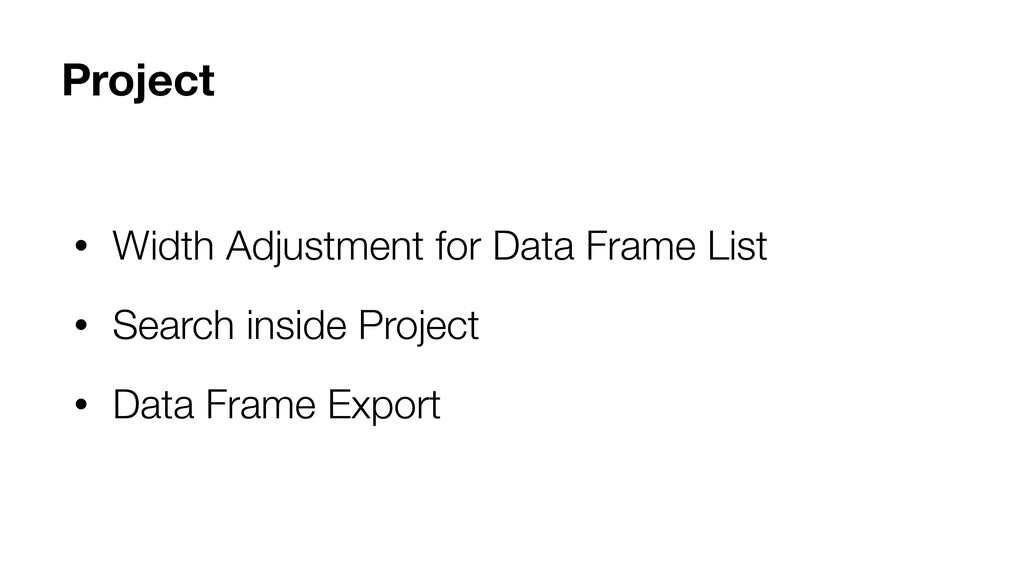
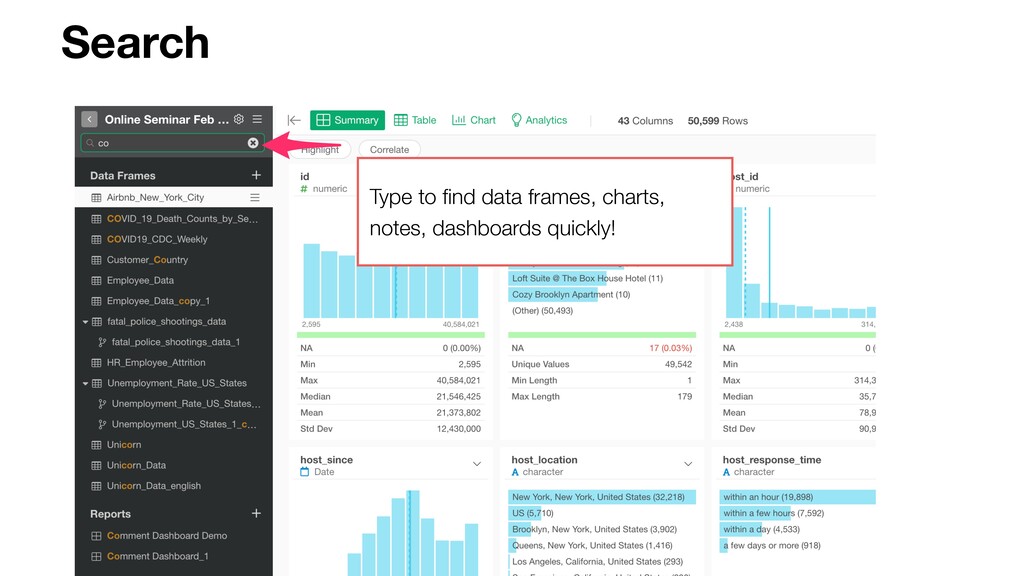
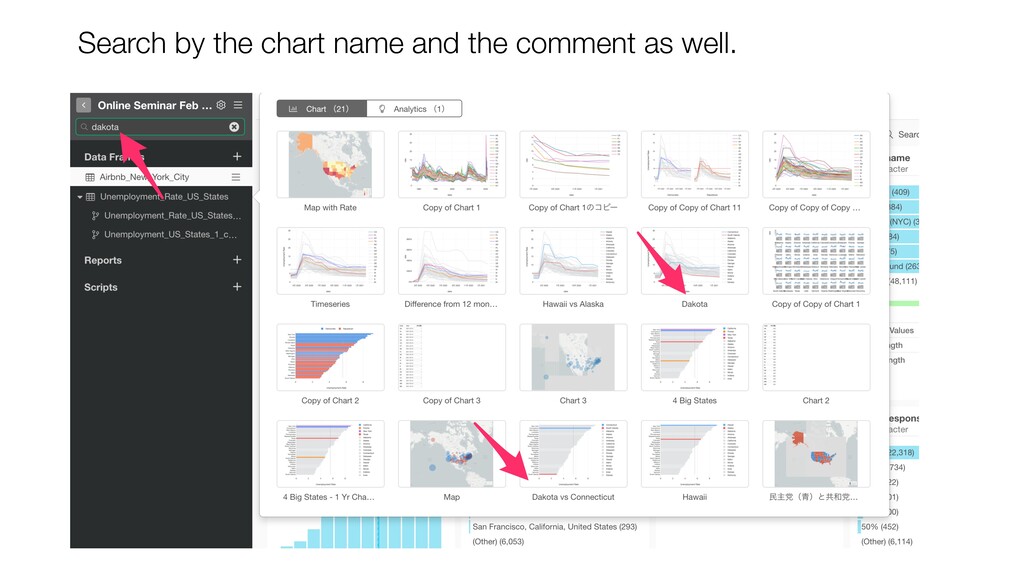
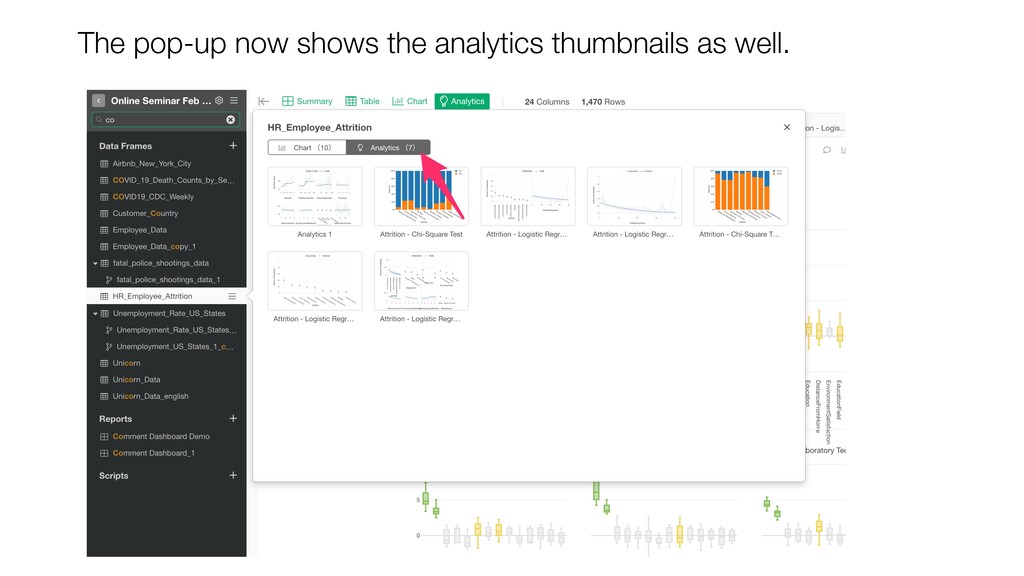
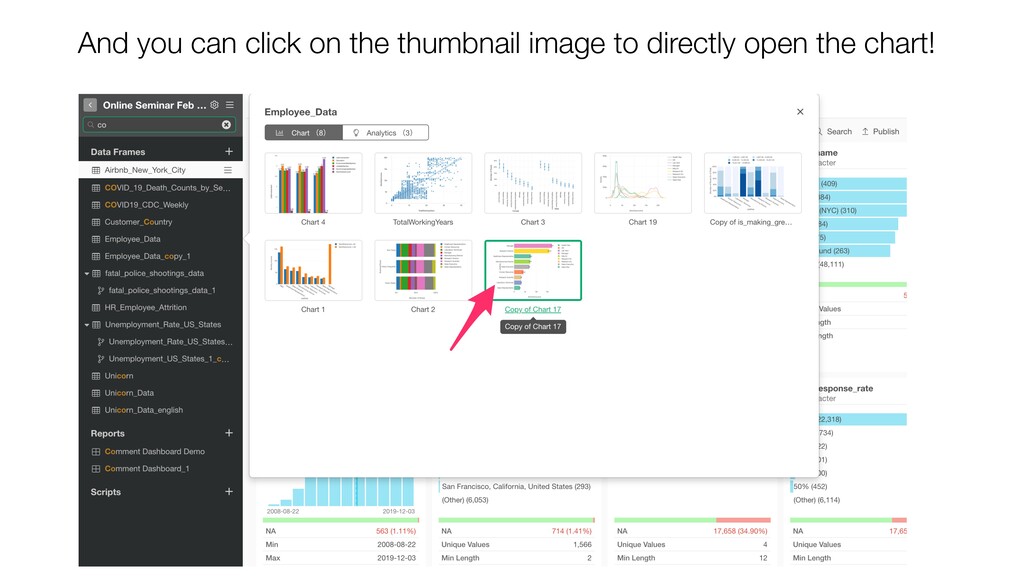
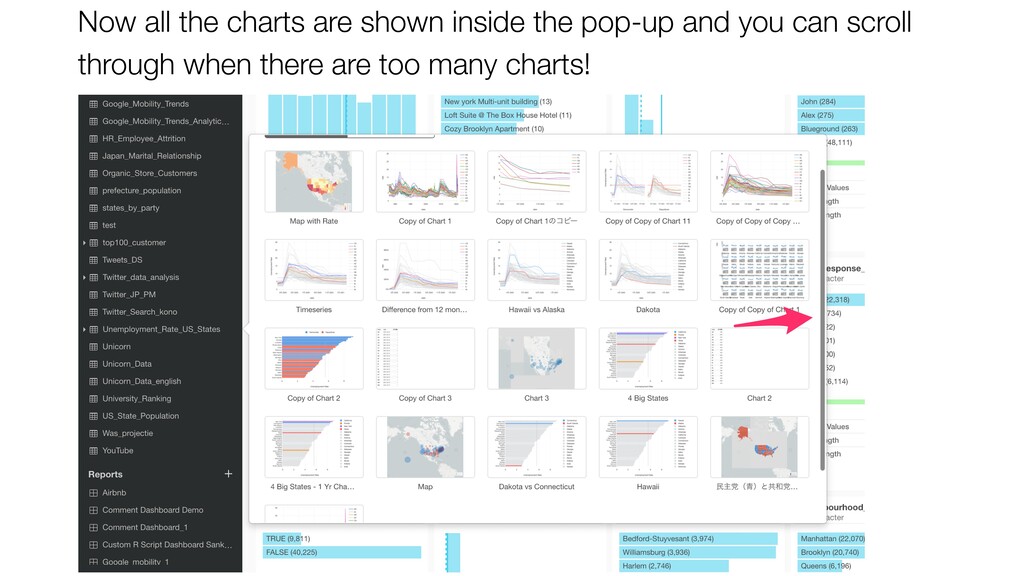
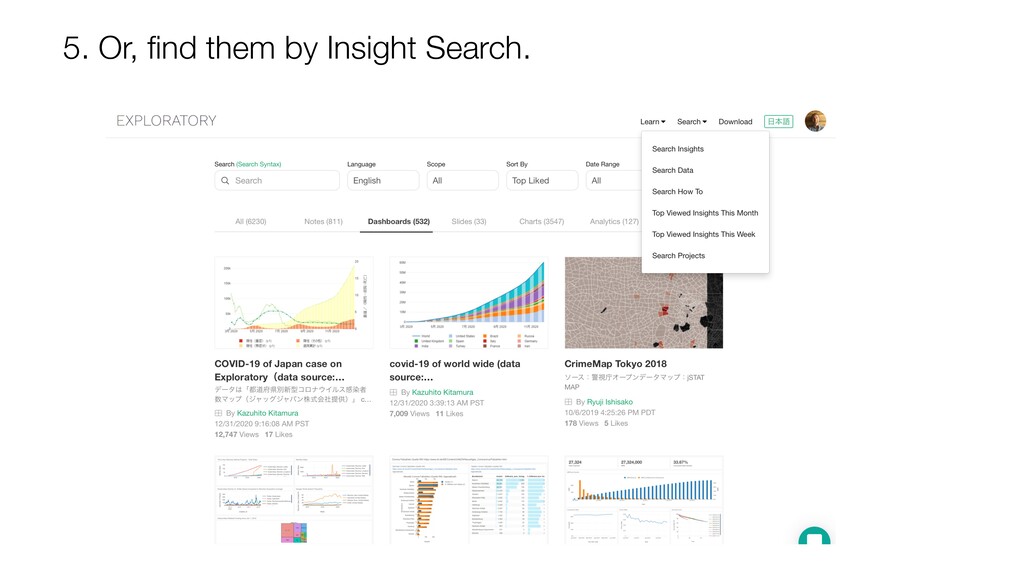
- Contents Search inside Project
![Information Email [email protected] Website https://exploratory.io Twitter @ExploratoryData Seminar https://exploratory.io/online-seminar](https://files.speakerdeck.com/presentations/0140d768165c44ceb41e8bacd96b0b11/slide_85.jpg)