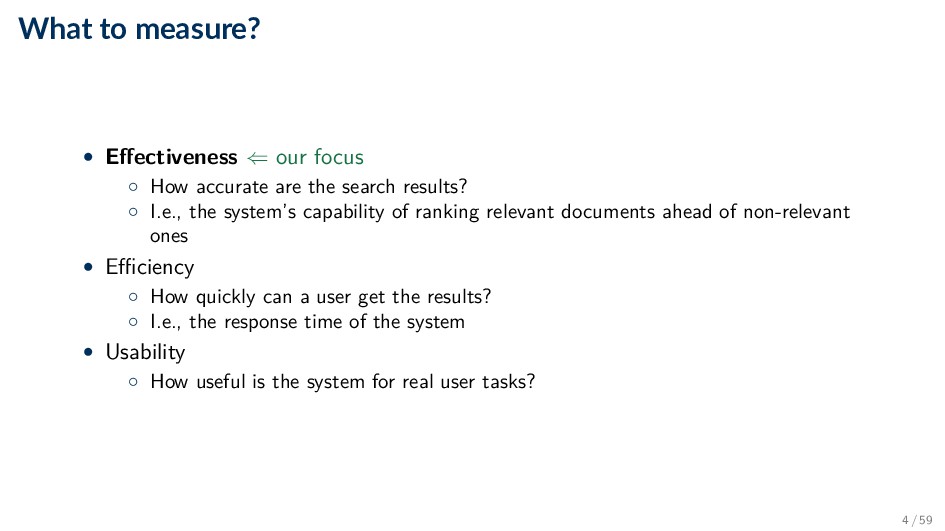
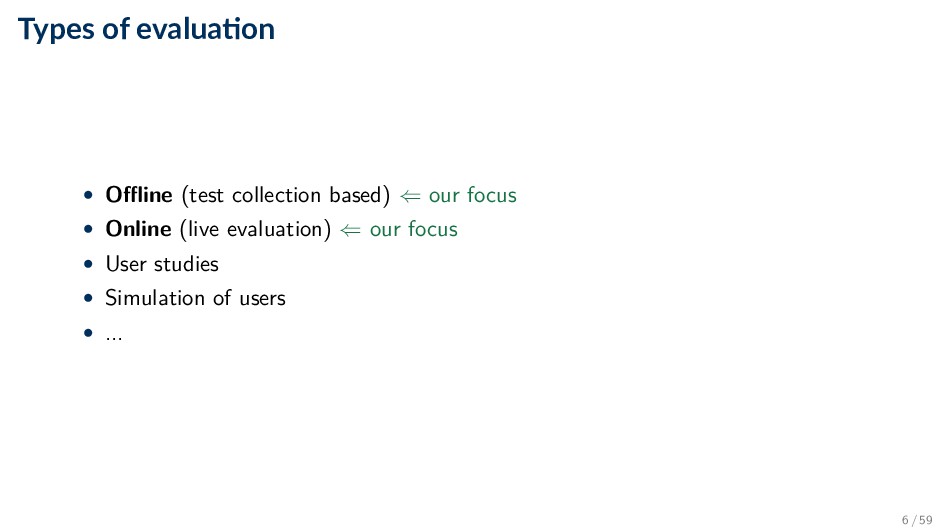
accurate are the search results? ◦ I.e., the system’s capability of ranking relevant documents ahead of non-relevant ones • Efficiency ◦ How quickly can a user get the results? ◦ I.e., the response time of the system • Usability ◦ How useful is the system for real user tasks? 4 / 59
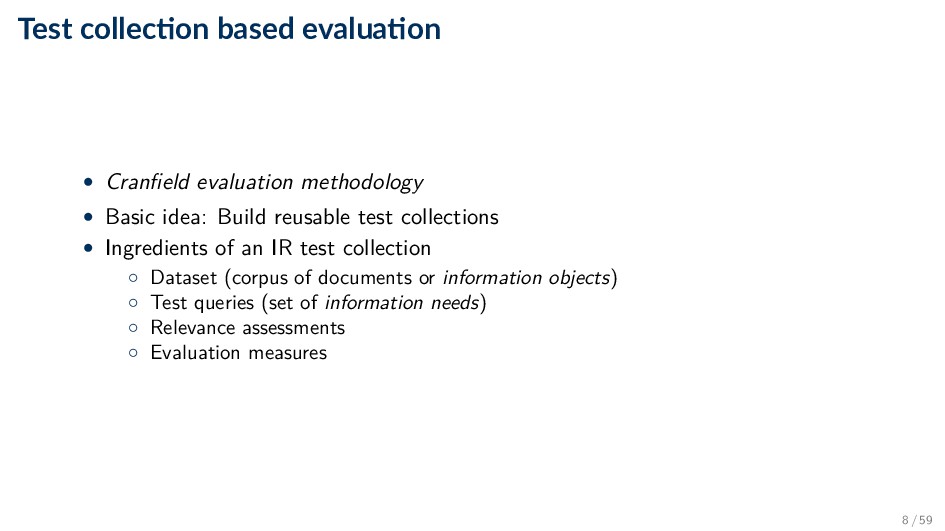
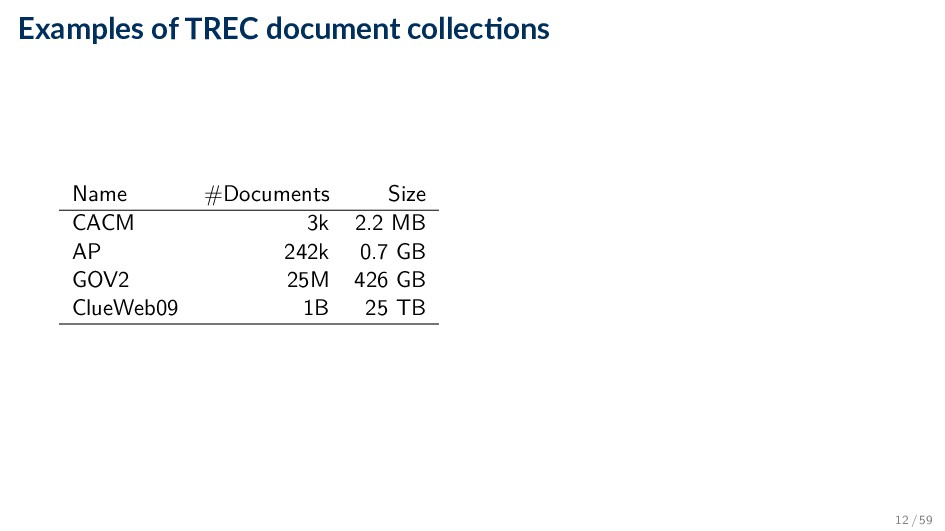
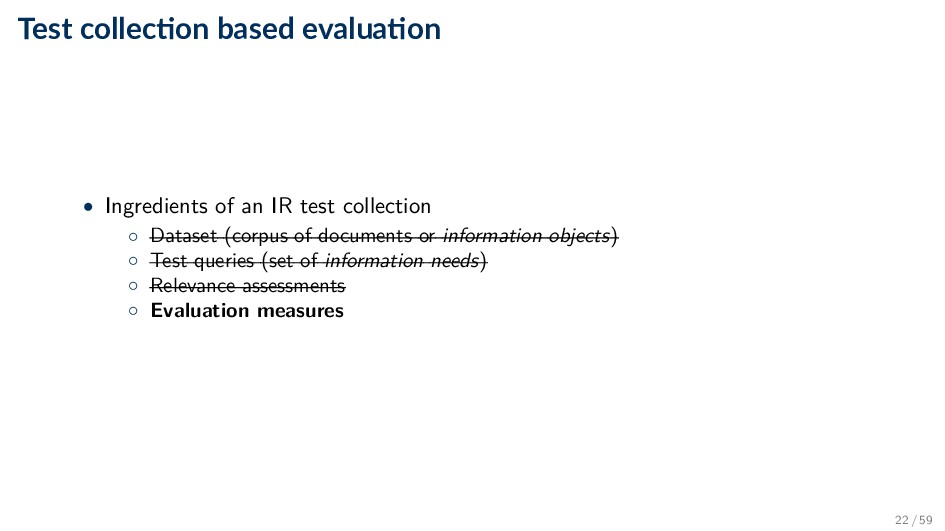
• Basic idea: Build reusable test collections • Ingredients of an IR test collection ◦ Dataset (corpus of documents or information objects) ◦ Test queries (set of information needs) ◦ Relevance assessments ◦ Evaluation measures 8 / 59
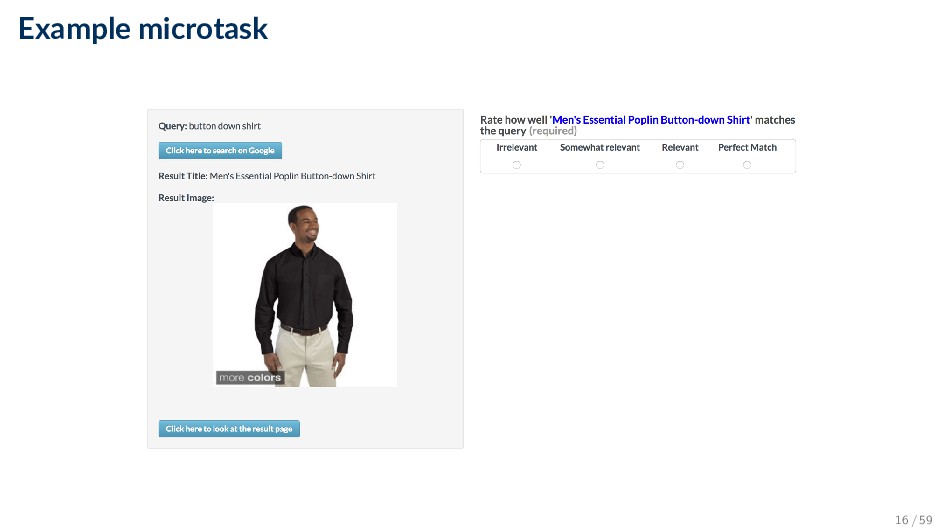
time-consuming process ◦ Who does it? ◦ What are the instructions? ◦ What is the level of agreement? • Two approaches ◦ Expert judges ◦ Crowdsourcing 10 / 59
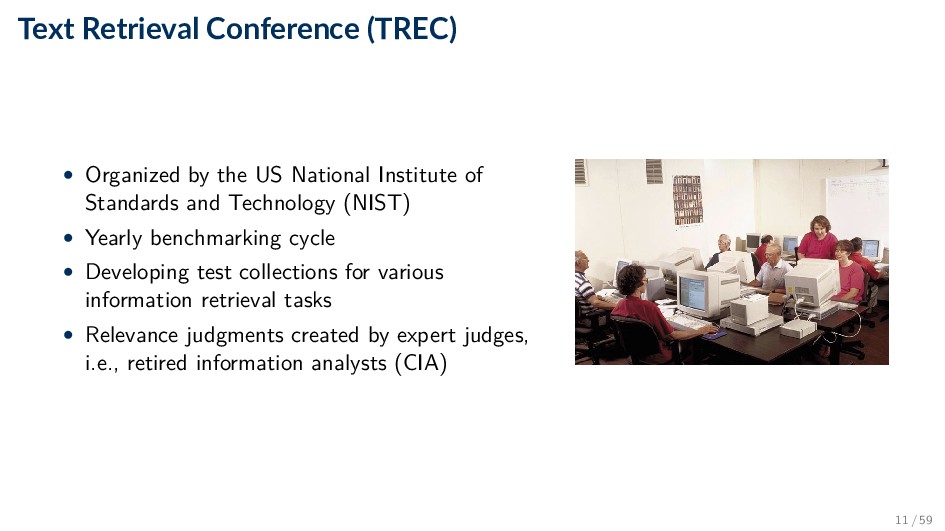
Institute of Standards and Technology (NIST) • Yearly benchmarking cycle • Developing test collections for various information retrieval tasks • Relevance judgments created by expert judges, i.e., retired information analysts (CIA) 11 / 59
pair is commonly assessed by a single person ◦ Agreement is good because of “narrative” • Crowdsourcing ◦ Assessments are more noisy ◦ Commonly, majority vote is taken • The number of labels collected for an item may be adjusted dynamically such that a majority decision is reached • Data is only as good as the guidelines! 18 / 59
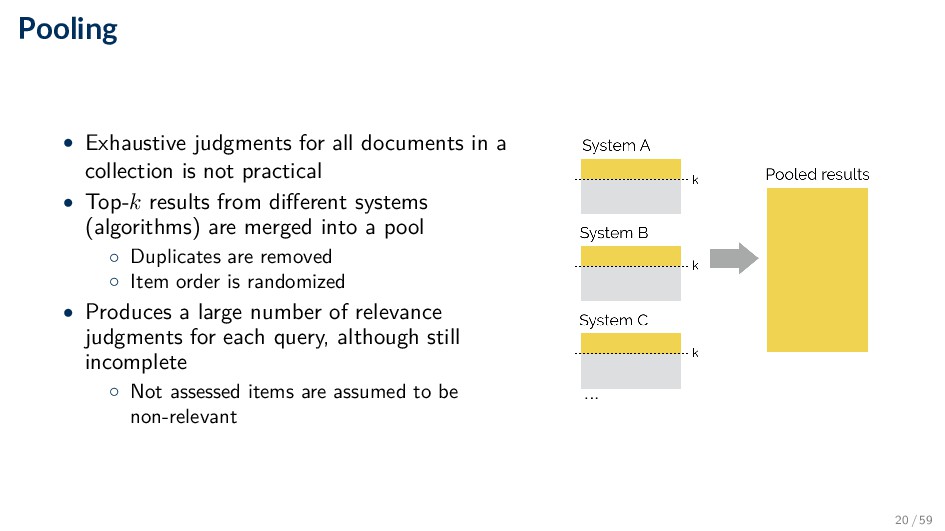
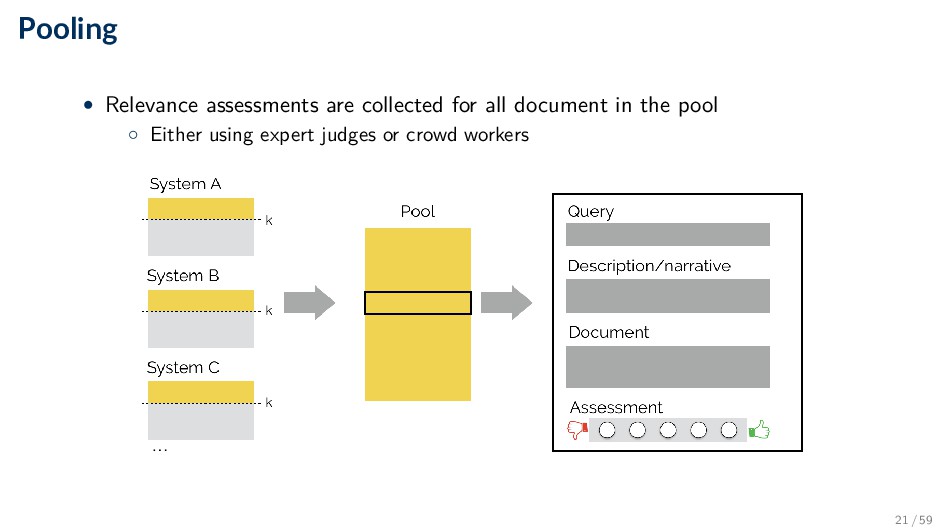
is not practical • Top-k results from different systems (algorithms) are merged into a pool ◦ Duplicates are removed ◦ Item order is randomized • Produces a large number of relevance judgments for each query, although still incomplete ◦ Not assessed items are assumed to be non-relevant 20 / 59
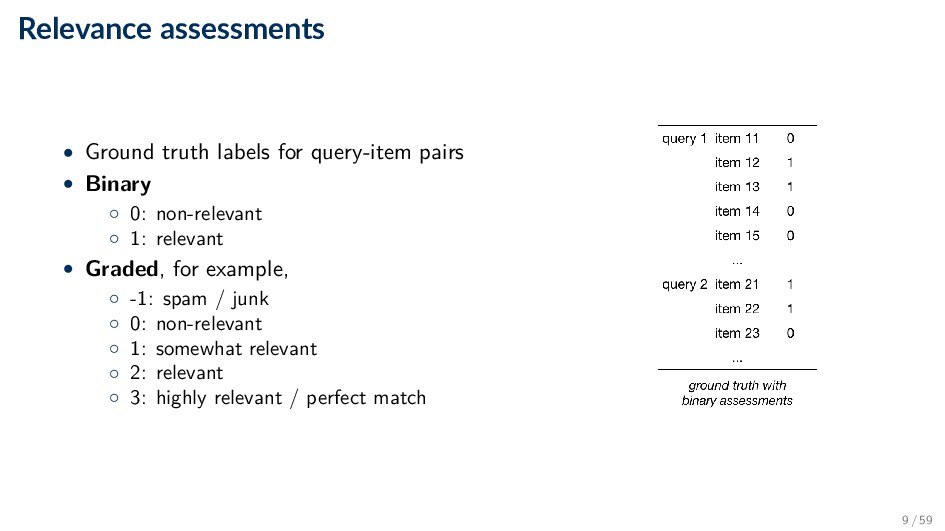
IR test collection ◦ Dataset (corpus of documents or information objects) ◦ Test queries (set of information needs) ◦ Relevance assessments ◦ Evaluation measures 22 / 59
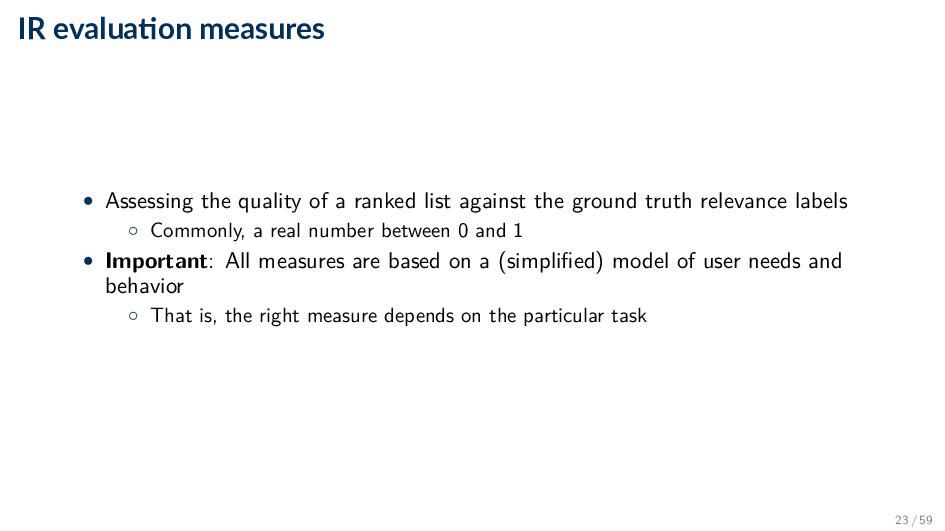
ranked list against the ground truth relevance labels ◦ Commonly, a real number between 0 and 1 • Important: All measures are based on a (simplified) model of user needs and behavior ◦ That is, the right measure depends on the particular task 23 / 59
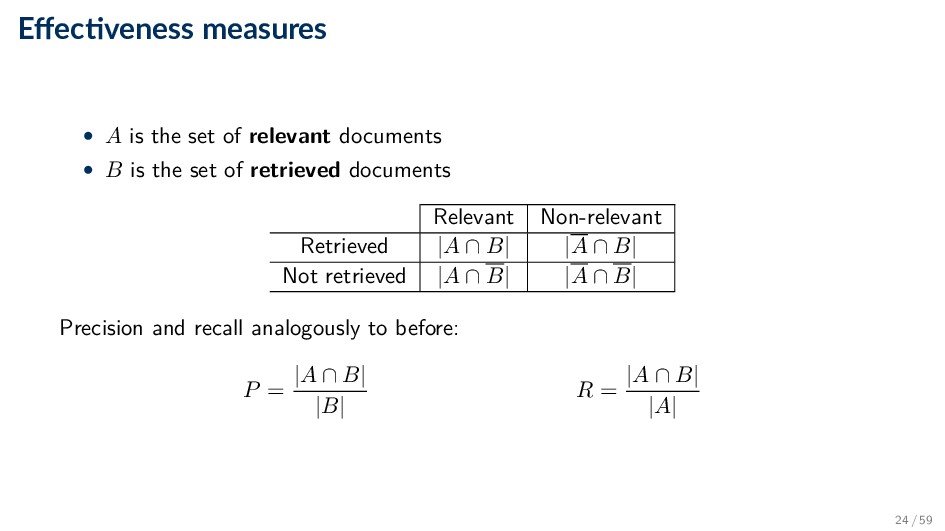
documents • B is the set of retrieved documents Relevant Non-relevant Retrieved |A ∩ B| |A ∩ B| Not retrieved |A ∩ B| |A ∩ B| Precision and recall analogously to before: P = |A ∩ B| |B| R = |A ∩ B| |A| 24 / 59
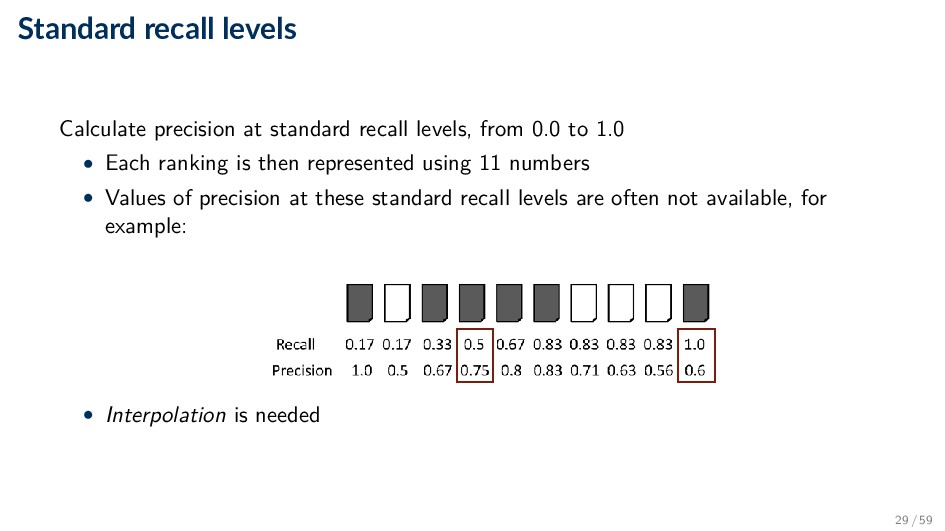
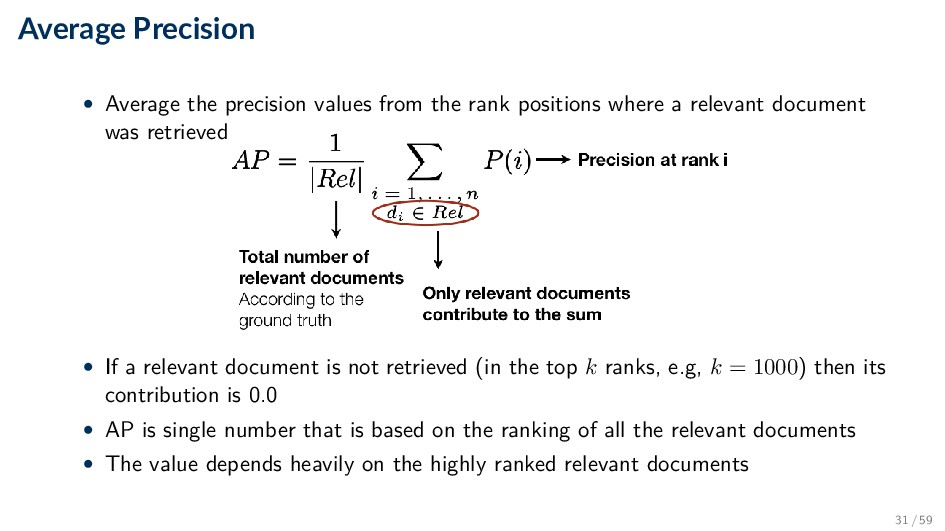
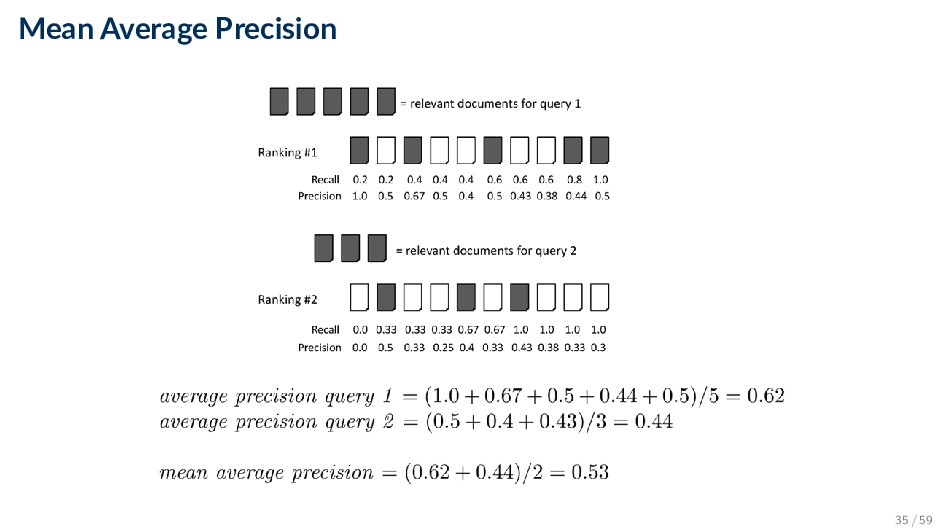
every rank position produces a long list of numbers (see previous slide) • Need to summarize the effectiveness of a ranking • Various alternatives ◦ Calculate recall and precision at fixed rank positions (P@k, R@k) ◦ Calculate precision at standard recall levels, from 0.0 to 1.0 (requires interpolation) ◦ Averaging the precision values from the rank positions where a relevant document was retrieved (AP) 27 / 59
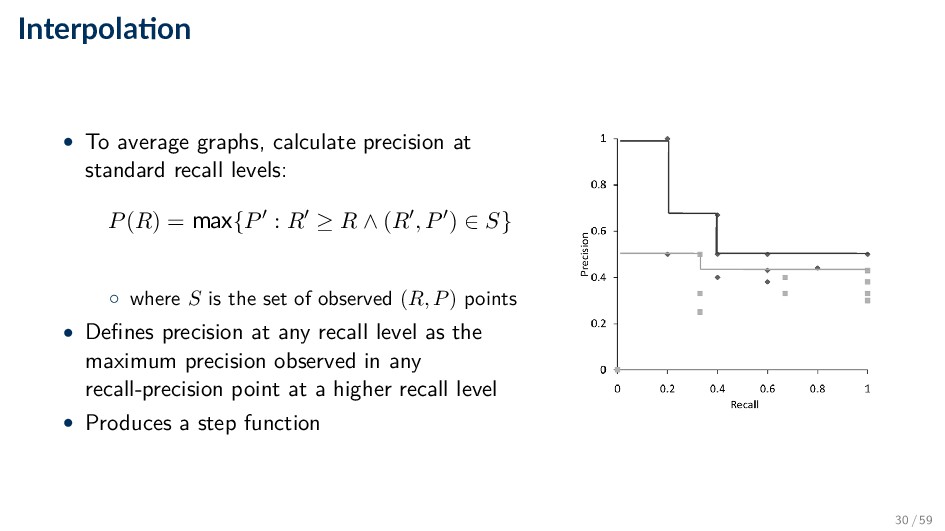
0.0 to 1.0 • Each ranking is then represented using 11 numbers • Values of precision at these standard recall levels are often not available, for example: • Interpolation is needed 29 / 59
recall levels: P(R) = max{P : R ≥ R ∧ (R , P ) ∈ S} ◦ where S is the set of observed (R, P) points • Defines precision at any recall level as the maximum precision observed in any recall-precision point at a higher recall level • Produces a step function 30 / 59
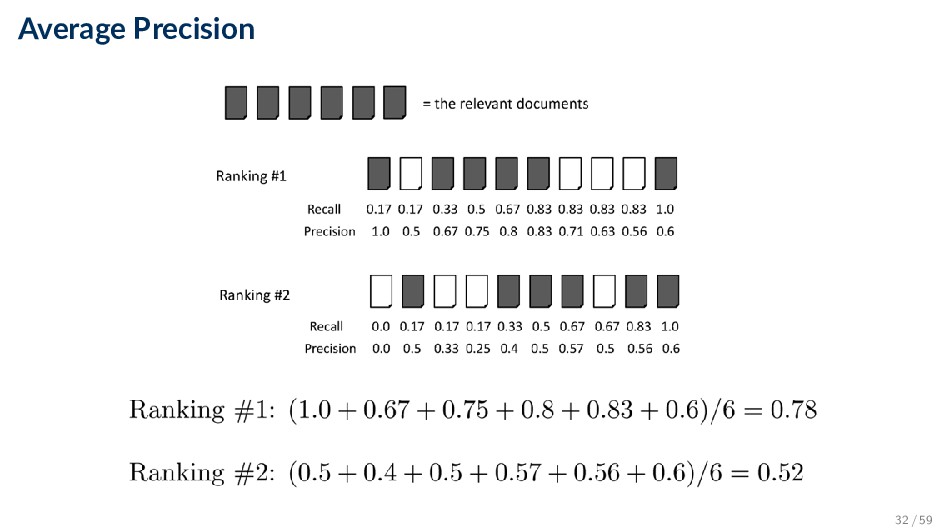
positions where a relevant document was retrieved • If a relevant document is not retrieved (in the top k ranks, e.g, k = 1000) then its contribution is 0.0 • AP is single number that is based on the ranking of all the relevant documents • The value depends heavily on the highly ranked relevant documents 31 / 59
by averaging Average Precision • Very succinct summary • Most commonly used measure in research papers • Assumes user is interested in finding many relevant documents for each query • Requires many relevance judgments 34 / 59
only the top part of the ranked result list to find relevant documents • Some search tasks have only one relevant document ◦ E.g., navigational search, question answering • Recall in those cases is not appropriate ◦ Instead need to measure how well the search engine does at retrieving relevant documents at very high ranks 36 / 59
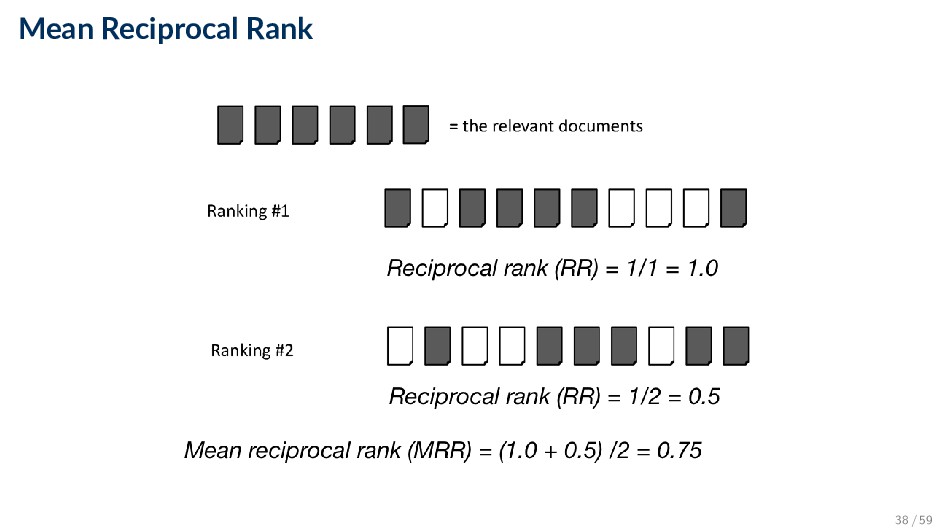
◦ k is typically 5, 10, 20 ◦ Easy to compute, average, understand ◦ Not sensitive to rank positions less than k • Reciprocal Rank (RR) ◦ Reciprocal of the rank at which the first relevant document is retrieved ◦ Mean Reciprocal Rank (MRR) is the average of the reciprocal ranks over a set of queries ◦ Very sensitive to rank position 37 / 59
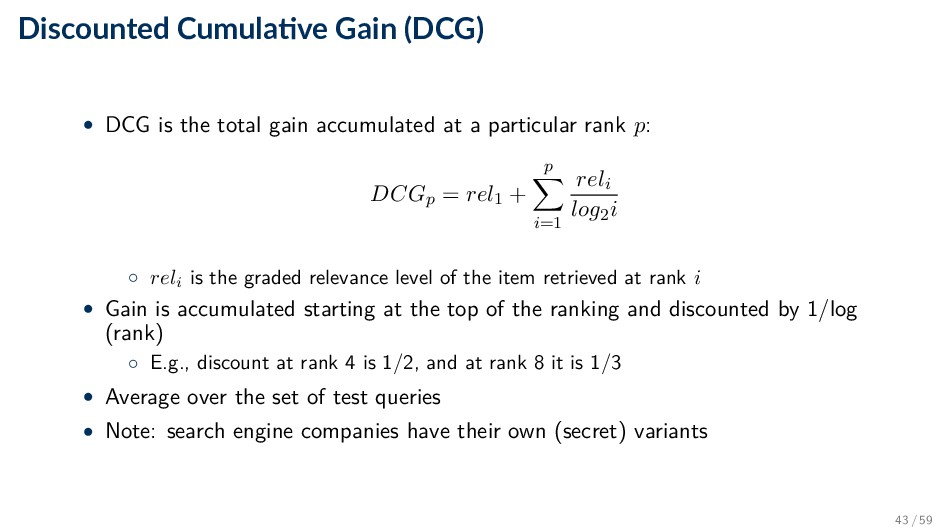
search and related tasks • Two assumptions: ◦ Highly relevant documents are more useful than marginally relevant document ◦ The lower the ranked position of a relevant document, the less useful it is for the user, since it is less likely to be examined 42 / 59
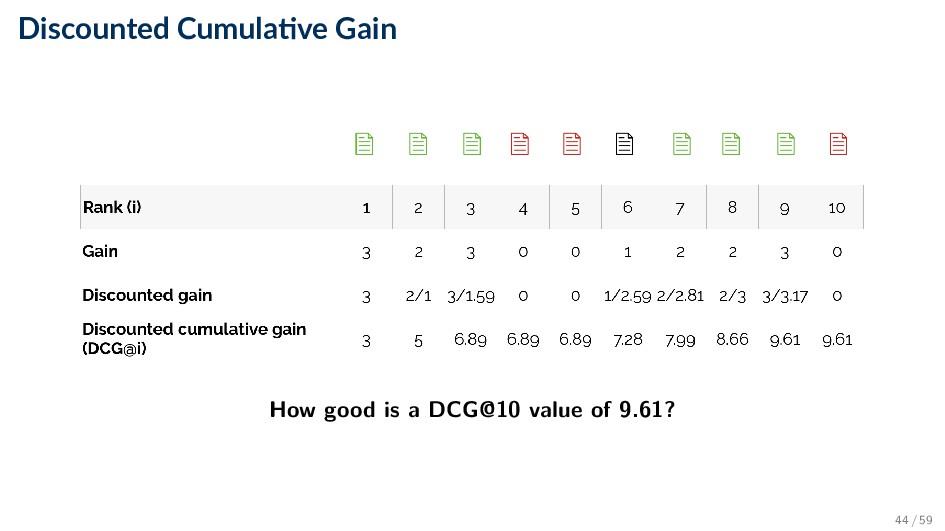
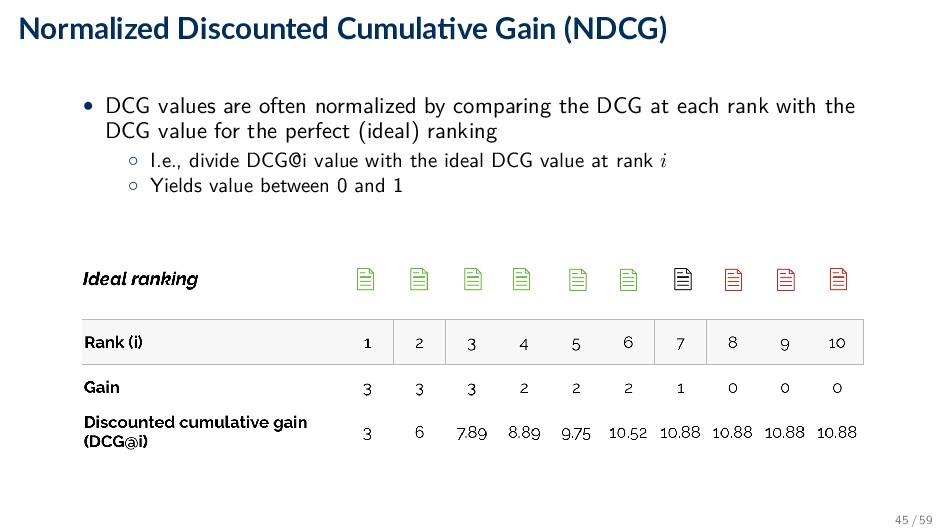
gain accumulated at a particular rank p: DCGp = rel1 + p i=1 reli log2i ◦ reli is the graded relevance level of the item retrieved at rank i • Gain is accumulated starting at the top of the ranking and discounted by 1/log (rank) ◦ E.g., discount at rank 4 is 1/2, and at rank 8 it is 1/3 • Average over the set of test queries • Note: search engine companies have their own (secret) variants 43 / 59
often normalized by comparing the DCG at each rank with the DCG value for the perfect (ideal) ranking ◦ I.e., divide DCG@i value with the ideal DCG value at rank i ◦ Yields value between 0 and 1 45 / 59
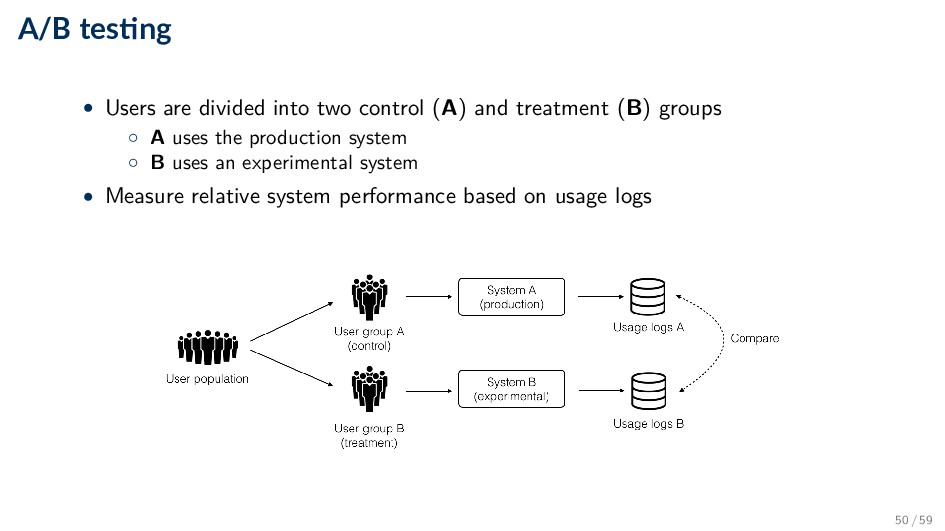
with a live retrieval system (“living lab”) when just using it • Observe implicit behavior ◦ Clicks, skips, saves, forwards, bookmarks, likes, etc. • Try to infer differences in behavior from different flavors of the live system ◦ A/B testing, interleaving 49 / 59
(A) and treatment (B) groups ◦ A uses the production system ◦ B uses an experimental system • Measure relative system performance based on usage logs 50 / 59
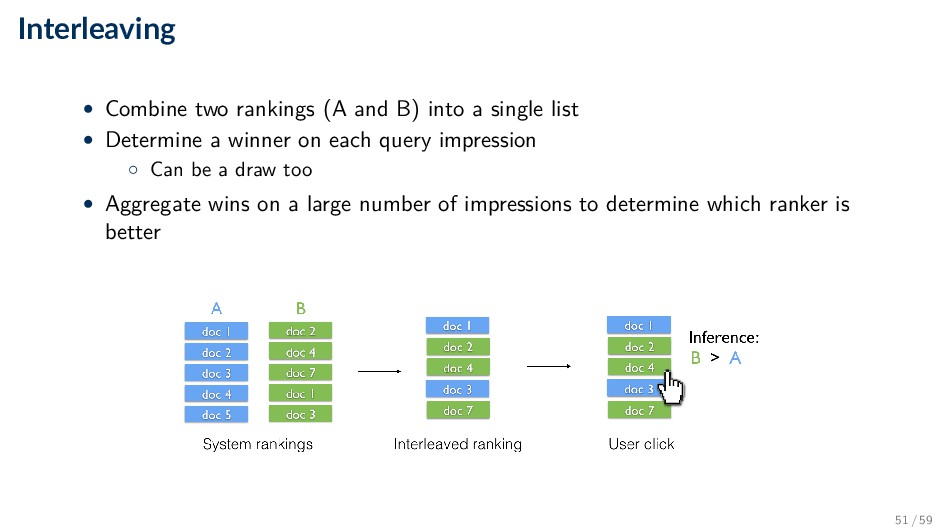
single list • Determine a winner on each query impression ◦ Can be a draw too • Aggregate wins on a large number of impressions to determine which ranker is better 51 / 59
subject design ◦ Can be used for evaluating any feature (new ranking algorithms, new features, UI design changes, etc.) • Interleaving ◦ Within subject design ◦ Reduces variance (same users/queries for both A and B) ◦ Needs 1 to 2 orders of magnitude less data • ∼100K queries for interleaving in a mature web search engine ( 1M for A/B testing) ◦ Limited to evaluating ranked lists 52 / 59
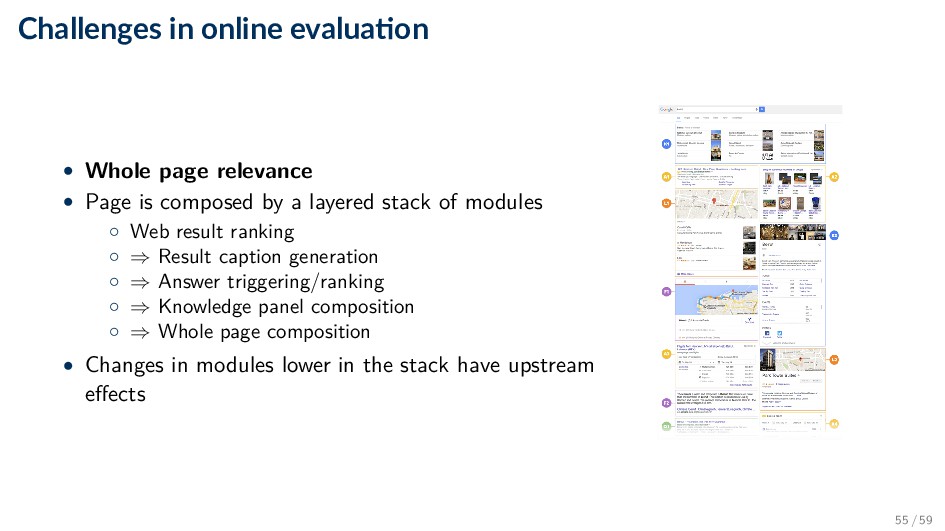
Page is composed by a layered stack of modules ◦ Web result ranking ◦ ⇒ Result caption generation ◦ ⇒ Answer triggering/ranking ◦ ⇒ Knowledge panel composition ◦ ⇒ Whole page composition • Changes in modules lower in the stack have upstream effects 55 / 59
No need for expensive dataset creation ◦ Perfectly realistic setting: (most) users are not even aware that they are guinea pigs ◦ Scales very well: can include millions of users • Disadvantages ◦ Requires a service with lots of users ◦ Can be highly nontrivial how to interpret implicit feedback signals ◦ Experiments are difficult to repeat 56 / 59
tell you what is relevant Observable user behavior can tell you what is relevant Quality Data is only as good as the guidelines Real user data, real and representa- tive information needs Realisticity Simplified scenario, cannot go beyond a certain level of complexity Perfectly realistic setting (users are not aware that they are guinea pigs) Assessment cost Expensive Cheap Scalability Doesn’t scale Scales very well Repeatability Repeatable Not repeatable Throughput High Low Risk None High 57 / 59
![Informa on Retrieval (Part II) [DAT640] Informa on Retrieval and](https://files.speakerdeck.com/presentations/6983bc6d9ade46a4bd86b14e0d0545f9/slide_0.jpg)