Upgrade to Pro — share decks privately, control downloads, hide ads and more …

How to Cope When Kubernetes Misbehaves

How to Cope When Kubernetes Misbehaves

A talk by Komodor's co-founding CTO Itiel Shwartz on DevOpsCon London 2022.

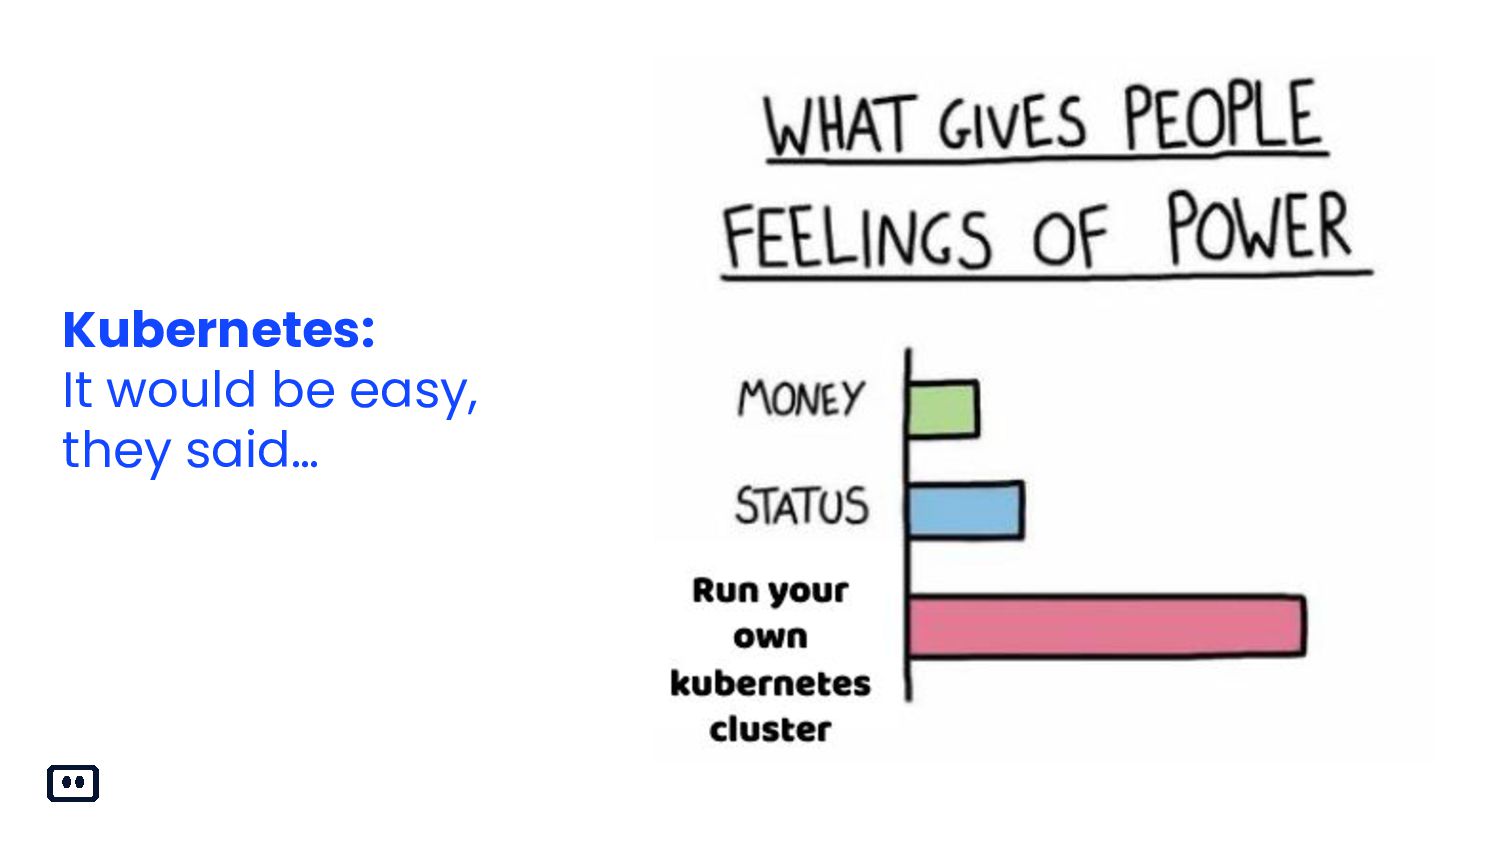
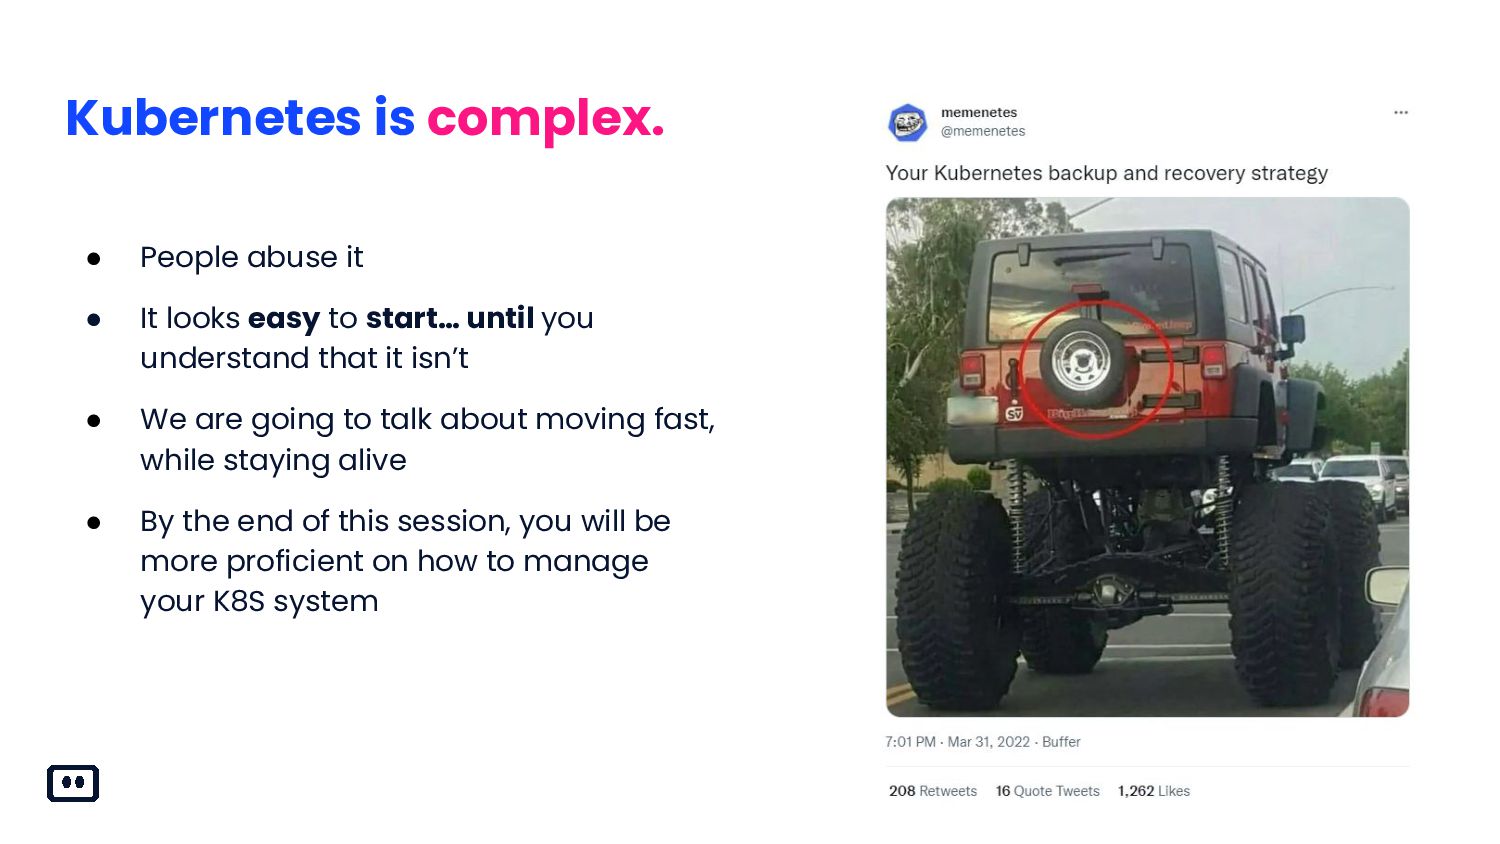
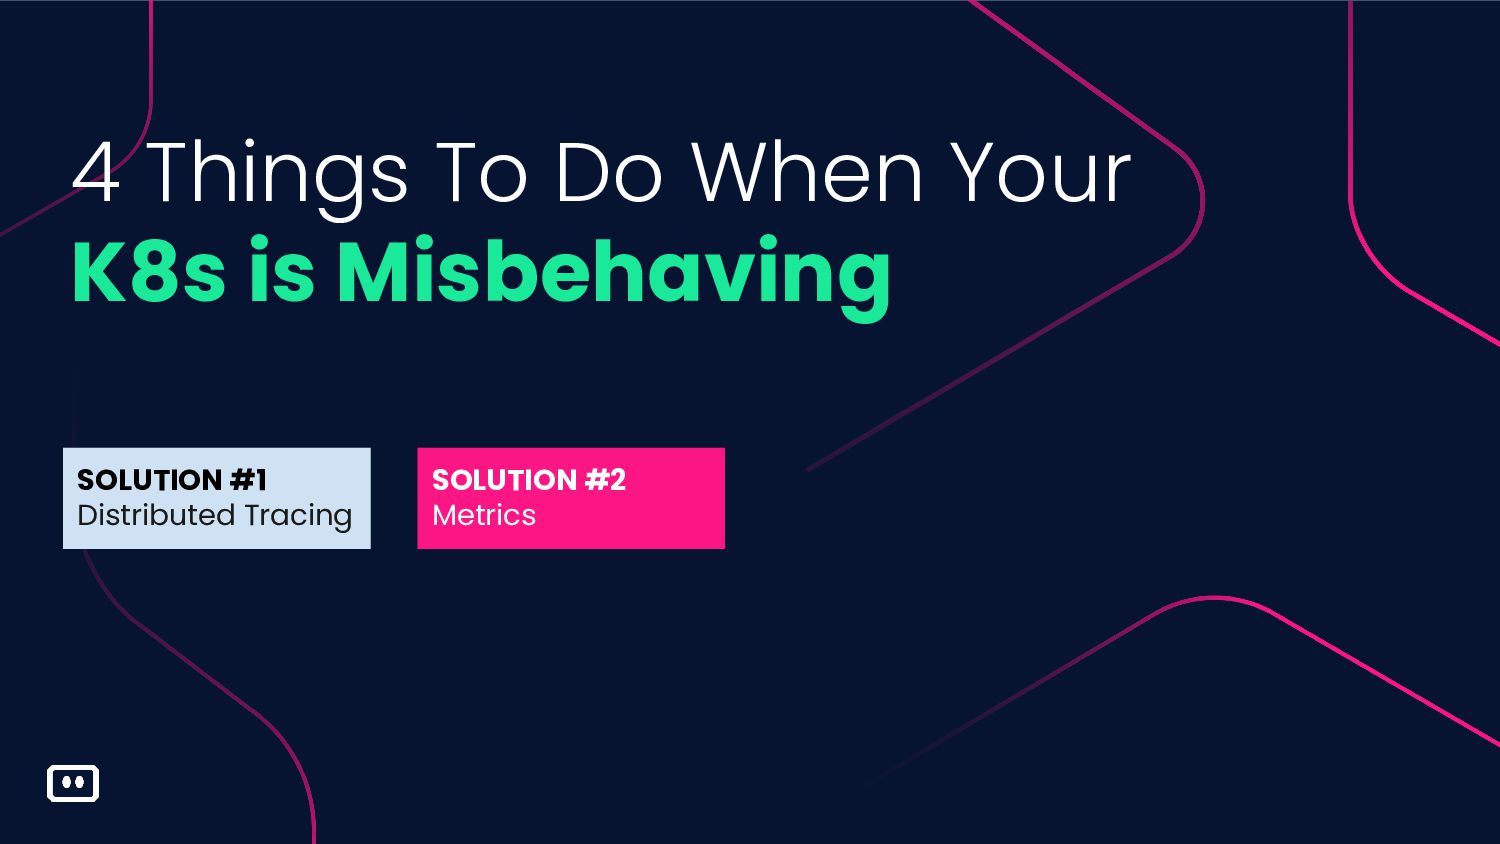
Kubernetes has given us the power to move extremely fast. But without any safeguards in place, we more often than not find ourselves staring at it blankly trying to figure out what the hell went wrong (sounds familiar, right?).
In this session, we are going to do a live demonstration of common Kubernetes failure scenarios, both app and infra related, and may the Gods of the demo be kind to us.

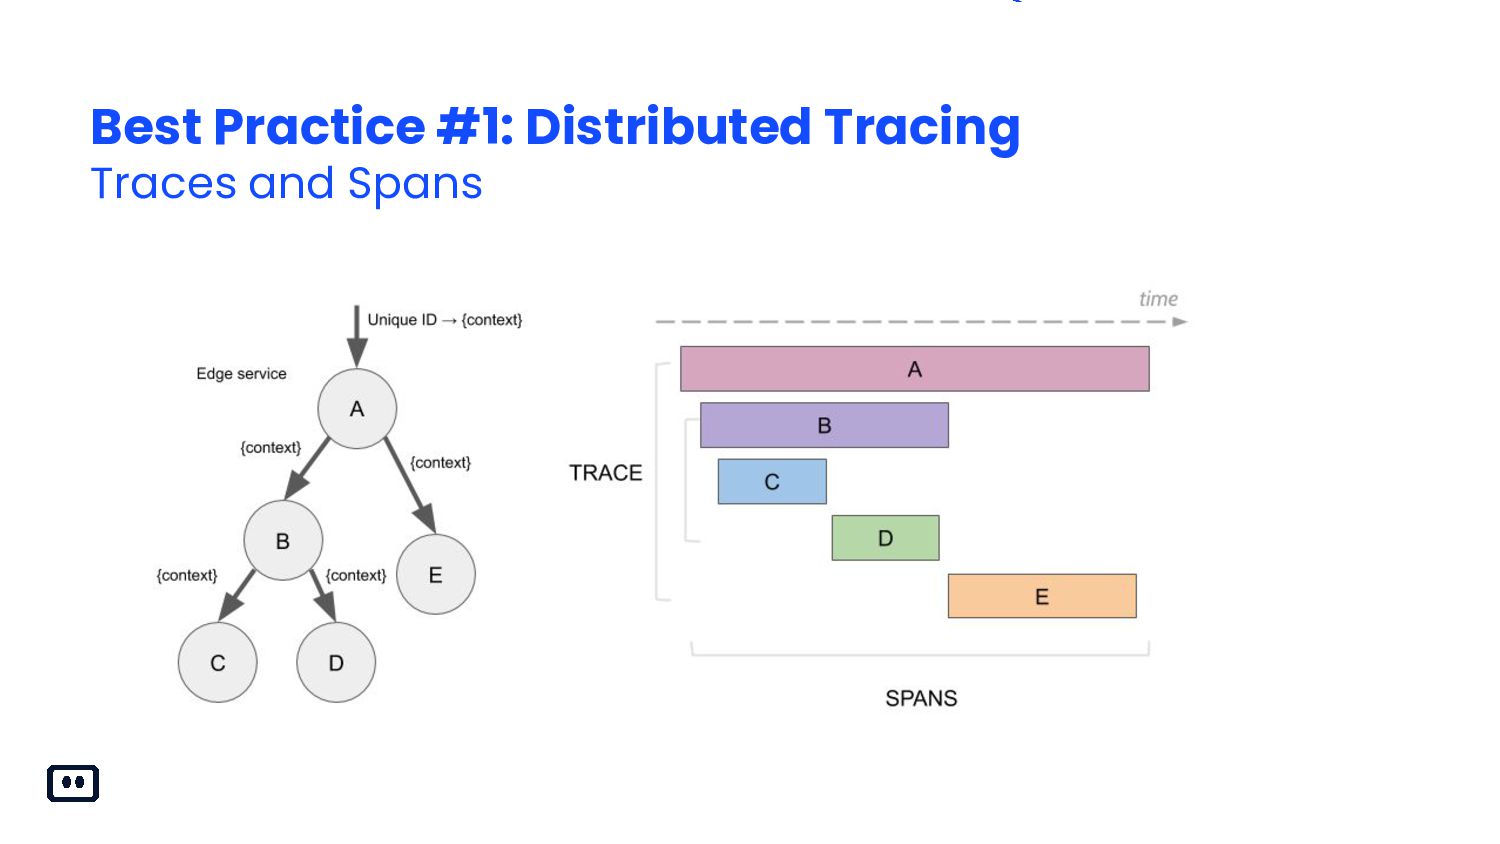
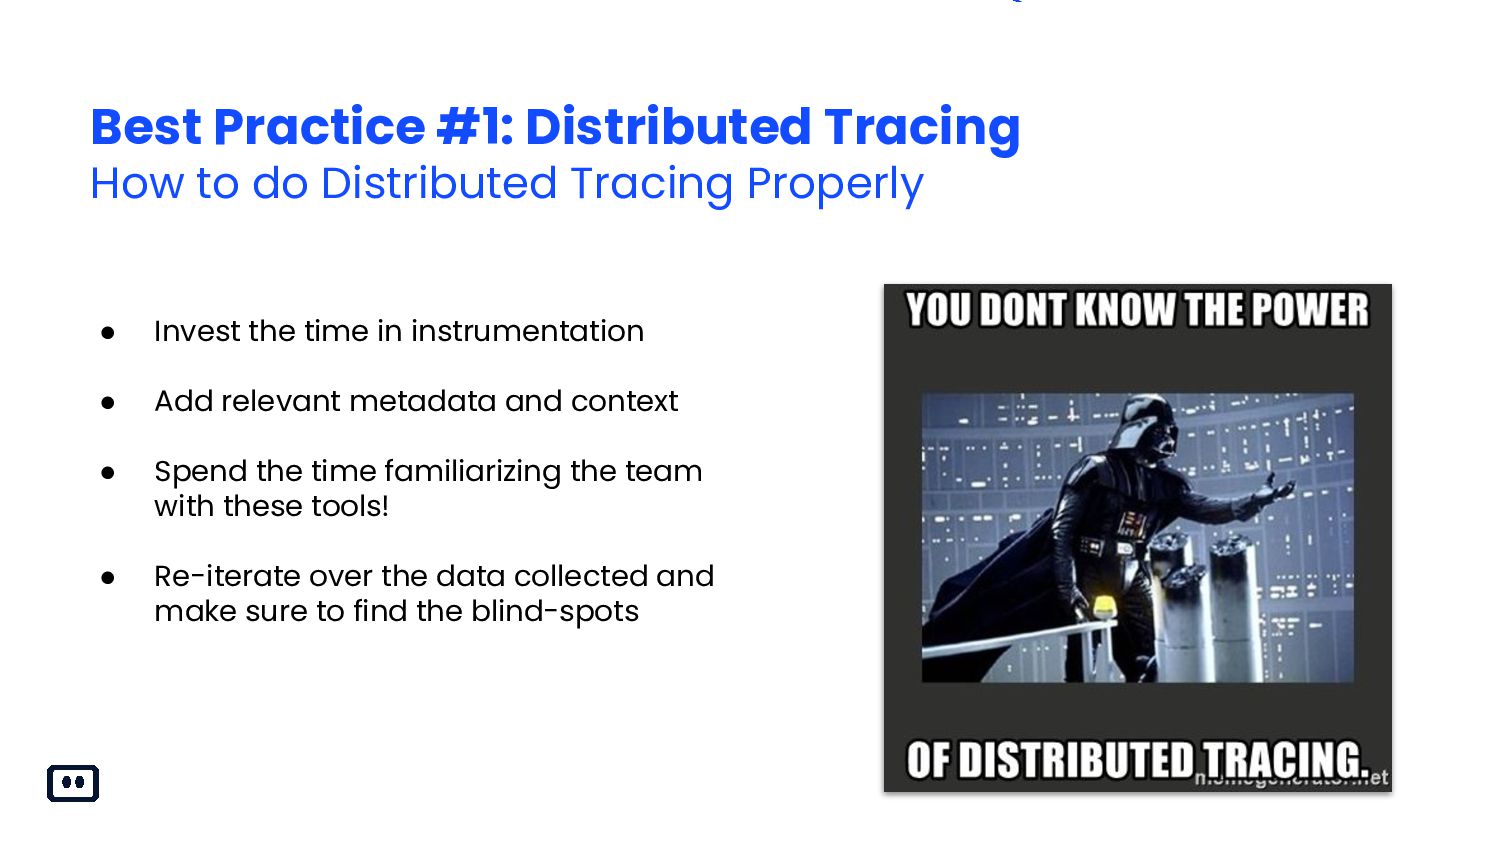
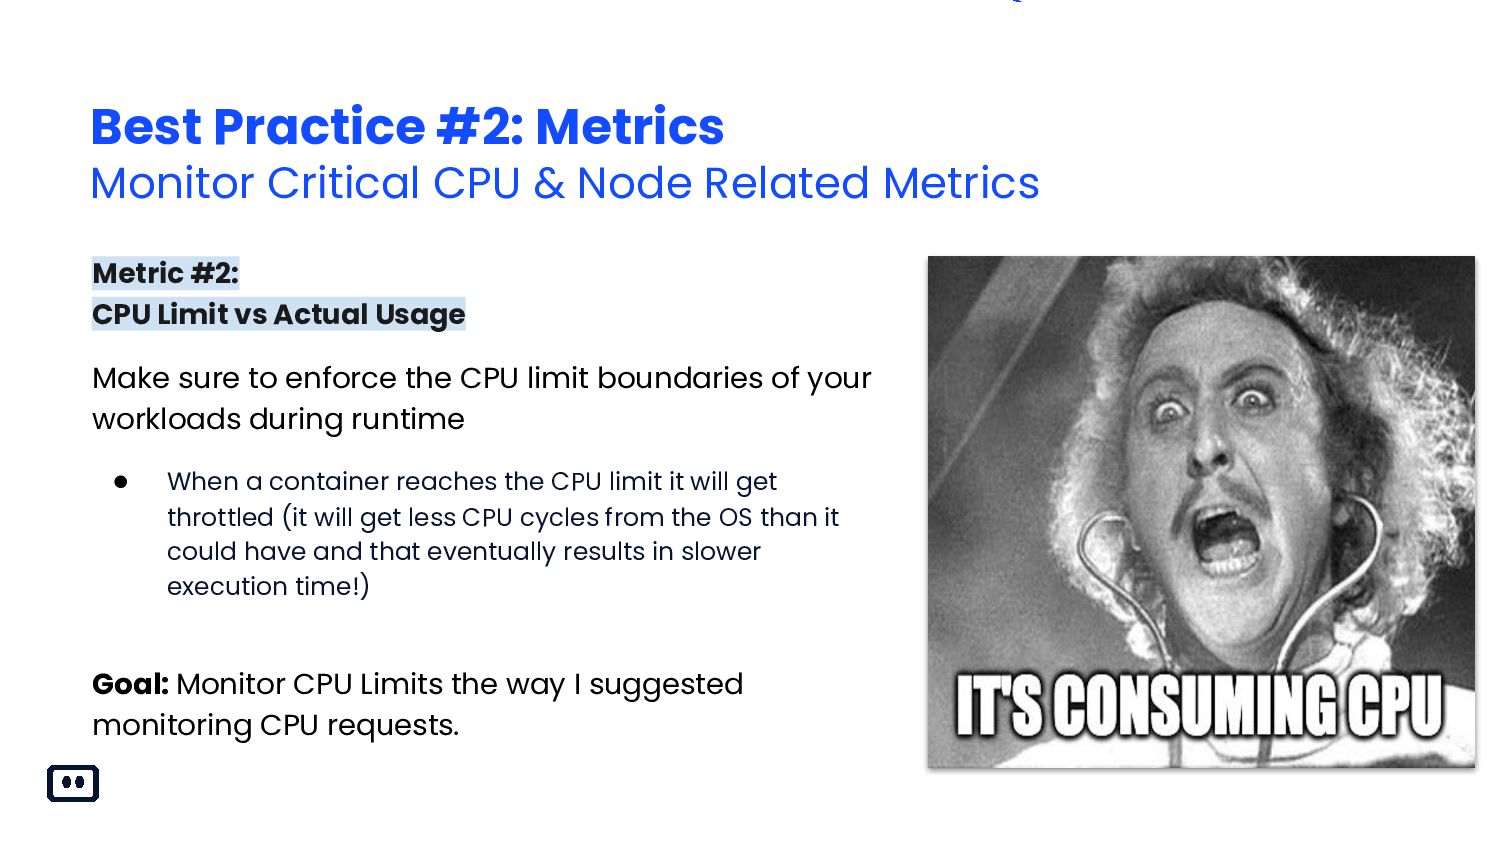
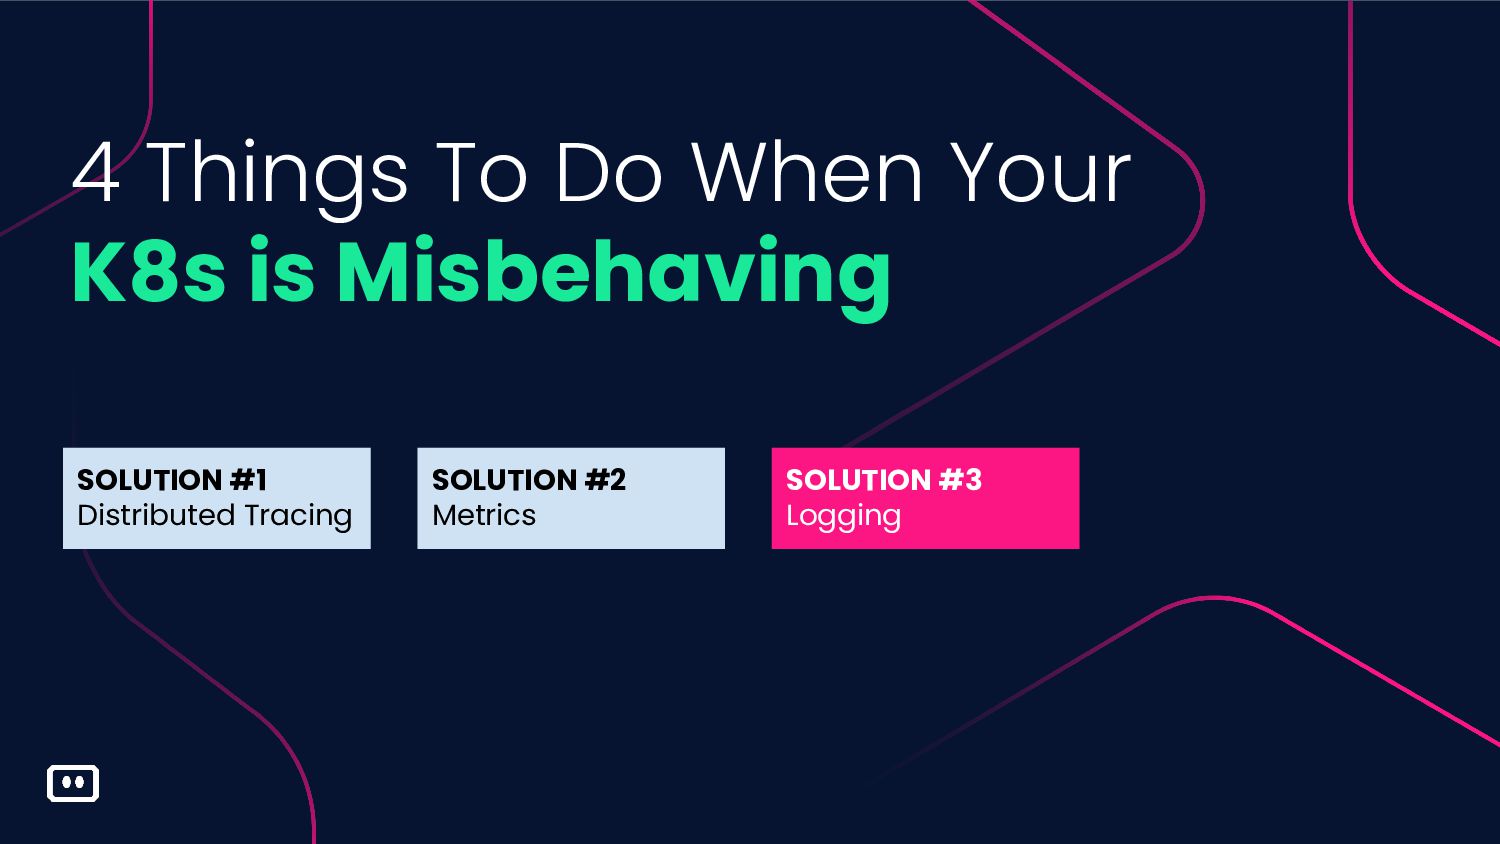
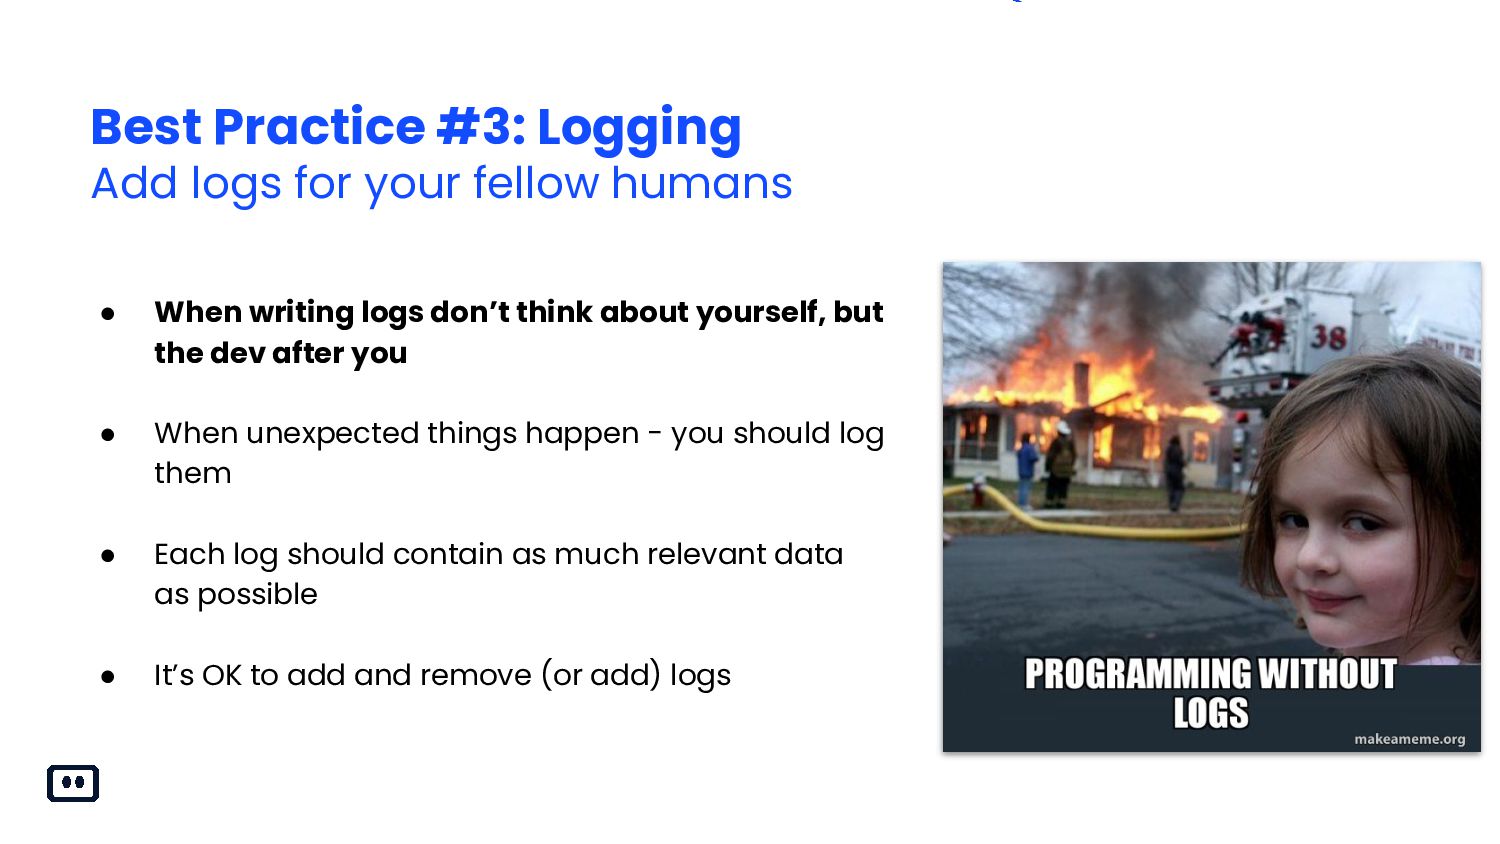
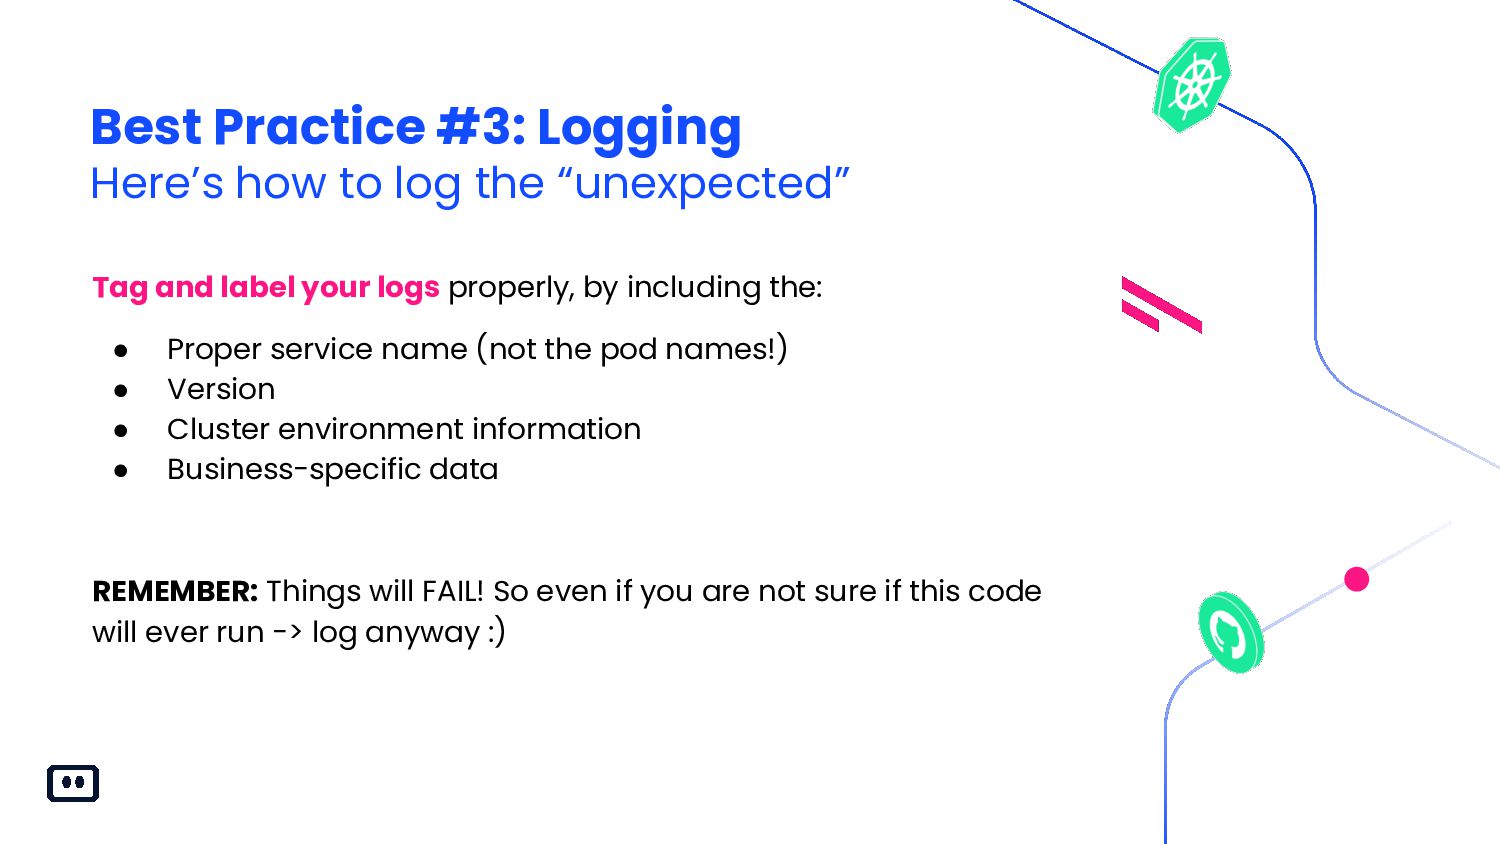
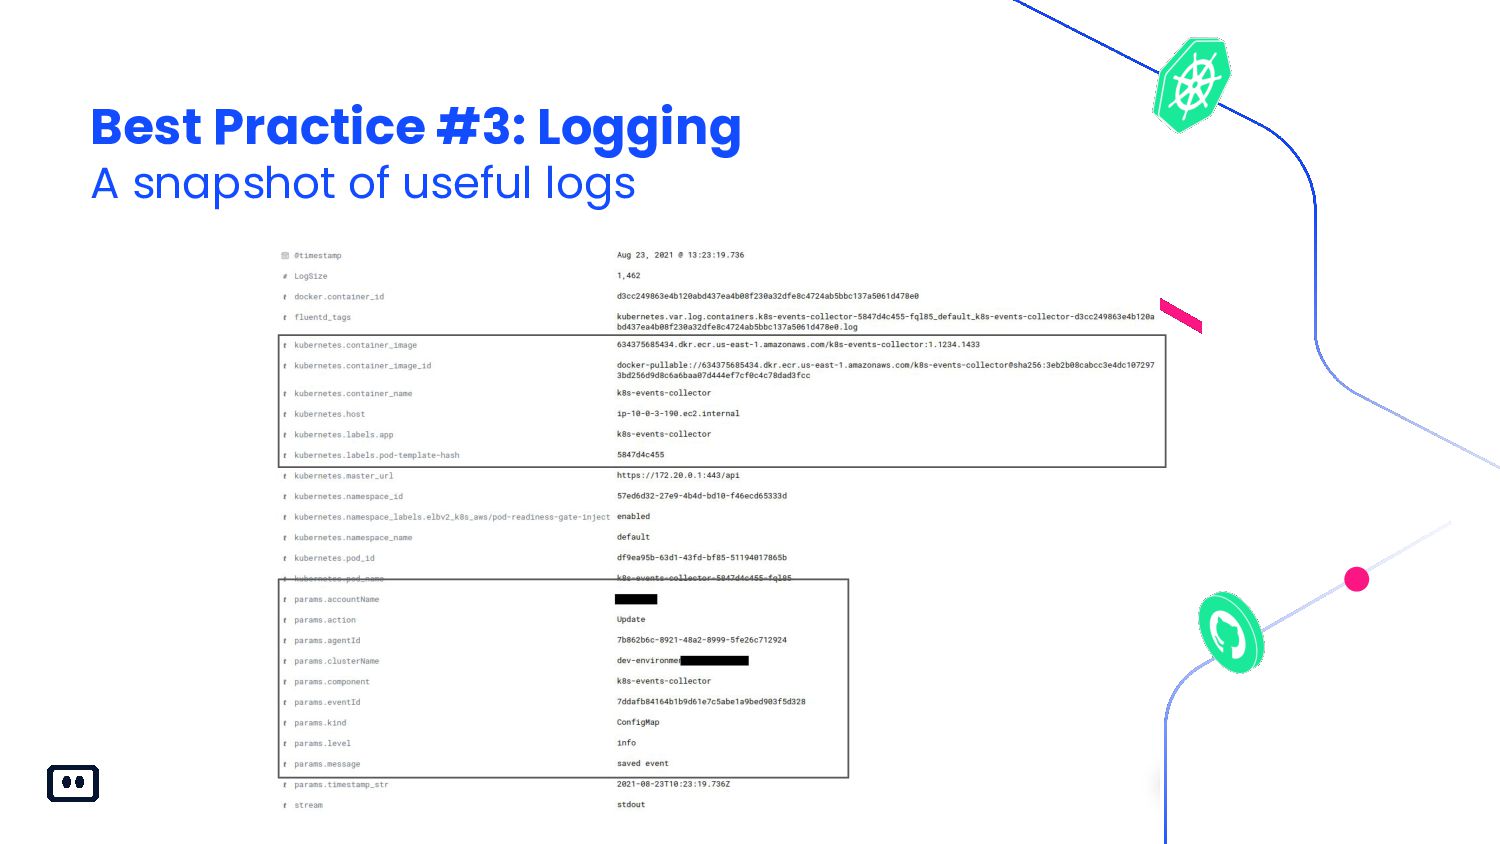
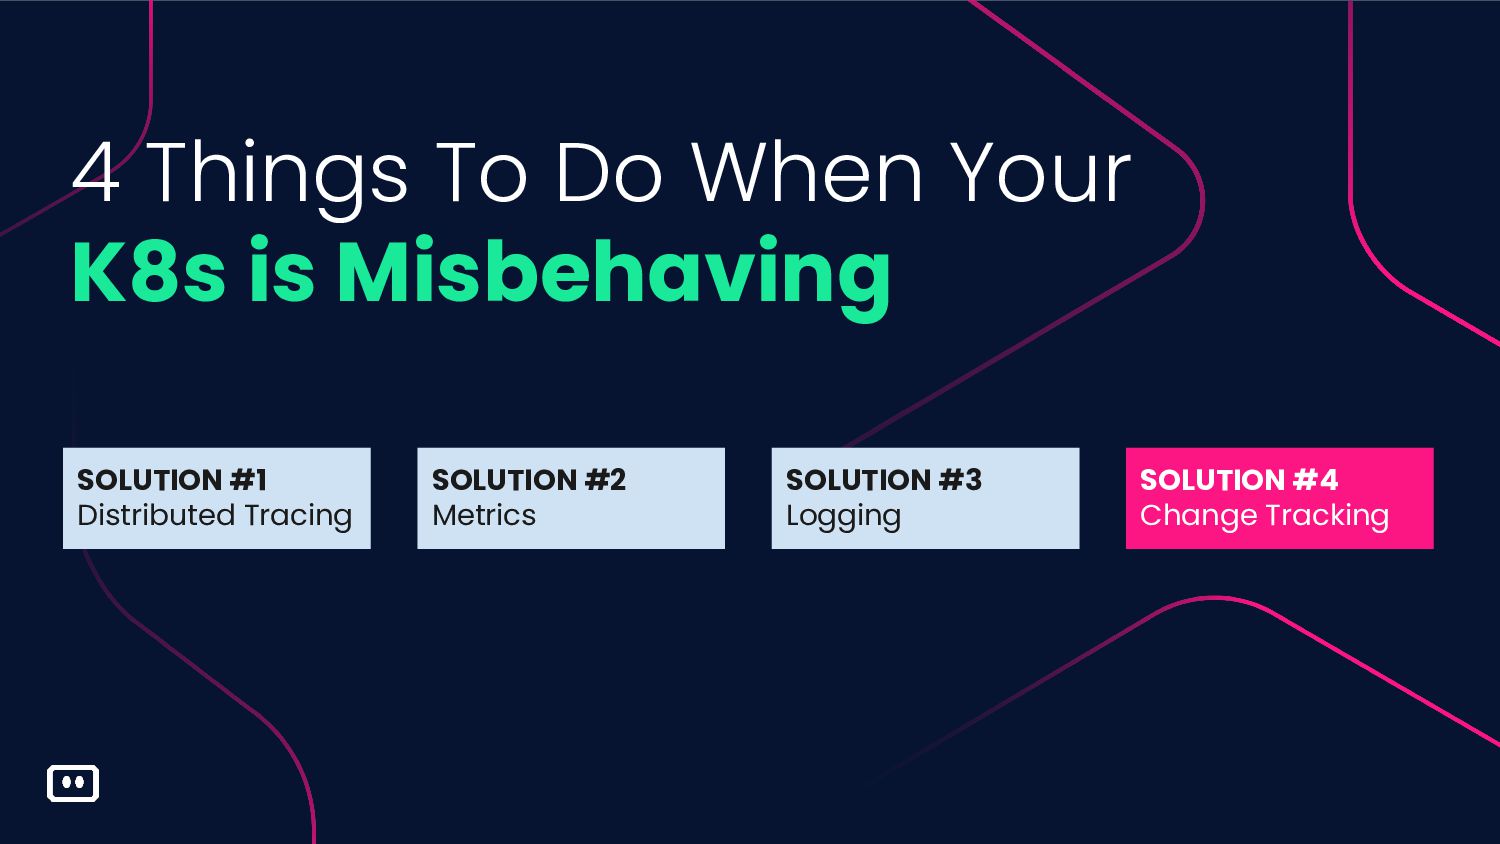
We will laugh a little and cry a little, as we cover Kubernetes monitoring, observability & troubleshooting best practices and talk about metrics, distributed tracing, logging, network visualization, and more. But cheer up! We’ll wrap up by introducing some helpful tools, in order to find and fix issues as fast as possible.

Komodor

May 06, 2022
Tweet

More Decks by Komodor

Other Decks in Programming

Transcript

  1. Komodor <> Epsagon | May 2021 How to Cope When

    Your Kubernetes Misbehaves Itiel Shwartz, Co-Founder & CTO @ Komodor
  2. Cloud native | March 2021 DevOps Days Buffalo | October

    2021 • The CTO and co-founder of Komodor, a startup building the first k8s-native troubleshooting platform. • A big believer in dev empowerment and moving fast. • Worked at eBay, Forter and Rookout (first developer). A lot of backend and infra dev experience (“DevOps”) • K8S fan 😃 Who am I?
  3. Cloud native | March 2021 Source: CNCF 2022 Announcements About

    Container and Kubernetes Adoption “The usage of Kubernetes is continuing to grow and reached its highest level ever, with 96% of organizations using or evaluating the technology.”
  4. Cloud native | March 2021 • People abuse it •

    It looks easy to start… until you understand that it isn’t • We are going to talk about moving fast, while staying alive • By the end of this session, you will be more proficient on how to manage your K8S system Kubernetes is complex.
  5. Cloud native | March 2021 What Makes K8s Troubleshooting So

    Complex? Issues happen on a daily basis and it’s almost impossible to understand what causes them. 85% of incidents can be traced to system changes: Blind spot Changes are unaudited or hidden Fragmented data Events are scattered between hundreds of different tools Butterfly effect Distributed systems makes it harder to understand the effect of a single change
  6. Cloud native | March 2021 So What Are The 4

    Things You Can Do When Your K8s is Misbehaving?
  7. Cloud native | March 2021 SOLUTION #1 Distributed Tracing 4

    Things To Do When Your K8s is Misbehaving
  8. Investors | January 2021 Investors | January 2021 Best Practice

    #1: Distributed Tracing Traces and Spans
  9. Investors | January 2021 Investors | January 2021 Best Practice

    #1: Distributed Tracing Why Distributed Tracing is IMPORTANT • Troubleshooting & debugging techniques differ among monolithic and multiverse architectures ◦ Monolithic troubleshooting approach: isolate a single instance of the monolith and reproduce the problem ◦ Microservices troubleshooting approach: Unlike above, this approach is no longer feasible, because no single service provides a complete picture of the performance or correctness of the app as a whole
  10. Investors | January 2021 Investors | January 2021 Best Practice

    #1: Distributed Tracing How to do Distributed Tracing Properly • Invest the time in instrumentation • Add relevant metadata and context • Spend the time familiarizing the team with these tools! • Re-iterate over the data collected and make sure to find the blind-spots
  11. Cloud native | March 2021 SOLUTION #1 Distributed Tracing 4

    Things To Do When Your K8s is Misbehaving SOLUTION #2 Metrics
  12. Investors | January 2021 Investors | January 2021 Metric #1:

    CPU Requests vs Actual Usage Make sure that your requests are aligned with your actual usage ◦ If Requests < actual usage (over utilization) Your app will work slower due to insufficient resources on the node ◦ If Requests > actual usage (under utilization) You’ll be “wasting” cores on your nodes which will be unused Goal: Define the pod requests as 100% and aim for an actual usage rate of 60%–80% on the 90th percentile Best Practice #2: Metrics Monitor Critical CPU & Node Related Metrics
  13. Investors | January 2021 Investors | January 2021 Metric #2:

    CPU Limit vs Actual Usage Make sure to enforce the CPU limit boundaries of your workloads during runtime • When a container reaches the CPU limit it will get throttled (it will get less CPU cycles from the OS than it could have and that eventually results in slower execution time!) Goal: Monitor CPU Limits the way I suggested monitoring CPU requests. Best Practice #2: Metrics Monitor Critical CPU & Node Related Metrics
  14. Investors | January 2021 Investors | January 2021 Metric #3:

    Nodes Failing Status Checks Common node health statuses: • Ready • DiskPressure • MemoryPressure • PIDPressure • NetworkUnavailable If the ready status is False or any of the other conditions turn positive → something bad is up! Best Practice #2: Metrics Monitor Critical CPU & Node Related Metrics
  15. Cloud native | March 2021 SOLUTION #1 Distributed Tracing 4

    Things To Do When Your K8s is Misbehaving SOLUTION #2 Metrics SOLUTION #3 Logging
  16. Investors | January 2021 Investors | January 2021 • When

    writing logs don’t think about yourself, but the dev after you • When unexpected things happen - you should log them • Each log should contain as much relevant data as possible • It’s OK to add and remove (or add) logs Best Practice #3: Logging Add logs for your fellow humans
  17. Investors | January 2021 Investors | January 2021 Tag and

    label your logs properly, by including the: • Proper service name (not the pod names!) • Version • Cluster environment information • Business-specific data REMEMBER: Things will FAIL! So even if you are not sure if this code will ever run -> log anyway :) Best Practice #3: Logging Here’s how to log the “unexpected”
  18. Cloud native | March 2021 SOLUTION #1 Distributed Tracing 4

    Things To Do When Your K8s is Misbehaving SOLUTION #2 Metrics SOLUTION #3 Logging SOLUTION #4 Change Tracking
  19. Investors | January 2021 Investors | January 2021 Best Practice

    #4: Change Tracking Adding the Final Missing Piece • No monitoring or observability tool provides a system-wide, historical (and present) view of changes in a simple UI • It requires a lot of manual work to extrapolate specific data about your overall system and its components • This is why K8s-native troubleshooting tools are a necessity to gain the necessary context and overview to troubleshoot effectively.
  20. Cloud native | March 2021 The TL:DR Prepare for the

    Failure of State of Mind Failure is inevitable. So make sure you remember and think of the following: • Nothing beats preparation! • Change of the state will result in change of overall resilience of the system • If your team is afraid of failing, invest more in the right tools and the right culture
  21. Q&A

  22. Our Komodor reps are waiting for you! Are You Feeling

    Lucky?! Swing by Komodor’s booth to enter our live raffle tomorrow (28 April) at 2:15pm. Have a chat about K8s troubleshooting, claim your ticket, and stand a chance to take home one of TWO amazing prizes!