$30 off During Our Annual Pro Sale. View Details »

Operationalizing Data Science: Bringing Method to the Magic

Operationalizing Data Science: Bringing Method to the Magic

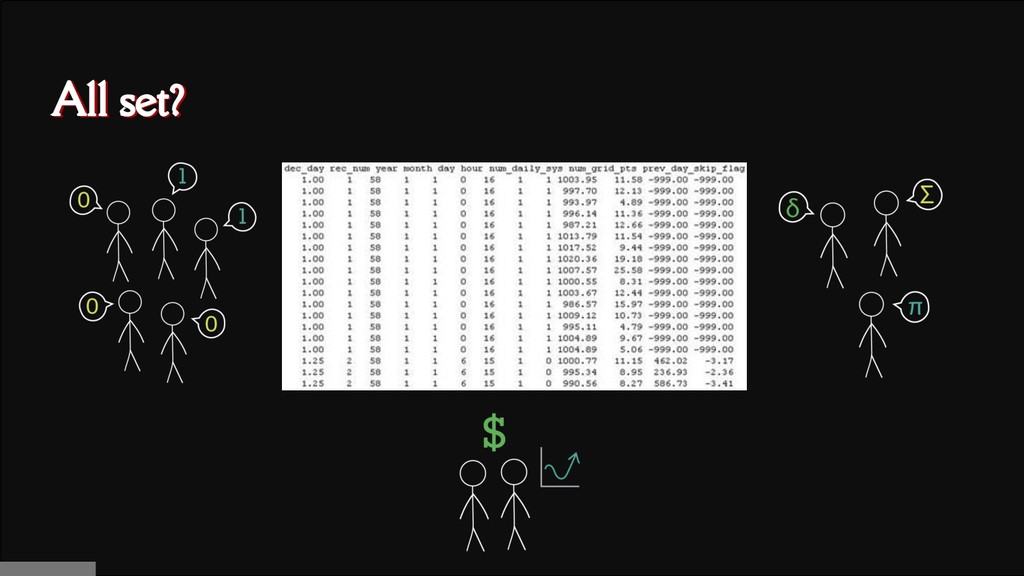
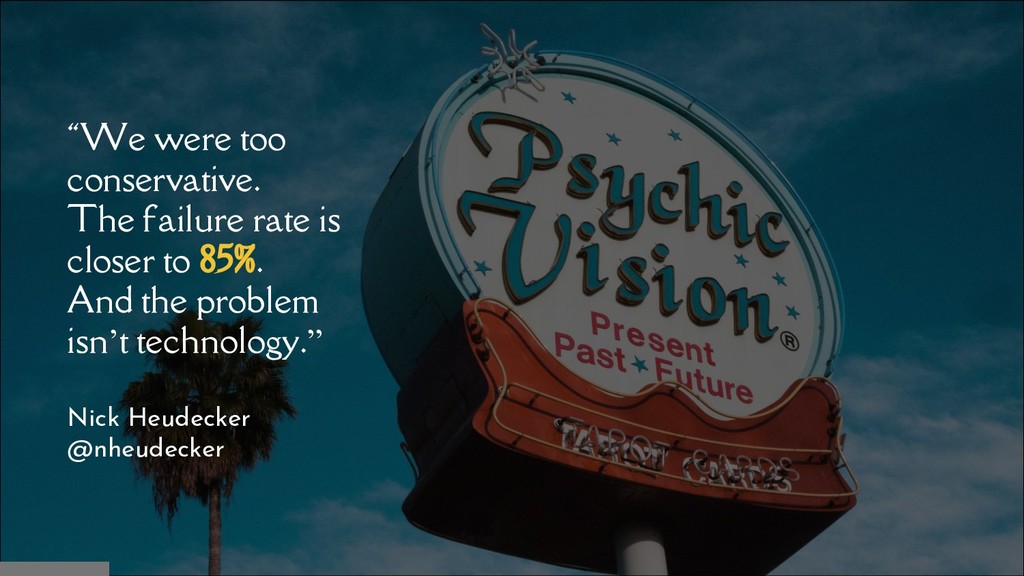
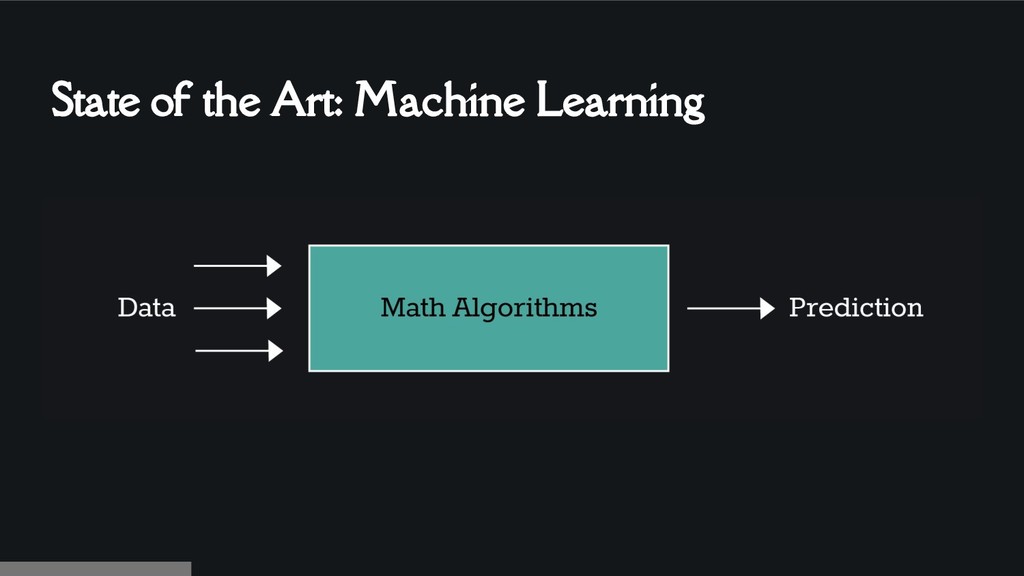
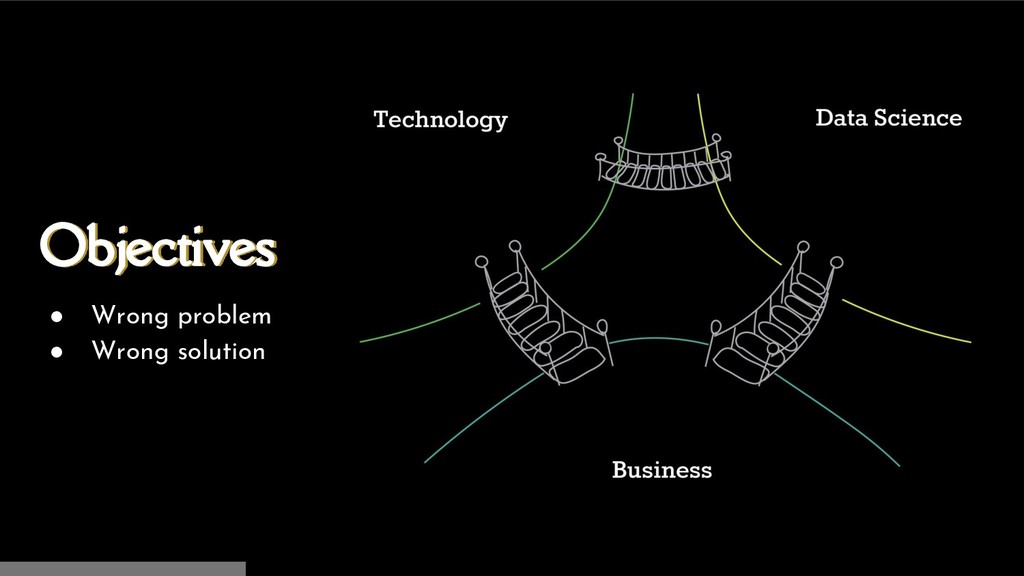
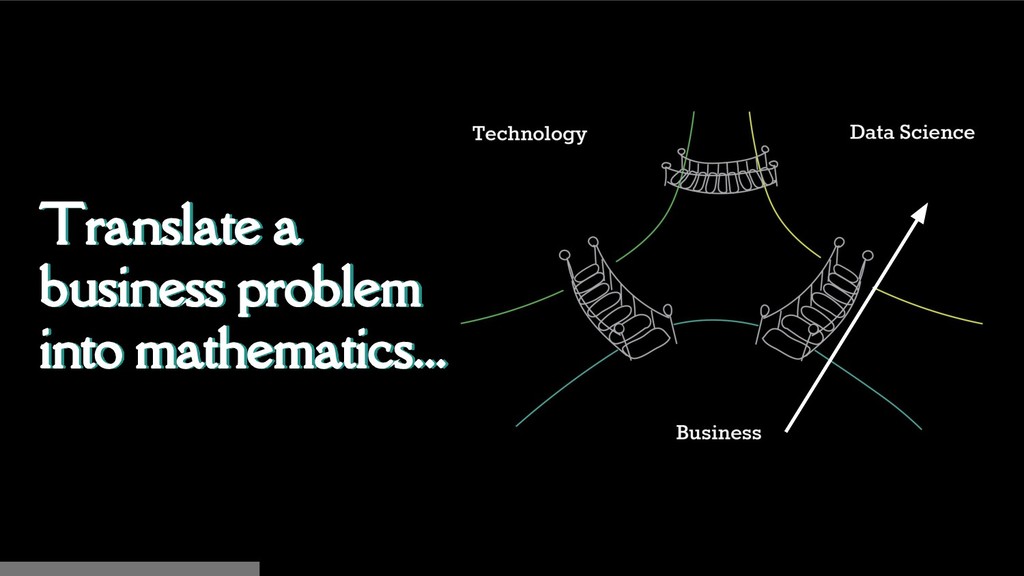
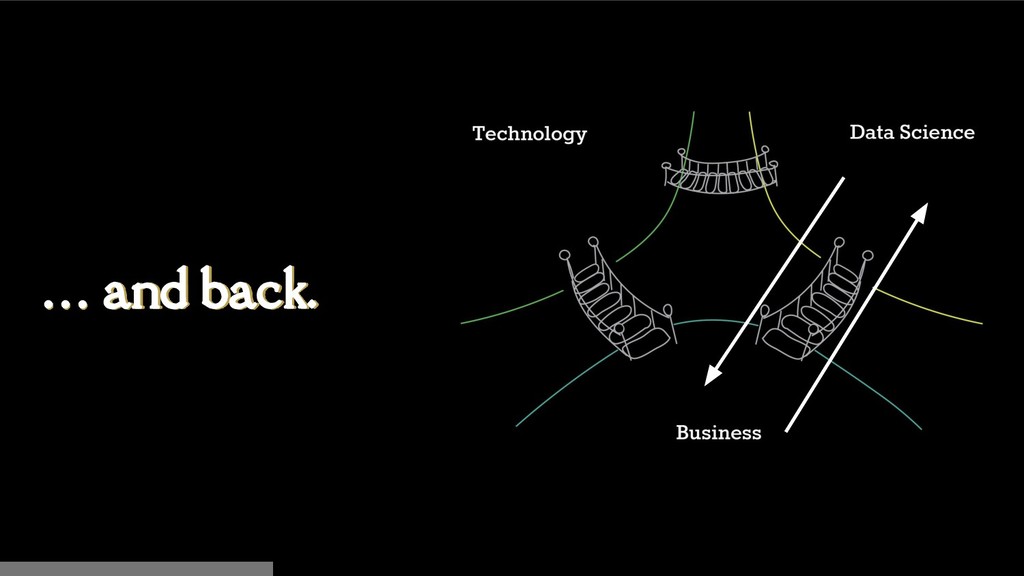
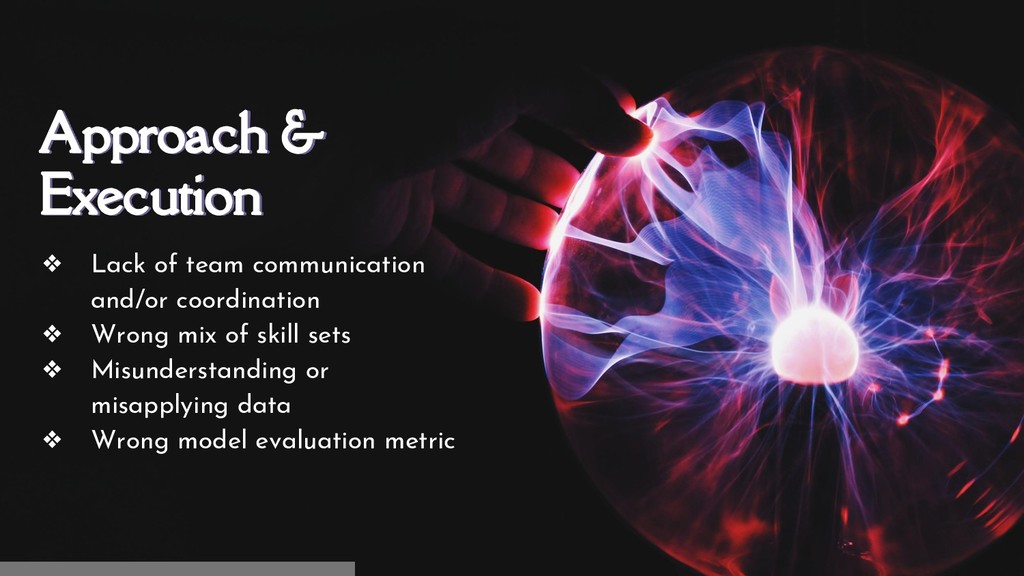
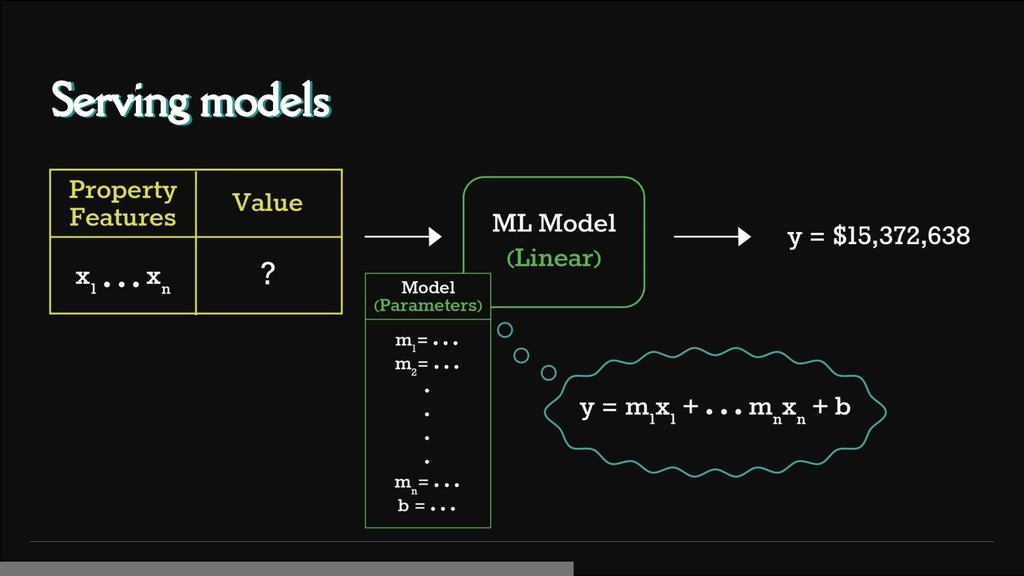
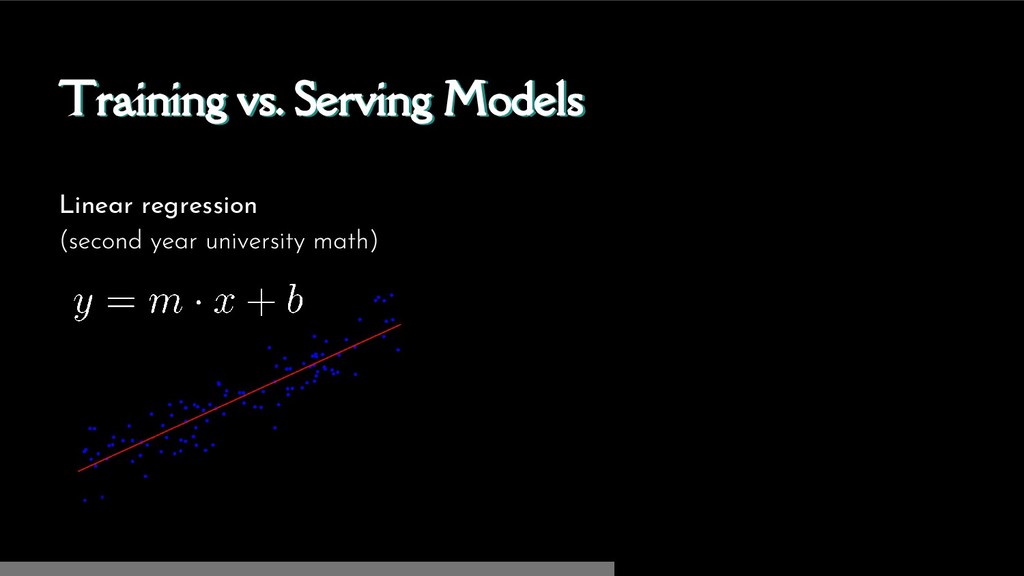
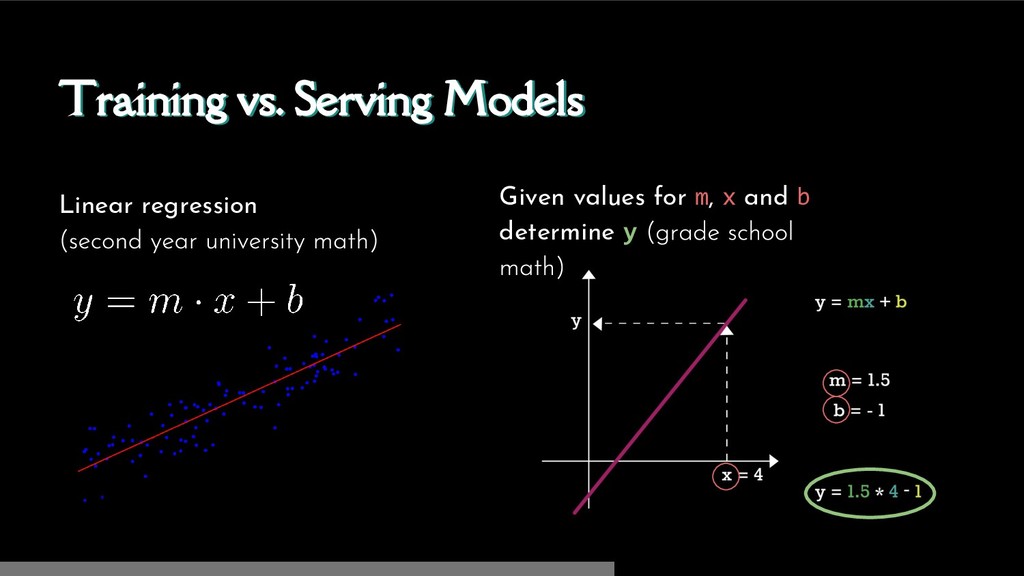
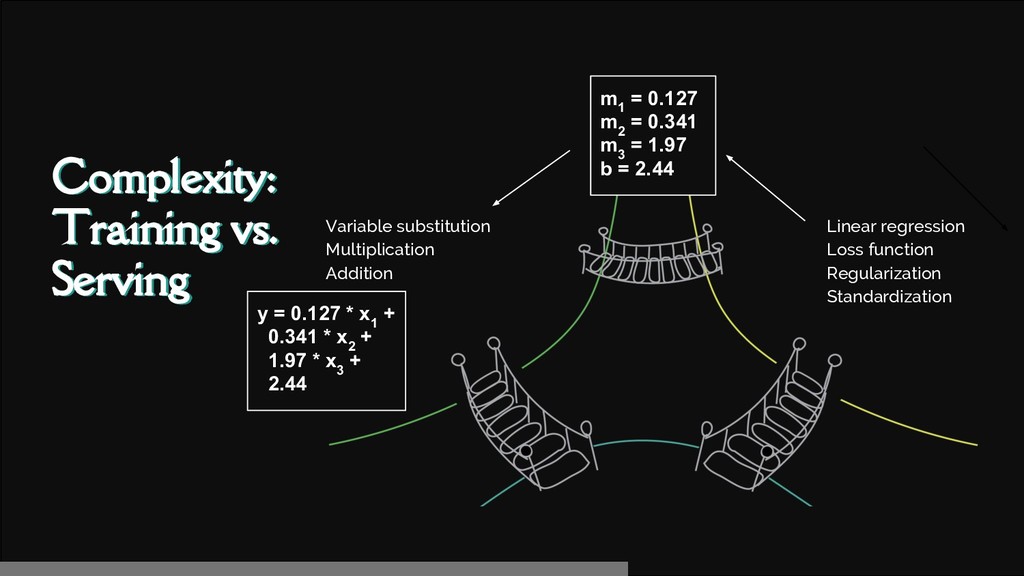
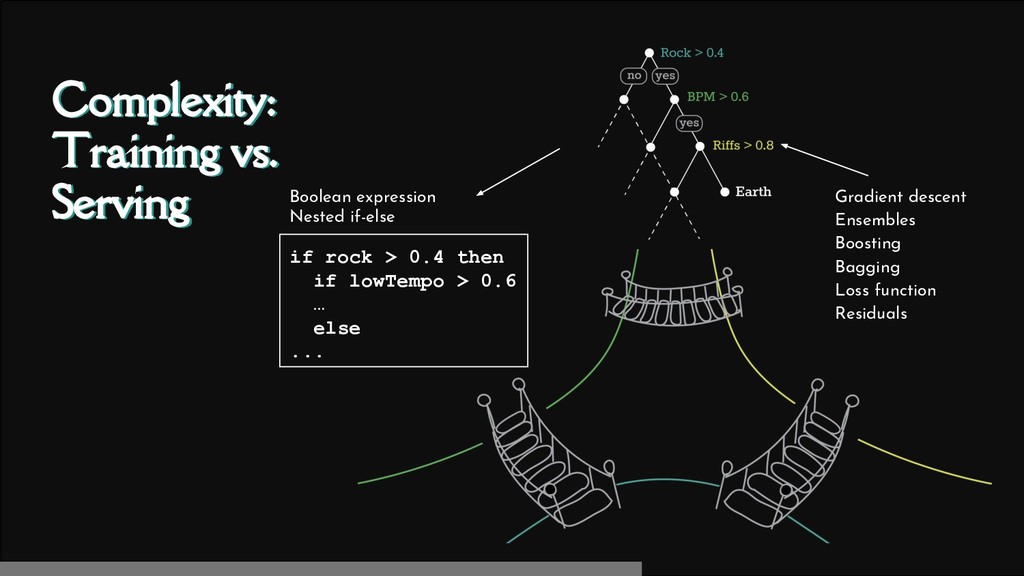
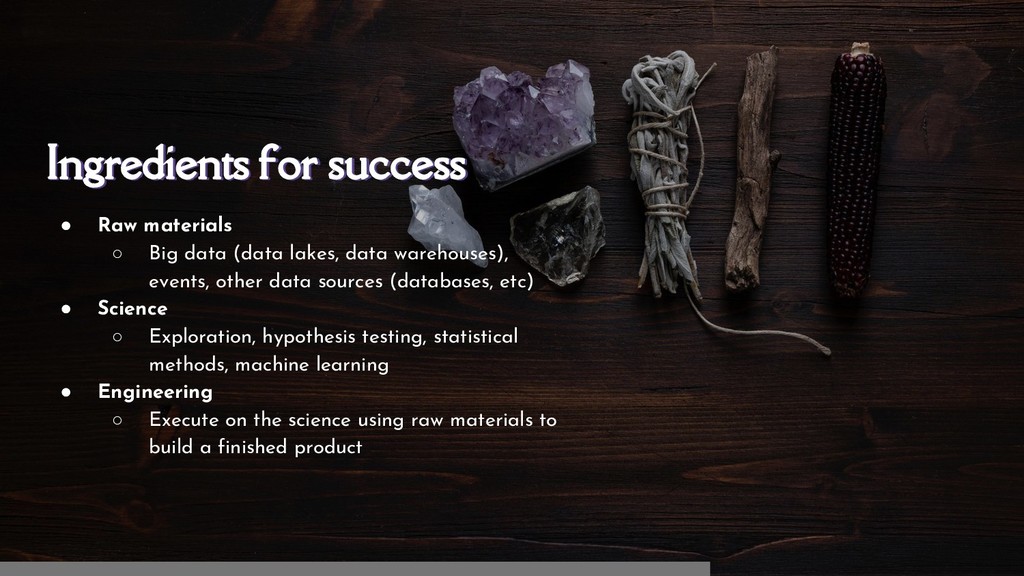
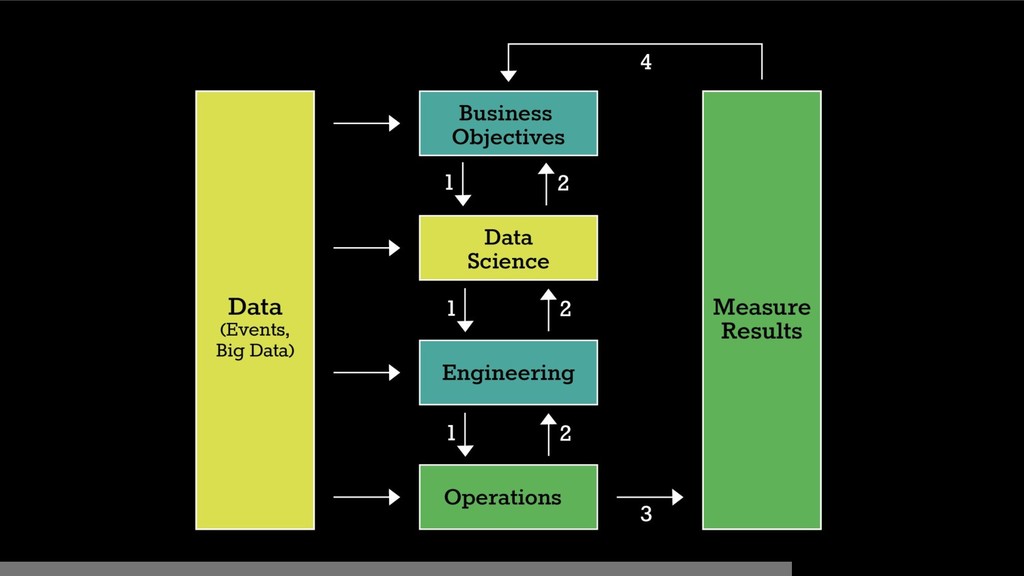
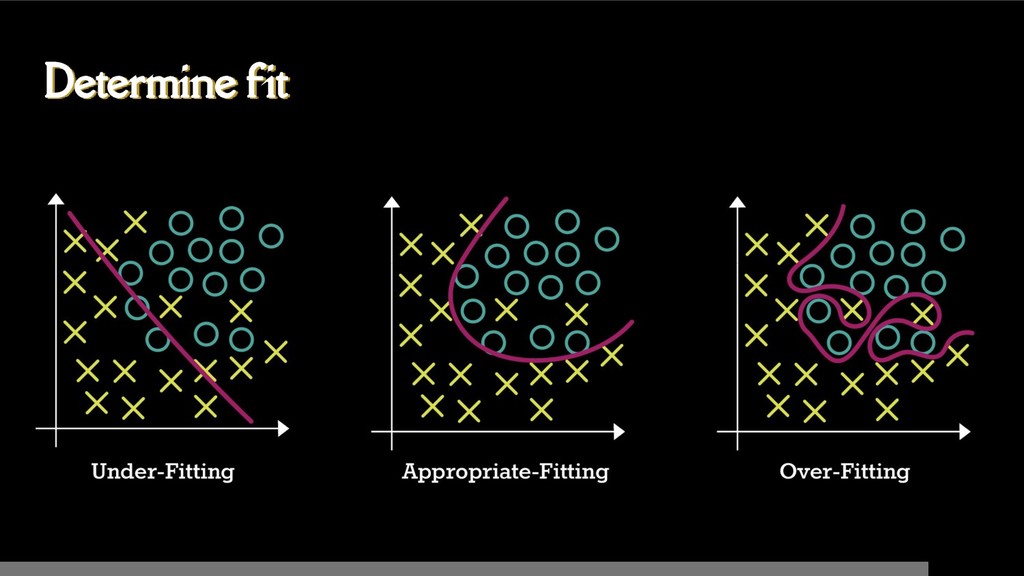
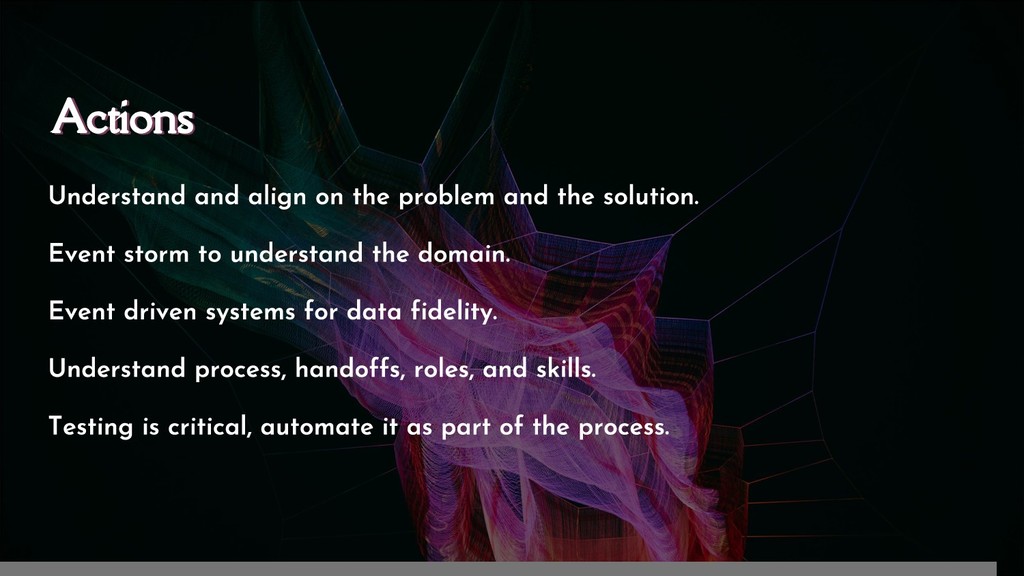
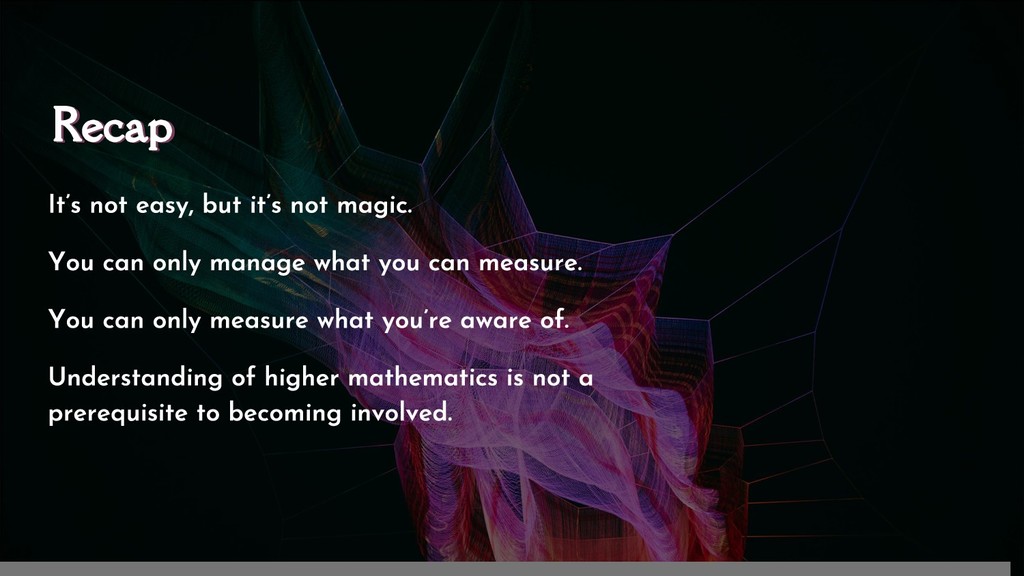
According to Gartner's Nick Heudecker, 85% of data science projects fail. This is a staggering ratio of failure that deserves consideration from your organization before undertaking your next data science initiative. In order to keep your team from falling into the chasm of failed data science three key ingredients are required for your next project: events, engineering, and teamwork.

Kevin Webber

October 24, 2018
Tweet

More Decks by Kevin Webber

Other Decks in Technology

Transcript

  1. Operationalizing
    Data Science
    Bringing Method
    to the Magic

    View Slide

  2. Data Science is the new black
    How many people are working in
    data science or on machine
    learning systems?

    View Slide

  3. Data Science is the new black
    How many people wish they were
    working in data science or on
    machine learning systems?

    View Slide

  4. Music recommendations
    “I see you enjoy Rod Stewart
    and Kenny G, perhaps you’d
    also like to hear some...

    View Slide

  5. Music recommendations
    “I see you enjoy Rod Stewart
    and Kenny G, perhaps you’d
    also like to hear some...

    View Slide

  6. User music
    affinity profile
    “user_19234”: {
    “genre”: {
    “rock”: {
    “affinity”: 0.89,
    “subgenres”: {
    “classic”: …

    “progressive”: …
    .
    .
    .

    View Slide

  7. Music recommendation rules
    .
    .
    else if metal > 0.3 && classical > 0.2 then
    (‘Apocalyptica’, ‘Inquisition Symphony’)
    .
    .
    .
    else if country > 0.23 && rock > 0.31) then
    if punk > fuzz then
    (‘The Knitters’, ‘Poor Little Critter..’)
    else
    (‘The Sadies’, ‘Darker Circles’)
    .
    .
    .
    “user_19234”: {
    “genre”: {
    “rock”: {
    “affinity”: 0.89,
    “subgenres”: {
    “classic”: …

    “progressive”: …
    .
    .
    .

    View Slide

  8. All set?

    View Slide

  9. “We were too
    conservative.
    The failure rate is
    closer to 85%.
    And the problem
    isn’t technology.”
    Nick Heudecker
    @nheudecker

    View Slide

  10. Outline
    What goes wrong?
    What actions can help
    mitigate common causes
    of failure?
    What can the
    reactive community
    can bring?
    1 2 3

    View Slide

  11. Machine
    Learning 101

    View Slide

  12. Predictions

    View Slide

  13. Predictions
    Classical approach:
    Huff the “spirit of the gods”

    View Slide

  14. 20th Century Predictions: Expert Systems
    .
    .
    .
    else if metal > 0.3 && classical > 0.2 then
    (‘Apocalyptica’, ‘Inquisition Symphony’)
    .
    .
    .
    else if country > 0.23 && rock > 0.31 then
    if punk > fuzz then
    (‘The Knitters’, ‘Poor Little Critter..’)
    else
    (‘The Sadies’, ‘Darker Circles’)
    .
    .
    .

    View Slide

  15. State of the Art: Machine Learning
    Math algorithms

    View Slide

  16. Machine Learning:
    Ingredients
    ● Data
    ● Learning algorithms
    ● Serving models

    View Slide

  17. What Goes Wrong?

    View Slide

  18. What goes wrong?
    ● Objectives
    ● Approach & Execution
    ● Technical

    View Slide

  19. Objectives Organizational level understanding
    ● Wrong problem
    ● Wrong solution
    ● Wrong problem
    ● Wrong solution

    View Slide

  20. Translate a
    business problem
    into mathematics...
    Organizational level understanding
    ● Wrong problem
    ● Wrong solution

    View Slide

  21. … and back.
    Organizational level understanding
    ● Wrong problem
    ● Wrong solution

    View Slide

  22. Framing the problem
    Loan approvals:
    Which applications
    should we approve?
    Which applications
    should we deny?

    View Slide

  23. The Monkey’s Paw
    Be very careful what you wish for.

    View Slide

  24. “Produce an approval process that we deny any applicant
    that has a high chance of defaulting on their loan.”
    The Monkey’s Paw

    View Slide

  25. What goes wrong
    applications map { applicant =>
    deny(applicant)
    }

    View Slide

  26. Setting up the problem
    If I could predict ...
    I would take the following action(s) …
    And would expect to observe a change in ...

    View Slide

  27. Approach &
    Execution
    ❖ Lack of team communication
    and/or coordination
    ❖ Wrong mix of skill sets
    ❖ Misunderstanding or
    misapplying data
    ❖ Wrong model evaluation metric

    View Slide

  28. Predicting
    Real-Estate Values
    Use various factors such as building
    qualities, infrastructure and interest
    rates to predict the value of
    real-estate.

    View Slide

  29. What are
    we trying to
    build?

    View Slide

  30. We need
    to sort out:
    What needs to be done?
    Who is doing it?
    What skills do they need?
    What artefacts are produced and
    handed off?

    View Slide

  31. Data engineering

    View Slide

  32. Feature engineering

    View Slide

  33. ML Model Selection
    Type of problem: Regression, classification, etc.
    Predict a
    continuous ‘value’,
    e.g. property price.
    Predict a discrete
    category,
    e.g. approve / deny.

    View Slide

  34. ML Model Selection
    Type of problem: Regression, classification, etc.
    Predict a
    continuous ‘value’,
    e.g. property value.

    View Slide

  35. ML Model Selection
    Type of problem: Regression, classification, etc.
    What type of learning model (training algorithm)?
    (Linear, neural nets, trees/forests, etc.)
    This will determine the general ‘shape’ of a trained model.

    View Slide

  36. ML Model Selection
    What type of training algorithm? Linear regression
    What general ‘shape’ does a trained model have?
    “Line of best fit
    through the data”

    View Slide

  37. Training Data

    View Slide

  38. Training models

    View Slide

  39. Our machine learning algorithm will determine optimal
    values for m
    i
    and b from data (model training).

    View Slide

  40. Evaluating
    trained
    models

    View Slide

  41. Aside: Evaluating trained models
    Evaluation is the only practical way we have of knowing
    how well the model works (without going to production and
    waiting).

    View Slide

  42. Aside: Evaluating trained models
    There are important, business relevant considerations here!
    E.g. cost of false positive (denied loan to good applicant)
    vs. false negative (approved loan for bad credit risk).

    View Slide

  43. Serving models

    View Slide

  44. Model serving is the process of using a trained model to
    serve predictions at speed and scale in production.
    From model training
    From request instance
    Nbhd
    Sq ft
    Yr Built

    View Slide

  45. Training vs. Serving Models
    Linear regression

    View Slide

  46. Training vs. Serving Models
    Linear regression
    y = 0.15*x + 5
    Given values for m, x and b
    determine y

    View Slide

  47. Linear regression
    Loss function
    Regularization
    Standardization
    m
    1
    = 0.127
    m
    2
    = 0.341
    m
    3
    = 1.97
    b = 2.44
    y = 0.127 * x
    1
    +
    0.341 * x
    2
    +
    1.97 * x
    3
    +
    2.44
    Complexity:
    Training vs.
    Serving
    Variable substitution
    Multiplication
    Addition

    View Slide

  48. Gradient descent
    Ensembles
    Boosting
    Bagging
    Loss function
    Residuals
    if rock > 0.4 then
    if lowTempo > 0.6

    else
    ...
    Boolean expression
    Nested if-else
    Complexity:
    Training vs.
    Serving

    View Slide

  49. Approach & Execution: Summary
    Lots of steps to the process.
    Lots of technical details and jargon.

    View Slide

  50. Approach & Execution: Summary
    What is my piece of the process?
    What do I need to understand to accomplish it?

    View Slide

  51. What Goes Right?

    View Slide

  52. What do we need to get right?
    ● Embracing events
    ● Handoff and collaboration
    ● Testing
    ● DevOps, DataOps, and “closing the loop”

    View Slide

  53. Ingredients for success
    ● Raw materials
    ○ Big data (data lakes, data warehouses),
    events, other data sources (databases, etc)
    ● Science
    ○ Exploration, hypothesis testing, statistical
    methods, machine learning
    ● Engineering
    ○ Execute on the science using raw materials to
    build a finished product

    View Slide

  54. Embrace Events

    View Slide

  55. Embrace Events
    In order to predict the future
    you must understand the past.

    View Slide

  56. Embrace Events
    Events are interesting things that have already
    happened. Events are always in the past.

    View Slide

  57. Embrace Events
    Events span all of history. An event can be 1ms
    ago or 10 years ago.

    View Slide

  58. Embrace Events
    Events are the core of our data analytics system.

    View Slide

  59. View Slide

  60. Align on the
    objectives and
    domain

    View Slide

  61. Event Storming
    Capturing the key business
    events.
    Can map analytics events
    back to the business context.

    View Slide

  62. Feature Extraction

    View Slide

  63. Handoffs and
    collaboration

    View Slide

  64. Who does what?
    Data science handoff:
    ● a trained model (i.e. parameter values
    that have been learned)
    ● how to extract the features needed
    by the model from the raw data
    ● start by reviewing and handing off
    versioned “design docs”
    ● once maturity is reached, automate
    handoffs
    Engineering next steps:
    ● turn a trained model into efficient
    production-quality code
    ● ensure efficient access to the data
    required by the trained model to
    make predictions
    ● reactive machine learning is critical
    to ensuring SLAs are met (latency,
    availability, etc)

    View Slide

  65. Training
    pipeline

    View Slide

  66. Model serving pipeline

    View Slide

  67. DevOps, DataOps,
    and closing the loop

    View Slide

  68. Testing
    Trained ML model

    View Slide

  69. Determine fit

    View Slide

  70. Full
    Testing
    Coverage
    ● Trained models
    ● Data (drift)
    ● Data models
    ● Data pipeline

    View Slide

  71. Version control
    ● Learning algorithm configuration
    ○ Hyperparameters, etc
    ● Pipeline processes and data transformations

    View Slide

  72. DataOps Goals
    ● ML processes is fully version controlled and
    reproducible
    ● Commiting changes kicks off tests to validate those
    changes, and triggers downstream processes
    ● CI/CD for ML

    View Slide

  73. Conclusion

    View Slide

  74. Actions

    View Slide

  75. Recap

    View Slide

  76. Let’s chat!
    Kevin Webber, RedElastic
    Principal Consultant
    [email protected]
    Dana Harrington, RedElastic
    Chief Scientist
    [email protected]

    View Slide